Micron’s AI-Driven Boom Faces a Much Tougher Earnings TestMicron Technology Inc. (MU, Financials) is heading toward its upcoming results with a challenge that is far more demanding than the usual question of whether it can beat Wall Street’s projections. The real issue is whether the AI boom has genuinely transformed Micron’s business, or whether the company is simply enjoying a powerful but temporary upcycle. That question is difficult to avoid when looking at Micron’s third-quarter figures, because the numbers are extraordinary.
Revenue rose to $41.46 billion from $9.30 billion a year earlier. Gross margin expanded to 84.9% from 39%. Adjusted earnings came in at $25.11 per share. Those are not ordinary improvements. They represent a dramatic shift in profitability and scale, and they help explain why investors are asking whether something fundamental has changed inside the memory-chip business.
Management is now guiding for fourth-quarter revenue of approximately $50 billion and gross margin of 86%. Wall Street is already aligned with that view. Consensus projections point to about $50.4 billion in revenue and $30.89 in adjusted earnings per share. That means simply surpassing expectations may not be enough by itself. When guidance and consensus are already so high, a beat can be dismissed as incremental rather than transformative. The larger clue may instead come from what Micron says about high-bandwidth memory, pricing trends, and its fiscal 2027 outlook.
High-bandwidth memory, or HBM, has become one of the most closely watched parts of the AI supply chain. It is used in advanced data-center hardware, and demand has grown rapidly as AI workloads require more memory bandwidth and efficiency. If Micron can show that its HBM business is scaling, that pricing remains firm, and that customers are committing to longer-term agreements, then the bull case becomes stronger. If guidance suggests that pricing is peaking or that demand visibility is weakening, then the market may begin to question whether the current boom is sustainable.
Investor Sharon McArd has argued that AI has made memory a more strategic aspect of data-center infrastructure. That is an important point. In the past, memory has often been viewed as a cyclical commodity business, subject to sharp swings in supply and demand. AI may be changing that perception. If memory is becoming a more critical and less interchangeable part of data-center design, then companies like Micron could enjoy stronger pricing power and more durable demand than they did in previous cycles.
Micron has also signed about $22 billion in client agreements. Those agreements include take-or-pay contracts, which give the company more visibility into future demand. Take-or-pay contracts are significant because they require customers to pay for a certain amount of product whether or not they ultimately take delivery. That kind of commitment can reduce uncertainty and provide a clearer picture of future revenue. It also suggests that some customers are willing to lock in supply, which can be a sign of confidence in Micron’s products and in the broader AI-driven demand environment.
Even so, expectations are already very high. The market is not waiting to be convinced that Micron’s recent results were strong. It already knows that. The harder test is whether those outsized statistics reflect a permanent change in the business or whether they are simply another memory bubble. On Sept. 30, Micron will face that test directly.
The upcoming report will therefore be about more than revenue and earnings per share. It will be a referendum on whether AI has structurally altered Micron’s earnings power. If management can provide convincing guidance on HBM, pricing, and fiscal 2027, the company may be able to argue that this cycle is different. If not, investors may conclude that Micron is still a cyclical memory maker enjoying a temporary surge. The numbers will matter, but the forward-looking commentary may matter even more.
 Long
Long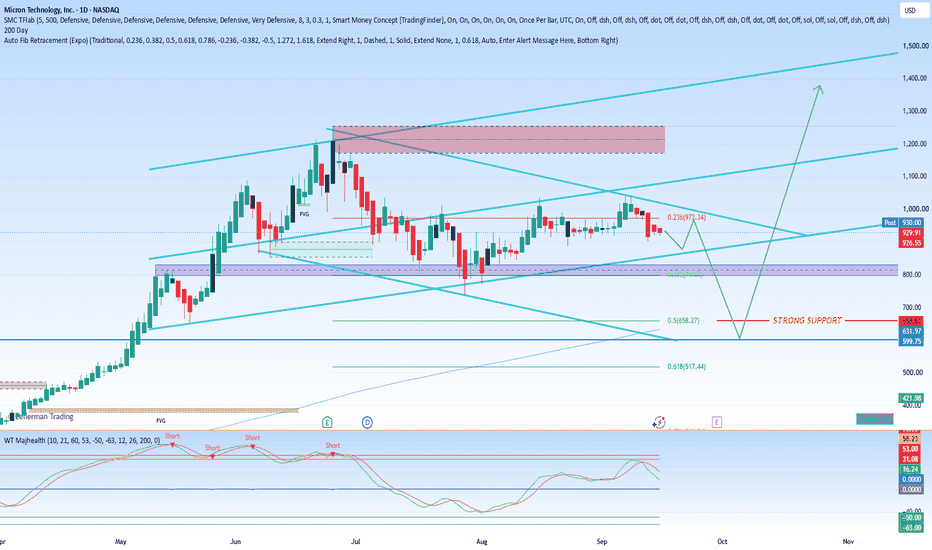
Britain Builds Steam Turbines Rolls-Royce Mini-Nuclear ReactorsBritish workers are set to manufacture steam turbines for Rolls-Royce’s planned fleet of small modular reactors (SMRs), in a move that promises to strengthen domestic manufacturing and reduce reliance on overseas suppliers for a critical piece of nuclear power equipment. Siemens Energy will produce the huge machines for the new generation of small modular reactors at its factory in Newcastle. The turbines will be used in the three Rolls-Royce-designed SMRs that are being built in Anglesey, as well as in further reactors that are set to be built in the Czech Republic and Sweden.
The decision marks a significant moment for British industry because it will be the first time in more than 20 years that large steam turbines have been made domestically. The expansion of the Newcastle factory will follow an investment understood to be worth tens of millions of pounds, and it is expected to create around 550 jobs. That combination of capital investment and skilled employment gives the announcement considerable weight, especially at a time when policymakers are focused on energy security, industrial capacity, and the resilience of supply chains.
The move also follows concerns raised by MPs that SMR components were set to be built abroad. Those concerns reflected a broader anxiety about whether Britain would capture the industrial benefits of its own nuclear ambitions or simply import the key parts from other countries. By choosing to manufacture the steam turbines in Newcastle, Siemens Energy and Rolls-Royce SMR are signalling that at least part of the supply chain will remain on British soil.
Rolls-Royce SMR said the decision by German engineering giant Siemens demonstrated how the company was “delivering its commitment to localisation, driving investment and re-shoring work that would have taken place overseas.” The phrase “re-shoring” is particularly important because it captures the idea of bringing back manufacturing activity that might otherwise have been located in another country. For supporters of domestic industry, that is a central part of the announcement’s appeal.
Rolls-Royce SMR is an independent company. It is majority owned by Rolls-Royce, but its investor base also includes Qatar and France’s Perrodo family. That structure means the business combines the heritage and engineering reputation of Rolls-Royce with additional international investment. The company’s chief executive, Chris Cholerton, framed the turbine decision as part of a longer industrial story. “We are building on a remarkable industrial legacy while creating and sustaining the skills and supply chain needed to deliver clean, secure and affordable energy for decades to come,” he said.
Darren Davidson of Siemens Energy also emphasised the wider significance of the work. “We’re preparing to manufacture the next generation of steam turbines for small modular reactors, supporting energy security, creating skilled jobs and helping power the UK’s future energy mix,” he said. His comments connect the project to three priorities that often appear together in debates about nuclear power: energy security, employment, and the transition to a lower-carbon energy system.
The Government awarded Rolls-Royce a contract to design and develop Britain’s first three SMRs last year. Those reactors will be built in Anglesey, North Wales, in a project aimed at proving the commercial viability of the still-nascent technology by the mid-2030s. Each reactor is expected to generate 470 megawatts of power. If the project succeeds, it could help establish small modular reactors as a viable option for producing reliable low-carbon electricity at a smaller scale than traditional large nuclear plants.
Rolls-Royce selected Siemens Energy as its supplier of steam turbines last year, but until now there had been uncertainty about where the key components would actually be manufactured. That uncertainty mattered because the location of manufacturing determines not only the direct economic benefits, such as jobs and investment, but also the strength of the domestic supply chain. The confirmation that the turbines will be built in Newcastle removes some of that ambiguity and gives the project a clearer industrial footprint.
The British company had faced a backlash earlier this year after it emerged that some other parts would be made overseas. Those parts included reactor pressure vessels that will be imported from either South Korea or the Czech Republic. That disclosure raised questions about how much of the SMR programme would genuinely support British manufacturing and how much would depend on foreign suppliers. The latest announcement does not answer every question about local content, but it does provide a notable counterweight by securing a high-value component for domestic production.
Taken together, the decision to build the steam turbines in Newcastle represents more than a single procurement choice. It is a signal about the kind of industrial ecosystem that Rolls-Royce SMR and its partners hope to create around small modular reactors. The project is still in its early stages, and the technology has yet to be proven commercially at scale. But the investment in the Newcastle factory, the creation of hundreds of jobs, and the return of large steam turbine manufacturing to Britain all suggest that the SMR programme is beginning to generate tangible industrial activity.
For the UK, the announcement touches on several important themes at once: the push to re-shore critical manufacturing, the desire to create skilled jobs in regions with strong industrial traditions, the need to strengthen energy security, and the ambition to develop a domestic nuclear supply chain. Whether those ambitions are fully realised will depend on the project’s execution over the coming years. For now, however, the decision to manufacture steam turbines in Newcastle gives the Rolls-Royce SMR programme a clearer domestic anchor and a more visible role in Britain’s industrial and energy future.  Long
Long
Webull Expands Futures Offering With CME Nano FuturesWebull, an online investment platform, announced today that eligible customers will soon have access to CME Group’s E-nano S&P 500 and E-nano Nasdaq-100 futures. The addition expands Webull’s existing futures offering by introducing smaller-sized contracts that allow retail investors to manage exposure to major U.S. equity indexes in more precise increments. The move is designed to make equity index futures more accessible to a broader range of retail traders while giving them additional tools to control position sizing and risk.
What Are CME Nano Futures?
CME Nano Futures are ultra-small equity index futures contracts. They are sized at one-tenth of comparable CME Micro E-mini futures. That smaller contract size is significant because it allows investors to take positions with less notional exposure and potentially lower dollar margin requirements. As a result, traders can gain greater control over position sizing and manage risk in smaller increments. For retail investors who may not want or need the exposure that comes with larger futures contracts, Nano Futures offer a more flexible way to participate in major equity index markets.
The launch reflects a broader trend in retail investing: demand for derivatives products that are accessible, precise, and tailored to different account sizes and risk preferences. By offering Nano Futures alongside its existing futures products, Webull is giving eligible customers another way to express a view on the S&P 500 or Nasdaq-100 without requiring the same capital commitment as larger contracts.
Management Commentary
Anthony Denier, Group President and U.S. CEO of Webull, framed the addition as part of the platform’s broader effort to evolve with individual investors. “Our vision is to ensure Webull continues to evolve alongside the needs of individual investors and the many ways they engage with the markets,” Denier said. “The addition of CME Nano Futures reflects that vision by expanding the breadth of products available through the platform and strengthening our futures offering.”
Tanmay Sheth, FCM Product Head – Futures and Prediction Markets at Webull, also emphasized the retail focus of the launch. “As our retail futures customer base continues to grow, CME Nano Futures expand the Webull experience by giving customers a more accessible way to participate in major equity index markets,” Sheth said. “This launch reflects our commitment to enhancing the retail experience for futures and derivatives products through flexible, customer-focused trading tools.”
How Customers Can Use the Contracts
Through Webull, eligible customers can trade Nano Futures alongside the platform’s existing futures products. They can use the same tools and functionality to monitor markets, manage positions, and make informed trading decisions. This means the Nano Futures are not a separate, isolated product experience. Instead, they are integrated into the broader Webull futures environment, allowing customers to manage their exposure using familiar tools and workflows.
The contracts are available to customers with an approved Webull futures account. They remain subject to applicable account, margin, risk, and jurisdictional requirements. That means not every customer will automatically have access, and eligibility will depend on meeting Webull’s requirements as well as any relevant regulatory or regional restrictions.
Why the Launch Matters
The addition of Nano Futures builds on Webull’s expansion of its futures offering. It gives eligible retail customers another way to manage equity index exposure, but perhaps more importantly, it does so with smaller contract sizes. By enabling positions in smaller increments, the contracts can support more precise position sizing across a broader range of account sizes. That could make futures more useful for investors who want to hedge existing equity exposure, speculate on index moves, or simply diversify their trading strategies without taking on overly large positions.
For retail investors, the ability to size positions more precisely can be especially valuable. Larger futures contracts can be difficult to fit into a smaller portfolio because a single contract may represent more exposure than the investor wants. Nano Futures reduce that problem by offering a smaller building block. Investors can then scale into positions more gradually, adjust exposure as market conditions change, and tailor strategies to their individual risk preferences.
Availability
CME Nano Futures are expected to be available to eligible Webull customers in mid-September. Once live, they will add to Webull’s growing suite of futures products and provide another example of how the platform is trying to meet the evolving needs of individual investors. For Webull, the launch is both a product expansion and a signal that it intends to remain competitive in the retail derivatives space by offering flexible, customer-focused trading tools.  Long
Long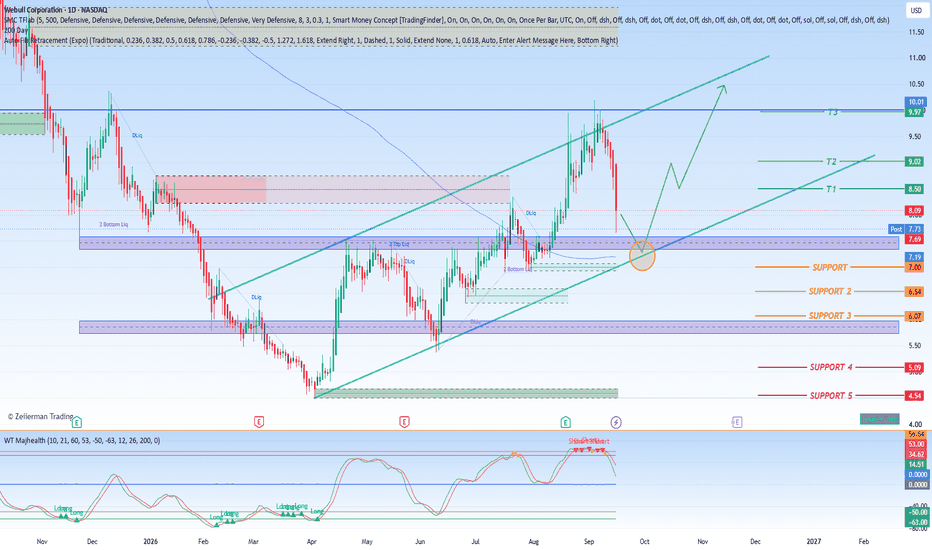
 Long
Long
Worth trading on the iPhone Duo?Short answer: probably no, and It has to do more with reporting periods than the new lineup.
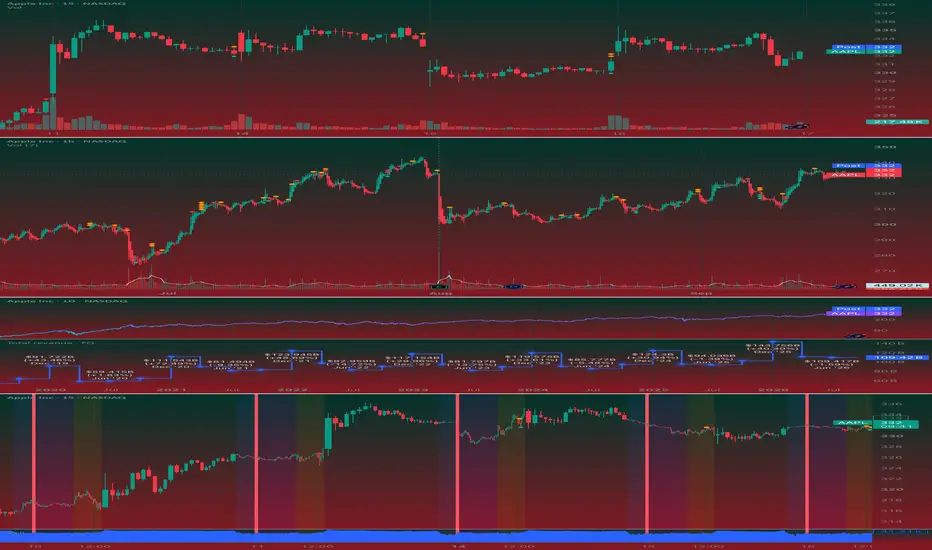
Apple's FQ4 2026 closes Sat 26 Sep. The 18 Pro hits shelves Fri 18 Sep, 9 selling days inside the quarter, about 10% of it.
Last year was also 9 days (17 series, 19 Sep, quarter closed 27 Sep).
The lineup's real revenue event is the December quarter, reported late January.
Apple guided FQ4 to +9–11% on a $102.5bn base → $111.7–113.8bn, midpoint ~$112.8bn. That growth comes from the installed base, carry-over models and Services not from the 18 Pro.
iPhone specifically was guided to mid-teens growth, against Q3's +22% ($54.3bn).
Three things that matter more than the phones:
Margin is the real story. Guidance is 47–48% vs Q3's 50.1%. Strip the tariff refunds from both and underlying compresses ~1–2pp.
Cook was blunt about why: "We reluctantly raised prices because we're in what I would characterise as a 100-year flood on the memory pricing."
Parekh said memory explained more than 100% of the 120bp sequential decline in Q3. So the $100 price rise is cost pass-through, not margin expansion,
Thus, revenue up, profitability down.
Cook: "It's not a regular supply issue. It's a demand forecast issue, to be candid"
Demand exceeds what they can build which truncates the revenue beat regardless of how good the lineup is.
The foldable is entirely out of this report.
The iPhone Duo was announced 9 Sep but ships in October, all of it lands in FQ1 2027. The iPhone X precedent mirrored exactly.
We should expect a solid but unspectacular FQ4 . I would estimate revenue roughly in line at ~$112bn, iPhone mid-teens, margin down.
The best next question is, how will the new line up substantially reprice in the new year.
Sources:
Apple iPhone 18 Pro debut Q3 memory, supply, margin
Preorder/release dates  Long
Long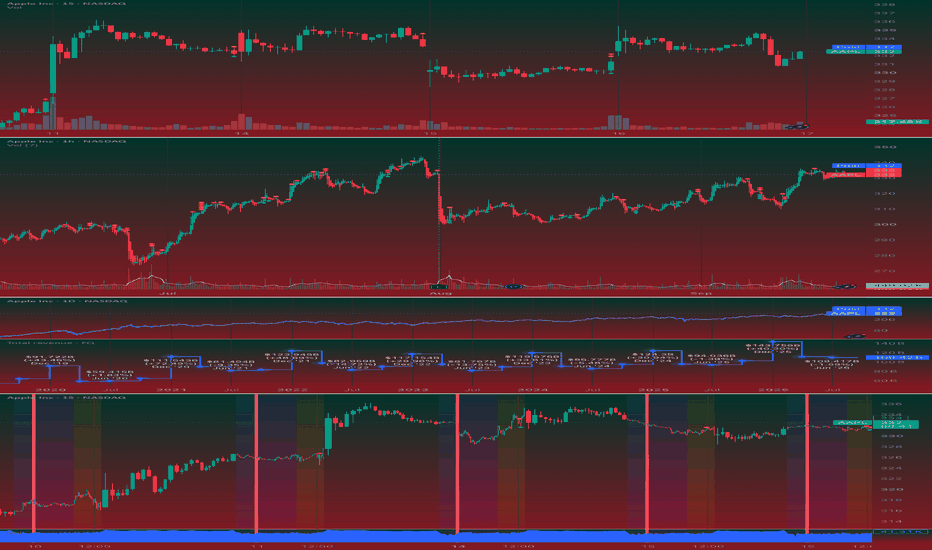
 Long
Long
 Long
Long

 Long
Long
CPNG | Bearish Until the Protected High BreaksBy analyzing the #CPNG (Coupang, Inc.) chart on the Daily timeframe, we can see a year-long bearish structure that has just broken down again, with three untouched pools of sell-side liquidity beneath and one level that decides whether any of it reverses.
━━━━━━━━━━━━━━━━━━━━
DAILY TIMEFRAME
━━━━━━━━━━━━━━━━━━━━
The turn came in November with the MSS — the August swing low broke and the bullish structure ended. Three separate BMS events have printed since: through $22.25 in December, near $17.00 in February, and through $15.00 in September. Each one came after a consolidation that looked like a base and was not one.
Price now sits at $14.40 , directly beneath the latest break and at the low of the visible range.
━━━━━━━━━━━━━━━━━━━━
THE LIQUIDITY BELOW
━━━━━━━━━━━━━━━━━━━━
SSL 1 — $12.61
SSL 2 — $10.46
SSL 3 — $8.97
Nothing has traded into them. A low that has never been defended isn't support, it's a target.
━━━━━━━━━━━━━━━━━━━━
THE LEVEL THAT DECIDES
━━━━━━━━━━━━━━━━━━━━
Protected High — $19.58
The high the sellers defended in July. Below it the bearish structure is intact. Above it on a daily close, it breaks for the first time since November.
━━━━━━━━━━━━━━━━━━━━
SCENARIO A — THE BASE CASE
━━━━━━━━━━━━━━━━━━━━
Price works through the sell-side pools in sequence — $12.61 , then $10.46 , then $8.97 . This stays the higher-probability path for as long as price trades under $19.58 .
━━━━━━━━━━━━━━━━━━━━
SCENARIO B — THE STRUCTURE BREAKS
━━━━━━━━━━━━━━━━━━━━
A daily close above the Protected High at $19.58 is the first bullish break in ten months, and above it the buy-side liquidity is stacked with nothing in between:
BSL 1 — $22.25
BSL 2 — $25.34
BSL 3 — $28.47
BSL 4 — $32.35
Four highs, none revisited since they formed. That is the size of the move a confirmed break opens — which is why it requires the close, not the approach.
━━━━━━━━━━━━━━━━━━━━
INVALIDATION
━━━━━━━━━━━━━━━━━━━━
A daily close above $19.58 . The bearish case ends there, not before.
And the rule that governs all of it: a break is a candle close, not a wick. The Protected High has been untouched for two months, which means it holds every stop from every short taken since July — and that is precisely the fuel a false break runs on.
━━━━━━━━━━━━━━━━━━━━
FUNDAMENTAL BACKDROP
━━━━━━━━━━━━━━━━━━━━
Q2 2026 swung from a $32 million profit to a $570 million loss , driven by $410 million in Korean regulatory fines . Adjusted EBITDA fell to $163 million from $428 million , and the Developing Offerings segment is guided to lose $950 million to $1 billion this year. The stock is at its 52-week low with market cap down 56.2% .
The other side: the business is still growing. Constant-currency revenue rose 10% , active customers reached 24.7 million , and retained customers are spending roughly 16% more year over year.
The fines are one-time; the customer loss and the FX drag are not, and the market is pricing the recovery as a 2027 story. Which is why the structure hasn't turned. The fundamentals give a reason for $19.58 to eventually break — not a reason to buy before it does.
This analysis will be updated as the market evolves.
Best Regards, BigBeluga 🐳 9/16/26 - $sbet - status check 1 2 1 2 9/16/26 :: VROCKSTAR :: NASDAQ:SBET
status check 1 2 1 2
- Kubuki day in the land of Oz
- the reality is that the bottom of the K is reKt the top is Klowin'
- where does that put markets? probably chop or modest risk off as rates slightly higher, but step back
- the USD remains v strong, US markets v strong, oil is the blood of their gawd etc. etc. and ultimately AI DGAF about rates when the banker DCF says mid teens return is easy money and it provides >100% of growth in a dead economy
- but honestly not great for consumer disc. still rekt. NKE is going to continue the drowning man syndrome and it means being v selective on shoe or consumer generally
- high rates r not good for bottom of K. great for top of K. oil higher helps... nobody. beware.
- lots more to say on this topic, but b/c you know i'm an ETH bull and like SBET i figured i'd rant here on that first, we can get into SBET and my portfolio update, long overdue.
SBET
- 85% below spot. *smacks lips*
- so is $2k eth a bargain in rising rate environment if/does BTC re-test low $60k's and most people don't understand they are dramatically different assets? .... well in the ST... beware, but LT $2k is great
- so while i'd been trimming highs... i started adding back today
- I went from >60% position to about 25% into this week
- and now... i'm back at high 30s.
- comment below if you wanna chat ETH.
- SBET now my largest position.
Others
- 35% SBET
- 20% NU
- 15% VST (w/ ATM covered calls)
- 12.5% NXT (w/ 5% OTM covered calls)
- 7% UBER (w/ 2-3% ITM covered calls)
- 5% DECK (w/ 5% OTM covered calls)
- 2.5% GRAB
- 2.5% WIFI (w/ ATM covered calls)
- 2% XPEL (which i've not written up ;) ... more to come)
- closed a lot of my ST NASDAQ:CRWD short today into announcement, remain w/ some $250P, $240P through next few weeks about 5% gross.
- a few of the positions are leveraged (two in fact, SBET is 1.5x, NU is about 1.8x), so that leaves me w/ about 15% cash buffer.
I swapped some NU (which coming into the day was my largest position) into SBET calls. Reality is, it's just a kelly exercise. I think both have 30-40% drawdown potential in the 3-6mo timeframe, but I don't see NU doing a 3-5x in the coming 1.5-2Y (where as my realistic target for ETH this cycle is $8k with $5k at the low-end). So just framing the opportunity according to up/downside to keep it simple.
we'll talk more on tax loss harvesting season (which this year will be particularly gnarly). building watchlist on that now. i prefer to have fewer positions, hedged positions (for income i.e. the covered call strategy on names I know well which > cash) and a little cash buffer.
happy to respond to comments. remember keep that head screwed on, emotions play no part in our process. neither do made up price targets that come to you in dreams. play the long game. we got this :)
V
 Long
Long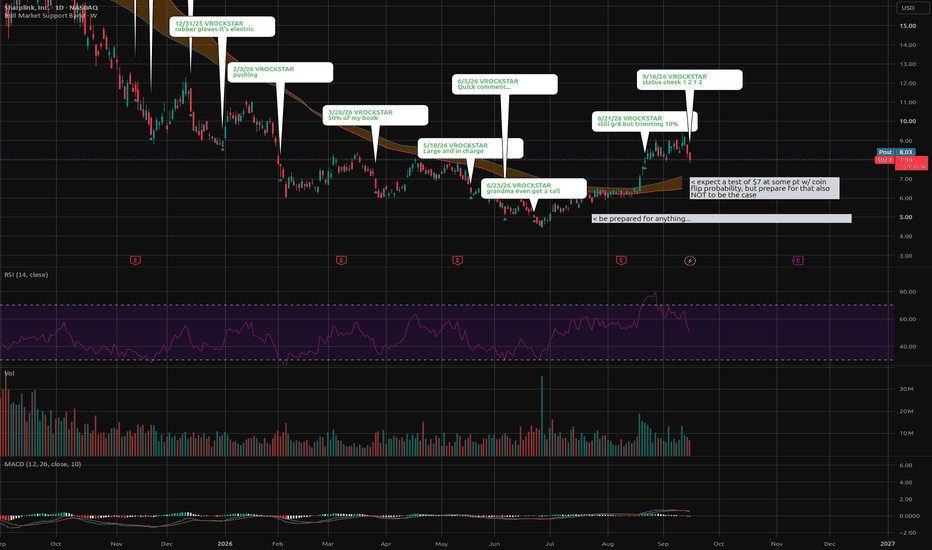
 Short
Short
Long 
 Long
Long
 Long
Long
MercadoLibre (MELI 1H): Bullish Divergences & Channel FloorTitle: MercadoLibre (MELI 1H): Bullish Divergences & Channel Floor — Preparing for 18% Breakout 🟡⚡
🧠 Fundamental Overview (September 2026 Context):
MercadoLibre (NASDAQ: MELI) has recently seen a 12–13% pullback, trading down near the $1,830–$1,845 USD level as the market continues to price in near-term margin trade-offs:
Ecosystem & Merchant Scale: In mid-September, the company held its massive Mercado Libre Experience 2026 at La Rural, gathering over 8,000 sellers and enterprises. Over 2.7 million SMEs now operate within the MELI ecosystem, with nearly half generating their primary source of income through the platform.
Growth vs. Margins Dynamics: Following record Q2 revenue surpassing $10.17 Billion (+50% YoY), operating income faced temporary compression (6.7% EBIT margin) due to deliberate, aggressive investments in free shipping across Brazil and a 75% expansion of its credit portfolio (exceeding $16 Billion).
Valuation Pullback: The recent retreat from the $2,050 zone brings MELI’s trailing P/E down below 50x (well below its historical 5-year median of ~75x), offering a historically attractive discount for long-term compounders ahead of its expected Q3 earnings on November 4, 2026 .
📊 Technical Breakdown (1H Timeframe):
Zooming into the hourly chart, the market structure presents a high-probability mean-reversion setup inside a broader ascending channel:
1️⃣ Macro Ascending Channel (Trendline A & D):
Price has been developing inside a dominant multi-month ascending channel formed by upper Trendline A and lower floor Trendline D . After testing the upper boundary in the $2,050–$2,060 region, the asset underwent a clean 12–13% corrective slide down to the $1,804 USD low.
2️⃣ Trendline B Support Reaction:
The recent bounce emerged cleanly off Trendline B —a historical inflection level that has repeatedly alternated as both support and resistance. Had this level failed, the ultimate floor sat immediately below at Trendline D .
3️⃣ The Immediate Ceiling: Trendline C & Moving Averages:
Price action is now confronting descending Trendline C , a short-term diagonal resistance formed since early September. Directly above it sits a dual resistance cluster:
50-hour EMA ($1,886.07 USD)
200-hour EMA ($1,897.19 USD)
These moving averages recently printed a bearish cross, meaning reclaiming this entire $1,886–$1,900 pocket is the primary objective for bulls.
4️⃣ Confluent Bullish Divergences (MACD & RSI):
The rebound off Trendline B is heavily backed by leading indicators:
RSI (14): Rebounding out of deeply oversold territory (sub-30) and printing clear higher lows (bullish divergence).
MACD (12, 26, 9): Exhibiting an identical pattern—while price carved out lower lows toward $1,804, the MACD histogram and signal lines printed pronounced higher lows, signaling aggressive exhaustion among sellers.
🎯 Conclusion & Trading Playbook:
A confirmed breakout above the immediate diagonal and moving-average ceiling paves the way for a powerful continuation toward the upper boundary of the channel, offering a potential +17% to +18% upside expansion.
The Setup: Wait for a decisive 1H close above descending Trendline C and a reclaim of both the 50 and 200 EMAs ($1,890–$1,900 USD) .
Stop Loss (SL): Placed strictly below the recent swing low at $1,802 USD .
Target (TP): $2,150 – $2,200 USD (Retest and expansion into the upper boundary of Trendline A).
Risk-to-Reward (R:R): With roughly $90 of defined risk against a potential $260–$300 gain, this setup commands an exceptional 5:1 to 6:1 R:R.
Are you waiting for the 200 EMA reclaim, or already bidding the Trendline B bounce? Share your thoughts below! 👇
⚠️ Disclaimer: This analysis is strictly for educational purposes and intended solely to intellectually enrich our trading community. It does NOT constitute financial or investment advice. Always perform your own research and manage your risk strictly.  Long
Long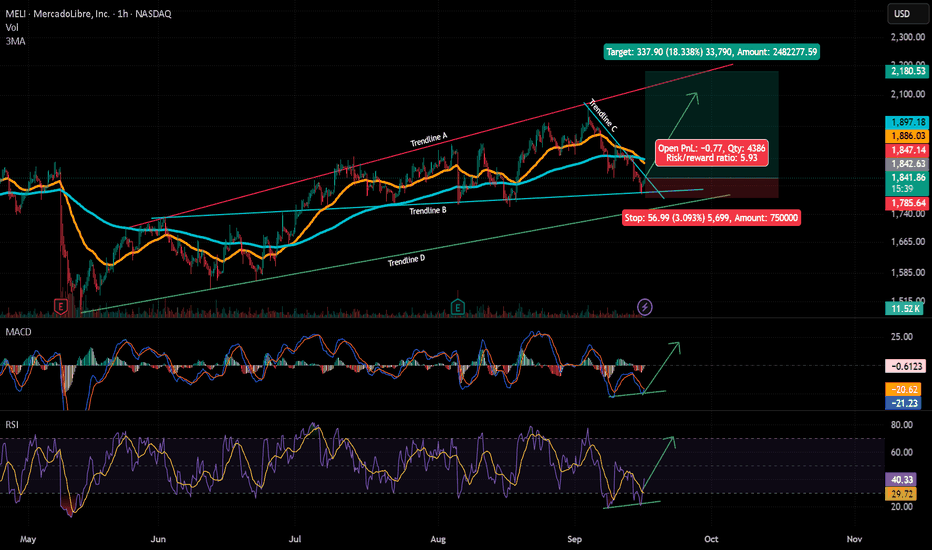
 Long
Long
 Long
Long
 Short
Short
Saudi National Bank — Bullish Buying Setup | Buyers EnteringSaudi National Bank is showing a developing buy-side setup after a period of downward price movement. The stock had been losing ground, but the latest price behaviour indicates that buying interest is beginning to emerge at the current structure.
The important development here is the change in participation. Selling pressure pushed the price toward lower levels, but buyers are now stepping into the market and attempting to absorb that weakness. This creates the possibility of a shift from the previous decline toward a broader recovery phase.
From a technical perspective, the setup is based on price structure, momentum behaviour, and the reaction of buyers around the current area. Rather than treating the previous decline as the complete story, the focus is on identifying whether the newly emerging demand can establish a stronger bullish sequence.
SNB is listed on the Saudi Exchange under ticker 1180 and belongs to the Banks sector.
The current setup therefore focuses on a potential transition: the market moved lower, selling activity dominated the earlier phase, and buyers are now beginning to challenge that downside pressure.
If this shift develops further, price could begin forming higher levels and open the path toward a stronger recovery. The key factor remains the ability of buyers to maintain control and convert the current reaction into sustained upside momentum.
📊 Technical Roadmap
Previous phase: Downward movement 📉
Current development: Buyers entering 🟢
Structure: Potential bullish transition
Bias: Buy-side
Objective: Higher levels / recovery
The idea is not based on simply buying because price has fallen. The focus is on the structural change taking place now — sellers pushed the market lower, but buyers are beginning to respond.
🔍 Setup Overview
- Instrument: Saudi National Bank
- Ticker: 1180
- Market: Saudi Exchange / Tadawul
- Sector: Banks
- Direction: Bullish / Buy
- Current condition: Buyers entering after a decline
- Technical focus: Structure, momentum and price behaviour
- Scenario: Potential recovery toward higher levels
The chart is now at an interesting transition point. The previous decline created weakness, but the appearance of fresh buying interest changes the character of the setup.
Sellers created the decline. Buyers are now attempting to create the recovery.
The next phase of price action will determine whether this emerging buying interest develops into a sustained bullish move, but the current structure provides a clear buy-side scenario to monitor.  Long
Long
Saudi Aramco — Bullish Buying SetupSaudi Aramco is currently presenting a constructive buy-side setup, with the price structure showing conditions that can support a potential upward continuation.
The analysis is focused on the behaviour of price, market structure and the signals generated through the trading methodology. Rather than reacting to individual candles, the broader objective is to identify whether buyers are gaining enough influence to drive the next meaningful expansion.
From a technical perspective, the current setup is positioned toward the upside. If buying pressure continues to strengthen and the existing structure remains supportive, Saudi Aramco could progress toward higher levels.
📊 Setup Overview
- Instrument: Saudi Aramco
- Market: Saudi Arabia 🇸🇦
- Tadawul Symbol: 2222
- Bias: Bullish 📈
- Direction: Buy
- Focus: Upside continuation
- Structure: Constructive
- Momentum: Buyers gaining influence
Saudi Aramco trades on the Saudi Exchange under symbol 2222 and is classified within the Energy sector.
The current buy-side thesis is primarily technical, while the company's underlying scale provides an important fundamental backdrop. Aramco describes itself as one of the world's largest integrated energy and chemicals companies. Its latest investor materials report H1 2026 adjusted net income of SAR 251.9 billion and total hydrocarbon production of 11 million barrels of oil equivalent per day.
🔥 Bullish Structure
The key element of this setup is the developing relationship between price structure and buying pressure.
If buyers continue to defend the current formation and maintain upward momentum, the market could transition into a stronger bullish phase. Short-term fluctuations may occur along the way, but the broader scenario remains focused on higher prices while the underlying conditions continue to support the buy-side view.
The methodology is designed to assess the complete market environment rather than depend on one isolated technical level. This allows the setup to remain focused on the broader directional opportunity while price continues to develop.
🌍 Fundamental Backdrop
Aramco's latest company disclosures also highlight its integrated upstream and downstream operations, alongside continued investment across energy, chemicals and adjacent growth businesses. Its 2025 annual report reported $104.7 billion in adjusted net income and $85.4 billion in free cash flow for the year.
These fundamentals do not determine the short-term price path by themselves, but they provide useful context around the company behind the technical setup.
🚀 Market Roadmap
The current scenario can be summarised as:
Constructive structure → Buyers strengthen → Momentum expands → Upside continuation → Higher levels in focus.
The key is to allow the market to confirm the strength of the move rather than forcing an outcome. As long as the bullish structure remains intact, the buy-side scenario remains the primary focus.
Saudi Aramco. Buyers in focus. Bullish structure developing. Upside ahead. 🎯📈🔥  Long
Long
Softtech Engineers🎯 STOCK TO WATCH
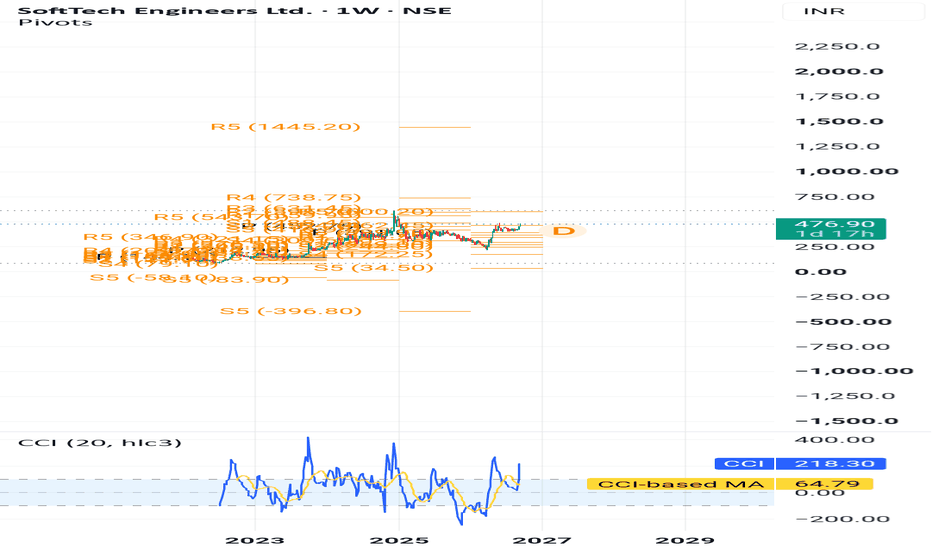
WEEKLY R4 MOMENTUM BREAKOUT SETUP
SOFTTECH ENGINEERS LTD
₹465–470 → ₹738 → ₹1,445
📌 TRADE LEVELS
🟢 Buy Zone: ₹465–470
🚀 Breakout Zone: ₹462
🛑 Stop Loss: ₹341
🎯 Target 1: ₹738
🎯 Target 2: ₹1,445
🔎 WHY SOFTTECH ENGINEERS?
Digital engineering + GovTech: SoftTech develops software solutions for urban governance, construction and infrastructure workflows.
Q1 FY27 growth: Standalone revenue from operations was ₹32.22 Cr, +25% YoY, with EBITDA of ₹9.60 Cr, +25% and PAT of ₹1.92 Cr, +17.8%.
SaaS momentum: SaaS revenue reached about ₹10.03 Cr, growing 55.6% YoY in Q1 FY27 on a standalone basis.
Large pipeline: Q1 FY27 presentation reported ₹489.82 Cr of orders in pipeline, alongside confirmed orders of about ₹220.41 Cr.
New digital platforms: Recent initiatives include CivitTWIN, an AI-powered digital approval platform, and an e-TDR platform for Maharashtra/BMC.
Recurring-revenue focus: Management is expanding its SaaS/annuity-based business alongside its established government-sector presence.
⚡ WHY IT CAUGHT MY ATTENTION
✅ ₹462 is the key breakout reference in my setup
✅ Strong Q1 standalone revenue growth
✅ SaaS revenue growing faster than the overall business
✅ Large order pipeline provides potential revenue visibility
✅ Exposure to digitalisation of infrastructure and urban governance
✅ Technical structure showing strong momentum
⚠️ IMPORTANT
This is a high-risk momentum setup. The Q1 numbers show strong standalone growth, but consolidated PAT growth was much more modest at about 5% YoY.
The large pipeline should also be distinguished from confirmed orders—pipeline conversion and execution remain key variables.
Risk Defined. Reward Visible.
Disclaimer: This content is for educational purposes only and not investment advice. Please do your own due diligence before making any investment decisions.
© 20K Microcap Investing | R4 Momentum Desk
#SofttechEngineers #SOFTTECH #InfrastructureStocks #EngineeringStocks #SaaS #GovTech #MomentumStocks #BreakoutStocks #IndianStocks #R4Momentum #StockToWatch  Long
Long