 Long
Long
 Short
Short
 Short
Short
 Long
Long
 Long
Long
 Short
Short
 Long
Long
Maharashtra Seamless 🎯 STOCK TO WATCH
WEEKLY R4 MOMENTUM BREAKOUT SETUP
₹700–720 → ₹1,357 → ₹3,368
A seamless-pipe leader + oil & gas capex recovery + strong order-book + momentum setup appearing on my Weekly R4 Momentum Breakout Scanner.
🏭 MAHARASHTRA SEAMLESS LTD
NSE: MAHSEAMLES
📌 TRADE LEVELS
🟢 Buy Zone: ₹700–720
🟠 Breakout Zone: ₹689
🔴 Stop Loss: ₹560
🎯 Target 1: ₹1,357
🚀 Target 2: ₹3,368
🔥 WHY MAHARASHTRA SEAMLESS?
• Strong core business: Maharashtra Seamless is one of India's leading seamless-pipe manufacturers, with major exposure to oil & gas applications.
• Q1 FY27 PAT growth: Consolidated PAT came at ₹266.4 Cr, up 15.7% YoY.
• Core margins improved: Steel Pipes & Tubes segment profit increased 7.5% YoY, despite segment revenue declining, helped by lower material costs.
• Order book recovery: Order book reached approximately ₹1,709 Cr, up 31%, with a high-margin mix including oil & gas and exports.
• Capacity + value addition: The company continues to focus on value-added products, import substitution, exports and higher capacity utilisation.
• Strong financial flexibility: FY26 ended with ₹718.16 Cr consolidated PAT, while the company maintains substantial liquidity to navigate the steel-pipe cycle.
👀 WHY IT CAUGHT MY ATTENTION
📈 ₹689 is the key breakout reference on my R4 scanner.
📈 Order-book recovery is an important demand signal.
📈 Oil & gas remains a structural demand driver.
📈 Higher-margin oil & gas, export and specialty orders can improve the product mix.
📈 India's energy and pipeline infrastructure spending provides a longer-term runway.
📈 Strong balance-sheet flexibility gives the company room to invest through the cycle.
⚠️ IMPORTANT
There is an important earnings-quality caution here.
Q1 FY27 revenue from operations actually fell 4.7% YoY to ₹1,091 Cr, while reported PAT growth was partly supported by ₹174 Cr of other income.
The company also faced lower oil & gas tendering, Chinese import pressure and a gas-supply disruption that affected Q1 dispatches. Management expects dispatches to normalise, but Q2–Q3 execution will be crucial to validate the order-book recovery.
So this is not simply a PAT-growth story — the real trigger is whether order-book conversion + volumes + core pipe margins accelerate.
Risk Defined. Reward Visible.
⚠️ This content is for educational purposes only and not investment advice. Please do your own due diligence before making any investment decisions.
© 20K Microcap Investing | R4 Momentum Desk
#MaharashtraSeamless #MAHSEAMLES #SteelStocks #OilAndGas #SeamlessPipes #InfrastructureStocks #MomentumStocks #BreakoutStocks #IndianStocks #R4Momentum #StockToWatch  Long
Long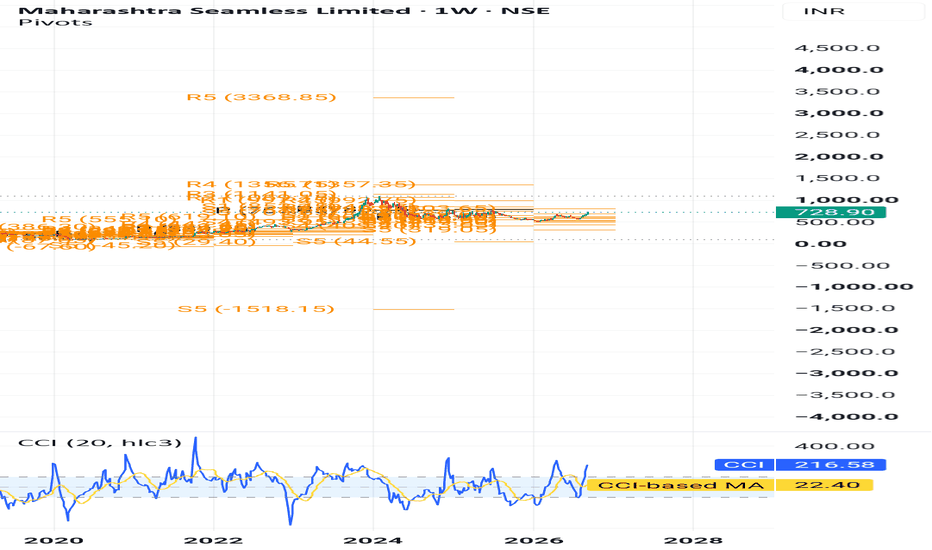
Siemens — Retracement First, Then Upside Toward 276Siemens is presenting a bullish opportunity with a two-stage price path. The immediate expectation is for the stock to experience a temporary decline toward the 242 area, followed by a renewed upward move toward the 276 target.
The projected dip should be viewed as an intermediate phase within the broader bullish scenario. Price may initially lose ground as the current movement develops, but the larger structure continues to leave room for a subsequent recovery and stronger appreciation.
The 242 region is therefore an important reference point in the setup. A reaction from this area could provide the transition required for the next upward phase, shifting attention toward the 276 objective.
Rather than expecting a straight climb from the current level, this analysis accounts for the possibility of a deeper retracement before the broader advance resumes. That makes the sequence particularly clear:
Current price action → decline toward 242 → bullish recovery → expansion toward 276.
The wider outlook for Siemens can also be influenced by industrial demand, infrastructure investment, manufacturing activity, global economic conditions, currency movements, and developments across European equities. These elements may affect timing and volatility, while the technical roadmap remains centered on the projected 242-to-276 progression.
The key distinction is between the short-term move and the broader directional idea. The anticipated weakness toward 242 does not automatically invalidate the bullish thesis; instead, it forms part of the planned route toward the higher objective.
📍 Initial Downside Area: 242
🔄 Expected Intermediate Move: Pullback
📈 Overall Bias: Bullish
🎯 Upside Objective: 276
🚀 Projected Route: 242 → 276
The market may take a step back before moving forward, but the larger setup remains focused on a potential bullish expansion toward 276 after the projected 242 retracement.  Long
Long
Solara Active Pharma 🎯 STOCK TO WATCH
WEEKLY R4 MOMENTUM BREAKOUT SETUP
₹730–740 → ₹1,593 → ₹1,857 → ₹4,041
A specialty API recovery + base-business acceleration + deleveraging + momentum setup appearing on my Weekly R4 Momentum Breakout Scanner.
💊 SOLARA ACTIVE PHARMA SCIENCES LTD
📌 TRADE LEVELS
🟢 Buy Zone: ₹730–740
🟠 Breakout Zone: ₹725
🔴 Stop Loss: ₹484
🎯 Target 1: ₹1,593
🚀 Target 2: ₹1,857
🔥 Target 3: ₹4,041
🔥 WHY SOLARA?
• Strong Q1 FY27 recovery: Consolidated revenue reached ₹384 Cr, up 20% YoY, while PAT rose 55% YoY to ₹16.3 Cr.
• Best profitability in 18 quarters: Management highlighted that Q1 FY27 delivered its highest EBITDA and PAT in 18 quarters.
• Base business accelerating: Base-business revenue grew 24% YoY to ₹307 Cr, making it the key earnings engine.
• Margin improvement: Q1 EBITDA was ₹63.5 Cr, with EBITDA margin around 17%, despite raw-material and supply-chain pressures.
• Deleveraging underway: Net debt declined to about ₹479 Cr, down roughly ₹135 Cr during the quarter, with management targeting sub-₹450 Cr by March 2027.
• Strategic optionality: Management is reviewing the Ibuprofen business, while also evaluating future CRAMS and other growth opportunities.
👀 WHY IT CAUGHT MY ATTENTION
📈 ₹725 is the key technical trigger on my R4 scanner.
📈 Base business growth is running significantly ahead of consolidated growth.
📈 EBITDA and PAT have reached multi-quarter highs.
📈 Debt reduction is improving the balance-sheet picture.
📈 Capacity utilisation across the base business is around 70%, leaving room for further growth.
📈 The potential resolution of the loss-making Ibuprofen business could materially improve consolidated earnings quality.
⚠️ IMPORTANT
This is a high-risk momentum setup, particularly because the business is still undergoing a strategic transition.
The Ibuprofen business remains loss-making, with management indicating quarterly EBITDA losses of roughly ₹10–15 Cr until the strategic review is resolved. The West Asia crisis has also created raw-material and supply-chain pressures.
So the key monitor is whether base-business growth + margin resilience + deleveraging can continue while the Ibuprofen overhang is addressed.
Risk Defined. Reward Visible.
⚠️ This content is for educational purposes only and not investment advice. Please do your own due diligence before making any investment decisions.
© 20K Microcap Investing | R4 Momentum Desk
#SolaraActivePharma #SOLARA #PharmaStocks #APIStocks #CDMO #MomentumStocks #BreakoutStocks #IndianStocks #R4Momentum #StockToWatch  Long
Long
Bank of Montreal — Downside Structure Targeting 216Bank of Montreal is currently exhibiting a weakening price formation, with recent trading behavior leaning decisively toward the downside. The balance between buyers and sellers appears to be shifting in favor of the latter, creating room for another decline toward the 216 region.
The present chart suggests that upside recoveries are struggling to regain meaningful traction. Instead of establishing a convincing reversal, price remains exposed to additional depreciation as bearish momentum continues to influence the broader structure.
The 216 level represents the principal downside objective for this setup. A continuation of the current pattern could gradually take the stock through lower price zones, with intermittent rebounds possible during the journey. Such counter-moves would not necessarily alter the broader view unless they develop into a sustained structural recovery.
This analysis is centered on the behavior of price rather than short-term noise. The market is currently showing signs of reduced bullish conviction, while selling activity is becoming increasingly influential. That imbalance keeps the bearish thesis active and places greater emphasis on the lower levels ahead.
Bank of Montreal may also respond to changes in Canadian interest-rate expectations, economic growth, credit conditions, banking-sector sentiment, housing activity, currency movements, and broader financial-market risk appetite. These variables can affect volatility, but the current technical configuration continues to point toward a weaker trajectory.
Projected sequence:
Loss of upside strength → increasing downside pressure → continuation of the decline → 216 target area.
📍 Market Bias: Bearish
📉 Trade View: Sell
⚠️ Current Condition: Weakening structure
🎯 Projected Objective: 216
🔻 Expected Direction: Lower
The chart remains vulnerable beneath its current structure, with 216 standing as the key downside destination while sellers retain influence over the price action.  Short
Short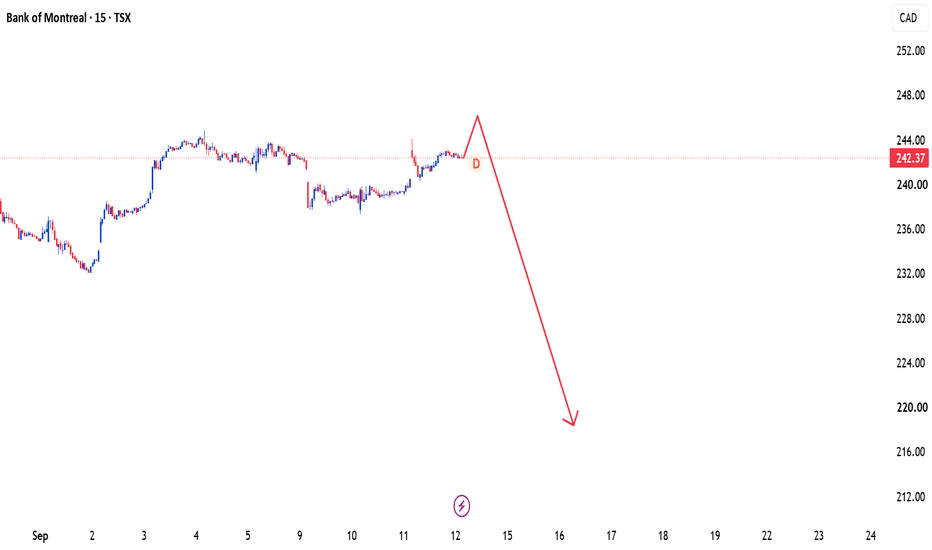
AMD Industries🎯 STOCK TO WATCH
WEEKLY R4 MOMENTUM BREAKOUT SETUP
₹64 → ₹102 → ₹168 → ₹180
A packaging turnaround + sharp earnings acceleration + momentum setup appearing on my Weekly R4 Momentum Breakout Scanner.
📦 AMD INDUSTRIES LTD
📌 TRADE LEVELS
🟢 Buy Zone: ₹64
🟠 Breakout Zone: ₹64
🔴 Stop Loss: ₹42
🎯 Target 1: ₹102
🚀 Target 2: ₹168
🔥 Target 3: ₹180
🔥 WHY AMD INDUSTRIES?
• Strong Q1 FY27: Consolidated revenue was about ₹122 Cr, up 40.3% YoY.
• Explosive profit growth: Q1 PAT reached ₹9.12 Cr, up more than 500% YoY from ₹1.51 Cr.
• Margin expansion: Operating margin improved to 15.07%, versus 9.40% in Q1 FY26.
• Packaging specialist: AMD manufactures packaging solutions for beverages, food & FMCG, pharmaceuticals, paints, dairy and other industries.
• Strong customer ecosystem: The company counts major names including Coca-Cola, PepsiCo, AB InBev, Carlsberg, Heineken, Dabur and HUL among its customers.
• Large manufacturing footprint: AMD says it has 3+ manufacturing plants and capacity exceeding 8 billion pieces.
👀 WHY IT CAUGHT MY ATTENTION
📈 ₹64 is the key technical trigger on my R4 scanner.
📈 Q1 revenue grew more than 40% YoY.
📈 Operating profit grew sharply alongside revenue.
📈 PAT acceleration is particularly notable after a weak FY26 base.
📈 Packaging demand gives exposure to multiple consumer and industrial segments.
📈 The combination of earnings acceleration + margin expansion + technical momentum makes this one worth watching.
⚠️ IMPORTANT
The 500%+ PAT growth needs context — the comparable Q1 FY26 profit was only ₹1.51 Cr, so the percentage increase is magnified by the low base.
Also, AMD Industries is a small-cap packaging business, so execution, demand, input costs and working-capital requirements should be monitored. The key question now is whether the Q1 improvement can be sustained over the next few quarters.
Risk Defined. Reward Visible.
⚠️ This content is for educational purposes only and not investment advice. Please do your own due diligence before making any investment decisions.
© 20K Microcap Investing | R4 Momentum Desk
#AMDIndustries #AMDIND #PackagingStocks #SmallCapStocks #MomentumStocks #BreakoutStocks #IndianStocks #R4Momentum #StockToWatch  Long
Long
Shopify — 160 Pullback Before the Bigger Move Toward 250📈 Shopify — Strategic Pullback Before the Next Major Upside Leg
Shopify is presenting an interesting bullish setup, but the projected path is not a straight-line advance. The current analysis suggests that price may first retrace toward the 160 region, creating a deeper corrective phase before the larger upward movement develops.
The 160 area is therefore an important part of the roadmap. Rather than interpreting the projected decline as a complete change in direction, this scenario views it as an intermediate retracement within a broader bullish thesis. Once this phase is completed and the market regains upward traction, Shopify could begin a much stronger expansion toward the 250 target zone.
The key feature of this setup is the sequence of the move:
Current price action → retracement toward 160 → bullish transition → major expansion toward 250.
From a technical perspective, the anticipated pullback could provide the market with an opportunity to reset before another substantial advance. The reaction around 160 will therefore be an important area to monitor, as the subsequent price behavior can determine how quickly the larger bullish leg develops.
The broader outlook for Shopify can also be influenced by e-commerce growth, consumer spending, merchant activity, technology-sector sentiment, interest-rate expectations, and developments across global equity markets. These variables can affect volatility and timing, while the projected technical roadmap remains centered on the 160-to-250 sequence.
The larger objective is 250, but the route toward that destination may begin with a temporary move lower. This distinction is important: the projected dip does not necessarily invalidate the bullish thesis; instead, it forms part of the expected market structure.
📍 Initial Pullback Area: 160
📈 Overall Bias: Bullish
🔄 Expected Intermediate Move: Downward retracement
🚀 Major Upside Objective: 250
🎯 Projected Roadmap: 160 → 250
The setup is built around patience with the broader direction — first the anticipated retracement toward 160, then the potential bullish expansion toward 250.  Long
Long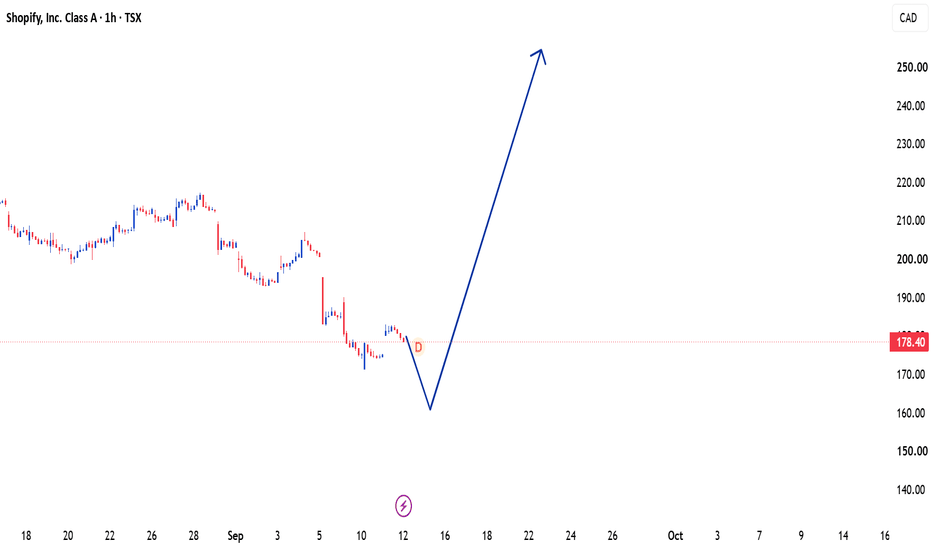
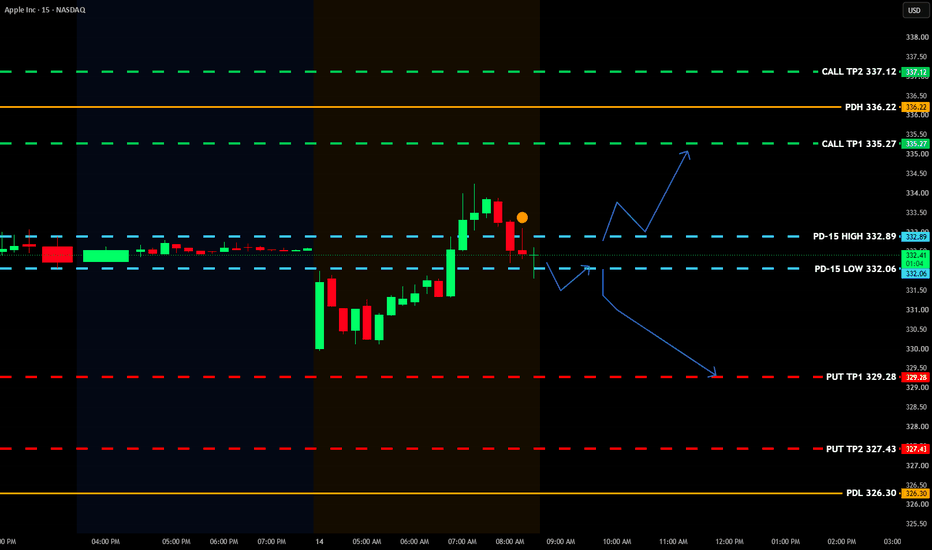
AAPL: AI Slowdown, Oil Shock. Calls or Puts?AAPL closed Friday at $332.27 and is sitting inside my PD-15 box (Previous Day 15, the high and low of the prior day's final 15-minute candle) this morning. Two unrelated shocks are hitting the market at once: AI industry leaders themselves are calling for a slowdown, hammering NVDA and the chip trade, and Saudi Arabia shut a major oil pipeline after drone strikes tied to the Iran war, with Brent near $108. QQQ is down nearly 2%. I want real confirmation before trusting either direction today.
Key levels:
- PD-15 High (entry/retest): $332.89
- PD-15 Low (entry/retest): $332.06
- Prior Close (TP anchor): $332.27
- PDH: $336.22 | PDL: $326.30
- Call TPs: $335.27 / $337.12 / $340.11
- Put TPs: $329.28 / $327.43 / $324.43
- Daily ATR: $7.84
Bullish: break and close above $332.89 with volume (R.Vol at least 1.0x), retest the level or the 8 EMA, confirm with a bullish 2-min close. Check that the broader tape is stabilizing, not extending the selloff.
Bearish: close below $332.06 with volume, retest, confirm with a bearish 2-min close. Lines up with the market's broader risk-off tone today.
Two unrelated risk-off drivers stacking means no front-running this one.
Educational only, not financial advice. Options trading carries substantial risk. Do your own research and manage your own risk.
Study the levels. Wait for agreement. Trade with discipline.  Long
Long
Royal Bank of Canada — Downside Scenario Targeting 278Royal Bank of Canada is currently presenting a deteriorating market picture, with recent price behavior suggesting that downside pressure could continue to influence the stock. The balance appears to be shifting away from the buying side, creating conditions for a further decline toward the 278 area.
The current technical landscape reflects a loss of upward strength, while lower levels are becoming increasingly exposed. Attempts to recover may face difficulty in establishing a sustained change of direction, leaving the market susceptible to another phase of depreciation.
The 278 level represents the central downside objective for this setup. If the prevailing negative structure continues to develop, price could gradually extend its decline and work toward this projected destination.
This trade idea is based on the evolving market formation rather than reacting to individual price fluctuations. Short-term volatility may create temporary upward movements, but the broader picture continues to favor the selling scenario as long as the existing bearish conditions remain present.
Royal Bank of Canada's movement may also be affected by interest-rate expectations, Canadian economic developments, banking-sector performance, credit-market conditions, corporate news, and wider global sentiment. These influences can change the pace of price movement, while the current analytical outlook remains focused on lower levels.
Projected market path:
Current weakness → further loss of momentum → sustained downward movement → 278 target zone.
📍 Market View: Bearish
📉 Trade Direction: Sell
⚠️ Current Tone: Downside pressure
🎯 Projected Target: 278
🔻 Expected Outcome: Continued decline
The structure is keeping the selling side in control, and 278 remains the major level on the chart as the next potential destination.  Short
Short
AAPL | September 14, 2026 | One Edge, Two Time FramesToday's AAPL review focused on something I don't see very often: my edge showing up on two different time frames at the same time.
We started on the 4-hour chart, where I identified my setup. Seeing my edge develop on a higher time frame matters because the structure behind that signal carries more weight and gives me a stronger piece of context for the day.
Then things got interesting.
When I moved down to the 15-minute chart, I found my edge showing up again. Now I wasn't looking at two unrelated signals. I had the same idea appearing across two different time frames, creating another layer of confluence.
In today's video, I covered:
Identifying my edge on the 4-hour time frame
Why a higher-time-frame setup can carry more weight
Moving down to the 15-minute chart without losing the bigger picture
Finding the same edge again on the lower time frame
How multiple-time-frame alignment can create stronger confluence
Why even a strong setup still needs confirmation and proper risk management
The bigger lesson is that confluence isn't about adding more indicators. It's about finding independent pieces of evidence telling the same story.
Seeing my edge on the 4-hour chart gets my attention. Seeing that same edge appear again on the 15-minute chart makes the setup even more interesting.
But stronger confluence doesn't mean guaranteed outcome. It means I have more evidence supporting the idea. From there, the job is still the same: wait for price to confirm it, manage risk, and trade what AAPL actually gives me.
Dad Stock Joke: My edge showed up on the 4-hour and then again on the 15-minute. I told it, “You don't have to keep checking in, I already know you're here.

Adobe Delivered the Numbers. The Chart Still Wants ProofAdobe’s latest results gave the bulls plenty to work with.
Revenue reached a record $6.76 billion, up 13% year over year. Recurring revenue from Adobe’s AI-focused products grew more than 150%, the company passed one billion monthly active users, and management raised its full-year revenue and earnings targets.
Those are not the numbers of a business that has suddenly stopped working.
The chart, however, is still asking for proof.
ADBE has spent several years trending lower, but the recovery from the June low around $190 has produced the first potentially constructive sequence in some time. Price established several higher lows before reaching the $285–295 area, where the advance met resistance and headed straight back to its former trading zone.
That upper zone remains the important barrier. A decisive move above it would provide the clearest indication that Adobe is entering a genuine recovery.
First, however, the lower zone around $241–252 has to do its job.
Adobe is now testing the former trading zone alongside its rising support line. If buyers defend the zone and price forms another higher low, the short-term recovery structure remains intact, leaving the upper zone as the next major test.
A decisive loss of the lower zone would send a different message. Even record results, faster growth from AI-focused products and raised guidance were not enough to produce sustained demand. That would not mean Adobe’s business is broken. It would mean the market still sees risks that one strong quarter has not resolved.
For now, the fundamentals have made their argument. The lower zone may determine whether the chart is finally ready to answer. Market Cap vs Share Price: Difference Every Trader Should KnowOr why a $500,000 stock can be cheaper than a $50 stock.
Berkshire Hathaway Class A shares NYSE:BRK.A famously trade for hundreds of thousands of dollars apiece, while thousands of companies on Wall Street can be bought for less than the price of dinner.
So Berkshire must be incredibly expensive and SpaceX NASDAQ:SPCX at around $150 must be cheap , right?
Here comes one of the first traps awaiting new investors: share price tells you almost nothing about how expensive a company truly is. A $20 stock can represent a richly valued corporate empire, while a $500 stock can represent a much smaller business trading at a modest valuation.
To understand the difference, we need three concepts that frequently get thrown into the same financial blender: share price, market capitalization and valuation.
🍕 First, Meet the Whole Pizza
A company's share price tells you what one share costs. Market capitalization, usually shortened to market cap, or mcap if you’re a true finance bro, estimates what the entire company's equity is worth on the stock market.
The calculation is pleasantly free of advanced mathematics:
Share price × shares outstanding = market cap.
Imagine Company A has 1 million shares trading at $1,000 each. Its market cap is $1 billion. Company B has 1 billion shares trading at $50 each. Its market cap is $50 billion.
Company B's shares cost twenty times less individually, yet the company itself is worth fifty times more.
Share price is the cost of one slice. Market cap is the price of the whole pizza.
🐘 Berkshire Makes the Point Beautifully
Berkshire Hathaway provides perhaps Wall Street's greatest demonstration.
Its Class A shares carry their famously enormous nominal price because Warren Buffett has resisted splitting them. Berkshire did split its more accessible Class B shares NYSE:BRK.B 50-for-1 in 2010, while Class A NYSE:BRK.A remained untouched.
That huge NYSE:BRK.A price therefore tells us surprisingly little about Berkshire's valuation. It mainly tells us that each Class A share represents a very large slice of the company.
This distinction is important because traders typically say something like, "That stock is already $800, surely it can't go much higher." The number 800 carries very little information by itself. You need to know how many shares exist and what the underlying business produces.
✂️ Stock Splits Reveal the Trick
Stock splits make this easier to see. Nvidia NASDAQ:NVDA conducted a 10-for-1 stock split in 2024 after its share price had climbed substantially.
An investor holding one $1,000 share would, conceptually, end up holding ten shares worth $100 each immediately after a 10-for-1 split. Nvidia explicitly stated that the split itself would leave the total value of an investor's holdings unchanged.
That is why a stock suddenly becoming "cheaper" after a split is largely an optical effect. The individual shares become more affordable, while the business itself remains the same size. There’s also a reverse stock split, btw .
🏷️ Cheap Share Price ≠ Cheap Company
This brings us to a distinction traders should tattoo somewhere near their watchlists: price and valuation are different things.
Suppose our fictional $20 stock earns only 10 cents per share annually. Investors are paying 200 times those earnings.
Another company trades at $500 and earns $50 per share. Investors are paying 10 times earnings. Which looks cheaper now?
That's where valuation metrics such as the price-to-earnings ratio, or P/E, become useful. P/E compares a company's share price with its earnings per share, helping investors judge how much they're paying for each dollar of profit.
A low nominal share price can therefore come attached to a spectacularly expensive valuation.
📊 Market Cap Also Tells You About Size
Market capitalization has another useful job: it lets investors compare companies regardless of their individual share prices. Like the TradingView Top companies list .
Companies are commonly grouped into categories such as large-cap, mid-cap and small-cap based on their total equity value. Market cap also determines influence inside capitalization-weighted indexes such as the S&P 500 SPCFD:SPX .
That's why Nvidia can exert enormous influence over the S&P 500 . Its current market capitalization sits in the multi-trillion-dollar range, making it the world's largest listed company.
Whether one Nvidia share trades at $100, $500 or $1,000 after adjusting the number of shares outstanding changes very little about that fundamental fact.
🧮 And Then Comes Enterprise Value
For traders ready for one extra level, there's enterprise value, or EV.
Market cap measures the market value of a company's equity. Enterprise value goes further by incorporating debt and cash, giving investors a broader picture of what the operating business effectively costs.
Imagine two companies each carry a $10 billion market cap. One has $8 billion of debt while the other sits on billions in cash. Their share-market values look identical, while their financial structures look considerably different.
That's why professional investors often compare enterprise value with sales, EBITDA or other operating measures, especially when analyzing companies carrying substantial debt.
🧠 Three Numbers, Three Different Questions
The easiest way to remember all of this is to ask what each number actually tells you.
Share price : What does one slice cost?
Market cap : What does the whole pizza cost?
Valuation : How much are investors paying relative to the pizza shop's sales, profits or cash generation?
Once you separate those three ideas, plenty of supposedly strange market behavior suddenly makes sense.
A $5 stock can be expensive and move in cents. A $500 stock can be cheap and climb like an athlete with double-digit gains daily. A stock split can reduce the share price by 90% while creating precisely zero additional economic value.
So the next time somebody tells you a stock "looks cheap because it's only $10," there's one useful question to ask before reaching for the buy button:
How many shares are there, and what exactly am I getting for my money?
Off to you : What’s the math behind your investments?  Education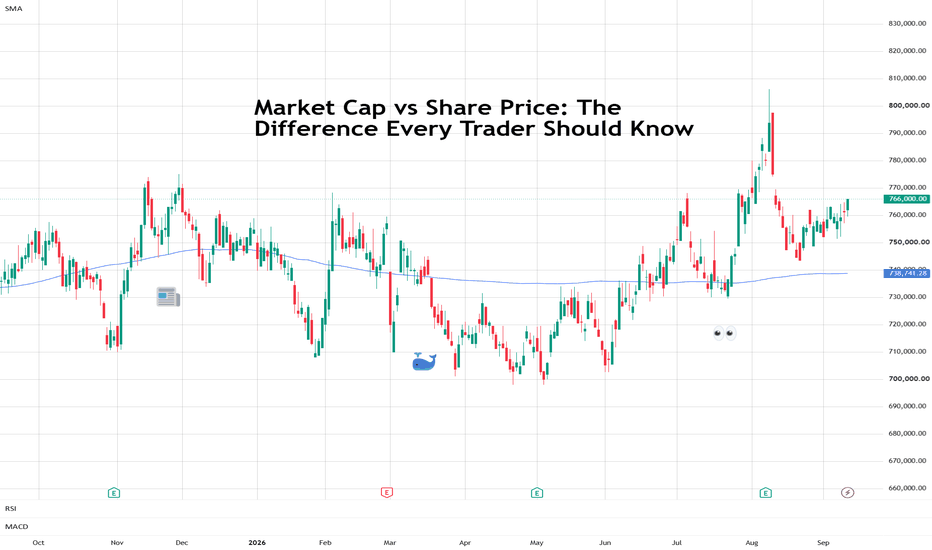
 Short
Short
NVDA Lost 217.73 And Gapped Through 214.58 To 212.91.NVDA Lost 217.73 And Gapped Through 214.58 To 212.91.
NVDA held the 217.73 shelf for two straight sessions and then gave it up overnight, gapping down 2.45% and taking out both the 214.58 gap level and 213.43 on the way to a 211.00 low. Price is now at 212.91, beneath all three of the levels it was working with last week, with 207.59 the next structural level underneath. Volatility on the hourly is in the 94th percentile of its range and the chart has moved into extension mode, which is what a gap through three levels looks like from the inside. The daily is flagging a swept high alongside a long-reversal state - a caution about chasing the move down, not a reason to fade it. Neutral.
Resistance: 213.43 - first overhead, just lost
Key resistance: 214.58 - the gap level that failed
Current price: 212.91
Support: 211.00 - the premarket low
Key support: 207.59 - the next structural level
Structural floor: 202.11 - deeper floor
Two paths from here:
It loses 211.00 and works toward 207.59. Taking out the overnight low with three levels already broken opens the next real support, and below 207.59 the chart thins out toward 204.82 and then 202.11. Extension this stretched can keep going, but it rarely does so in a straight line.
It reclaims 213.43 and fills back toward 214.58. Getting back above the levels it gapped through would make this an overshoot and put 217.73 back in question as the level to repair. Until 214.58 is reclaimed, every bounce is happening under broken structure.
Three named levels went in a single overnight move, which is the cleanest break this chart has produced in weeks. 211.00 below and 214.58 above are the two that matter now.
Built with SYNTHESIS v3.3 | SOM / ACE / IMP / SYNTHESIS
Study, not financial advice. LRCX: The 50-Day EMA Caps Recovery AttemptsLam Research’s daily chart shows weakening momentum following the strong advance into the late-June peak. Price is consolidating within the highlighted range, while the 50-day EMA has flattened and started to slope slightly downward.
The EMA previously supported the advance. It is now acting as dynamic resistance, with recent recovery attempts struggling to hold above it. Price remains in the lower half of the range, leaving the short-term setup vulnerable.
Bullish scenario: A sustained daily close above the 50-day EMA, followed by a successful retest, would improve the outlook and open the door to another test of the range ceiling. A confirmed breakout above that ceiling would strengthen the case for a recovery toward the previous peak.
Bearish scenario: Continued rejection around the EMA would keep the range floor under pressure. A daily close below this support, followed by a failed reclaim, would favour a deeper correction toward the late-July low.
My view: Neutral to bearish while price remains below the declining 50-day EMA. Holding the range floor may produce a bounce, but a stronger recovery requires buyers to reclaim the average and build follow-through.
At the time of review on September 14, TradingView displayed a last regular-session price of $298.22 and a pre-market quote near $276.55. That indicates additional downside pressure, but pre-market trading does not confirm a daily breakdown.
For educational purposes only. Not financial advice.
Laurent - Private Investor
✅ DL INVEST | Community Leader


