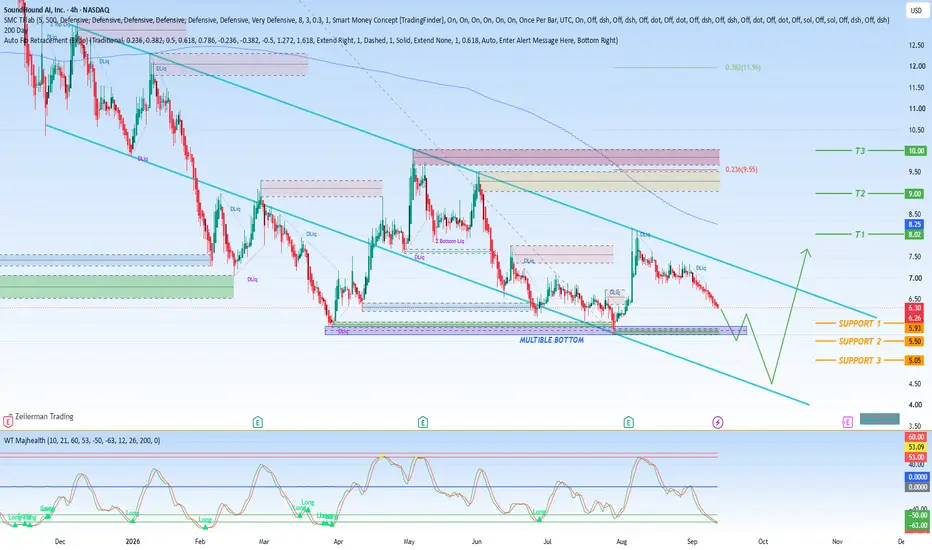
SoundHound AI (SOUN) Stock Down 15% in a Month!Is This Dip a Buying Opportunity or a Warning Sign?
SoundHound AI (SOUN) shares have declined roughly 15% over the past month, surrendering a substantial portion of the rally that followed the company's robust second-quarter 2026 earnings report. The pullback has reignited a familiar debate among investors: is this a healthy correction that offers an attractive entry point, or does it reflect deeper concerns about the company's path to profitability?
Profitability Remains Elusive Despite Strong Top-Line Growth
SoundHound's revenue trajectory continues to impress, but the company's strong growth has yet to translate into bottom-line profits. In the second quarter, SoundHound reported a GAAP net loss of $42.8 million, while adjusted EBITDA remained negative at $9.6 million. Although both measures showed year-over-year improvement, the company is still spending aggressively across technology, sales and acquired businesses.
Operating expenses tell the story of a company in heavy investment mode. Research and development expenses increased 5%, sales and marketing costs rose 5%, and general and administrative expenses jumped 43% — the latter driven partly by acquisition-related legal, advisory and headcount costs. These rising costs reflect SoundHound's ambition to scale quickly, but they also weigh heavily on the bottom line and delay the timeline to sustained profitability.
Cash Burn Keeps Investors on Edge
Cash consumption is another factor keeping investors cautious. SoundHound used nearly $60 million of operating cash during the first six months of 2026, up from $43.7 million a year earlier. That widening cash outflow underscores the capital-intensive nature of scaling an AI-driven enterprise software business.
To help fund operations, the company generated $48.5 million from common-stock sales during the same period, highlighting its continued reliance on external capital while scaling operations. While this approach provides necessary liquidity, it also raises concerns about shareholder dilution and the sustainability of the current burn rate if growth slows or capital markets tighten.
Should Investors Buy the SOUN Dip?
The recent decline has improved SoundHound's risk-reward profile, but this is not a low-risk stock. Persistent losses, ongoing cash burn, the complexities of LivePerson integration and a sizable valuation premium relative to key competitors could keep volatility elevated for the foreseeable future. Investors considering the dip should be prepared for sharp swings in either direction.
That said, the operating direction is clearly improving. Revenue growth remains strong, margins are moving higher, OASYS is driving enterprise wins, and the LivePerson combination greatly expands SoundHound's customer base and cross-selling opportunities. These factors suggest the company is building a broader and more durable platform for long-term growth.
The Bottom Line
SoundHound AI offers a compelling growth story in the conversational and agentic AI space, but it remains a high-risk, high-reward proposition. The recent 15% pullback may appeal to investors with a long time horizon and a tolerance for volatility, particularly if the company continues to narrow losses and successfully integrates LivePerson. However, those seeking stability or near-term profitability may want to wait for clearer signs that SoundHound can convert its strong revenue growth into sustainable positive cash flow.  Long
Long
PLTR Sept. 14–18: Can 165 Hold and Start the Next Rebound?
PLTR enters the new week around 167 after pulling back sharply from the September high near 188. The Daily chart still shows a much stronger larger structure than the recent 1H price action might suggest. The 1H has been trending lower, but price is now trying to build a base around 165–167. The GEX map supports this area as an important decision zone.
For Sept. 14–18, I see 165 as the immediate pivot. Holding it keeps a rebound setup alive. Losing it brings 162.5 and then 157.5 into play. On the upside, 170–175 is where buyers need to prove that this is more than another temporary bounce.
Daily Structure
I always start with the Daily because it tells me whether I am trading with or against the larger structure.
PLTR had a major breakout in early August, moving quickly from the 140s through the previous resistance around 164. That breakout eventually carried price into the 185–188 area, where momentum stalled.
Since reaching approximately 188.37, PLTR has been correcting and is now back near 167. What stands out to me is where that correction is happening. Price has returned almost directly to the previous breakout area around 164–165.
That makes this an important Daily retest.
As long as PLTR can defend this former resistance area, I view the current move as a pullback inside the larger bullish structure rather than a confirmed Daily breakdown.
If buyers stabilize here, 175 becomes the first meaningful recovery area, followed by 180 and eventually the previous high around 185–188.
If 164 fails decisively, however, the Daily chart begins to lose an important support that previously launched the August breakout.
1H Confirmation
The 1H tells a different story in the short term.
Since trading around 182–184 earlier in September, PLTR has produced a series of lower highs and lower lows. Price remains underneath the declining short-term trend structure, so I don't consider the 1H bullish yet.
There are early signs of stabilization.
The recent low around 164.55 was defended, and price subsequently bounced toward 168.69 before pulling back. Price is now around 167, while RSI has recovered to approximately 52. That is an improvement from the oversold conditions seen during the selloff.
The first thing I want to see is PLTR hold 165–166 and reclaim approximately 168.5–170.
A break through 170 would be the first meaningful indication that short-term momentum is changing. Above that, approximately 171–172 becomes another test before PLTR can make a serious attempt at 175.
Until those levels are reclaimed, I treat the current action as a potential bottoming attempt rather than a confirmed reversal.
GEX Positioning
The GEX map lines up very well with the technical structure.
PLTR is around 167.39, with nearby positioning concentrated around 165, 167.5 and 170. The HVL is down around 162.5, which becomes particularly important if 165 breaks.
Above price, I see call levels around 170, 172.5, 175, 177.5, 180 and 185. The 175 level stands out as an important call area and lines up with the recovery zone visible on the Daily chart.
Below price, the first major downside GEX level is approximately 162.5, followed by the put structure around 157.5 and 155.
The current GEX reading is positive, while calls represent approximately 56.8% in this snapshot. I don't use either number alone to predict direction. Positive gamma can encourage more controlled price action and reduce the tendency for moves to expand aggressively while price remains between major levels.
That makes 165–170 especially important. PLTR could continue chopping inside this area until one side takes control.
How I Put It Together
The Daily, 1H and GEX charts are giving me a fairly clear setup.
The Daily says PLTR is pulling back into an important former breakout area around 164–165.
The 1H says the short-term trend is still bearish, but selling momentum is beginning to stabilize around that same area.
The GEX map says 165–170 is also where a significant amount of nearby options positioning is concentrated.
For me, that makes 165 the defensive line and 170 the first confirmation line.
I don't want to assume the bottom is already in simply because PLTR bounced from 164.55. I want price to prove it.
Bullish Scenario
The bullish setup begins with PLTR continuing to defend 165 and reclaiming 168.5–170.
If 170 becomes support instead of resistance, I would watch 172.5 and 175 next.
The 175 area is particularly important because it combines technical resistance with a meaningful GEX call level. Breaking and holding above 175 would strengthen the argument that the correction from 188 has completed.
Above 175, the next levels are approximately 177.5–180, followed by 185.
The larger Daily high around 188.37 would become relevant again only if buyers can rebuild the structure through those intermediate levels.
Bearish Scenario
The bearish case starts if the current base fails.
A clean break below 165–164.5 would tell me that the former Daily breakout area is no longer being defended.
The next level I would watch is the 162.5 HVL.
If PLTR loses 162.5 and cannot recover it, downside risk increases toward 157.5, followed by 155.
That would also confirm continuation of the lower-high, lower-low structure currently visible on the 1H chart.
For that reason, 165 isn't just another intraday support level. It is important across the Daily structure, the 1H setup and the GEX positioning.
Options Outlook
For calls, I prefer seeing PLTR defend 165 and then reclaim 170 rather than buying simply because price looks inexpensive after the decline. Above 170, I would watch 172.5 and 175, with 177.5–180 becoming the next zone if momentum expands.
For puts, the cleaner setup for me would come from a confirmed loss of 164.5–165. That would put the 162.5 HVL in focus. Losing 162.5 could open 157.5 and 155.
Because the current GEX environment is positive, I would also be careful about chasing options while PLTR remains trapped around 165–170. If price stays inside that range, the better trade may simply be waiting for confirmation.
Conclusion
PLTR is entering Sept. 14–18 at an interesting location. The stock has corrected significantly from 188, but the pullback has brought price directly back into the Daily breakout area around 164–165.
The 1H trend hasn't turned bullish yet, but momentum is stabilizing. GEX reinforces the same structure with important positioning around 165–170 and the HVL near 162.5.
For me, 165 and 170 define the setup.
Hold 165 and reclaim 170, and I start watching 172.5, 175 and potentially 180.
Lose 165, and 162.5 becomes the next test. Lose that, and 157.5–155 becomes much more realistic.
I don't need to predict which one happens. The levels are already there. I want PLTR to show which side is taking control, then trade the confirmation.
Educational analysis only. Not financial advice. TSLA Sept. 14–18: 360 Support vs. 370 Resistance Sets Up the Next Move
Tesla enters the new week around 365 after recovering strongly from the July low near 297. The Daily chart shows that the recovery is still intact, but TSLA has now reached an important resistance area where buyers have struggled to push price higher. The 1H chart confirms that price is consolidating rather than trending, while the GEX map places TSLA between the 362.5 HVL and a major call structure around 370.
For me, 360 to 370 is the key decision range for Sept. 14–18. A confirmed break outside that range should give us a much better indication of the next move.
Daily Structure
I start with the Daily because TSLA's larger structure has changed considerably since the July selloff. Price dropped from the 400 area and eventually reached approximately 297.38. Since that low, buyers have steadily rebuilt the stock back toward 365.
The recovery itself is constructive. TSLA has been making higher lows from the July bottom and has recovered the previous breakdown area around 360. However, price is now running directly into an important resistance zone around 365–375. This is where the next test begins.
The larger Daily chart also shows substantial resistance above current price. Approximately 425–435 is the next major structural area, followed by the previous high around 453.40. Those are not immediate targets for this week, but they show why a confirmed breakout from the current structure would matter.
For now, the Daily picture is improving, but I would not call it a confirmed breakout while TSLA remains underneath 375. Holding approximately 350–360 keeps the recovery structure intact. Losing that area would make me question whether this rally is beginning to fail.
1H Confirmation
The 1H chart shows the battle much more clearly.
TSLA has spent several sessions moving sideways between approximately 360 and 370. There have been repeated attempts to move through the upper part of the range, but buyers have not been able to establish acceptance above it. At the same time, sellers have tested the lower end around 360 several times without creating a sustained breakdown.
That is consolidation.
Price is currently around 365, almost directly in the middle of the range. RSI is also around 51, which is essentially neutral. This confirms what price is already telling me: neither side has established clear control.
The first short-term bullish confirmation would be a move through approximately 367–370. If TSLA breaks 370 and successfully holds it, the 1H structure changes from consolidation toward bullish continuation.
On the downside, 360 is the important line. A clean loss of 360 would break the lower portion of the current range and put sellers back in control.
GEX Positioning
The 1H GEX map supports almost exactly what I see on the technical chart.
TSLA is around 365.25 with the HVL near 362.5. Above price, the GEX structure becomes increasingly important around 365, 367.5 and especially 370, where the strongest nearby call level sits.
Above 370, the next GEX levels appear around 375, 380, 385 and 400. This gives us a very clear upside ladder if TSLA can actually break out.
Below price, 360 is the first major put level, followed by approximately 355 and 350.
The GEX snapshot is also positive. I don't interpret positive gamma as bullish by itself. Instead, positive gamma can help suppress volatility and encourage price to rotate around important levels. That fits the sideways behavior we're already seeing around 360–370.
This is another reason I don't want to chase calls at 365 or puts at 365. Price is sitting almost exactly in the middle of the structure.
How I Put It Together
The three charts are actually telling a fairly consistent story.
The Daily says TSLA is recovering from the July low but has reached an important resistance area. The 1H says price is consolidating between roughly 360 and 370. The GEX map confirms those same levels, with 362.5 acting as the HVL and 370 standing out as the important upside call level.
That makes my bias neutral inside 360–370.
Instead of predicting which direction TSLA will break, I want to see price leave this range and then prove that it can hold outside it.
Bullish Scenario
For the bullish case, I first want TSLA to hold above the 362.5–360 support area and begin pushing through 367.5.
The real confirmation comes around 370.
If TSLA breaks 370 and successfully holds above it, I would watch approximately 375 first. Above 375, the GEX map opens toward 380 and 385.
A strong move through 385 would make 400 the next major psychological and GEX area.
More importantly, sustained strength above 370 would confirm that the 1H consolidation is resolving in the same direction as the recovery visible on the Daily chart.
Bearish Scenario
The bearish setup begins if TSLA continues rejecting 367–370 and then loses 362.5–360.
A clean break below 360 would tell me that the current consolidation is resolving lower rather than simply producing another intraday dip.
Below 360, I would watch 355 first and then 350.
The 350 area becomes especially important because losing it would begin damaging the recovery structure that has developed from the July low.
If 350 fails decisively, I would stop treating the current move as a normal consolidation and start looking for a deeper Daily retracement.
Options Outlook
For calls, I prefer confirmation above 370 rather than buying while TSLA is sitting around 365 in the middle of the range. Above 370, I would watch 375, 380 and 385 as the next GEX areas.
For puts, I prefer either a strong rejection from 370 or, more importantly, confirmation below 360. A loss of 360 opens 355 and then 350.
The positive GEX environment is particularly important for options traders. If TSLA remains trapped between 360 and 370, price could continue chopping while short-dated options lose value. In that environment, being patient for the breakout may be more important than trying to predict it.
Conclusion
TSLA enters Sept. 14–18 with a recovering Daily structure but a neutral 1H consolidation. The GEX map reinforces that picture, with price sitting around 365 between the 362.5 HVL and the major 370 call level.
For me, 360–370 defines the week.
Above 370, I watch 375, 380 and 385, with 400 becoming important if momentum really expands. Below 360, I watch 355 and 350.
The larger Daily recovery still favors buyers as long as major support continues holding, but at 365 I don't see a reason to chase either direction. I would rather let TSLA show whether 370 breaks or 360 fails, then use the 1H price action and GEX levels to trade the confirmation.
Educational analysis only. Not financial advice. MU Sept. 14–18: 970 Support vs. 1,000 Resistance Sets Up the Week
Micron enters the new week in a very different position from NVDA. The Daily chart still has a larger bullish structure underneath it, but price has been compressing after failing to push back through the 1,000 area. The 1H chart shows a weaker short-term trend with repeated lower highs, while the GEX map places MU right on top of an important 970 HVL with 1,000 acting as the major upside call level.
For me, that makes 970 to 1,000 the key decision range for Sept. 14–18.
Daily Structure
I start with the Daily because the bigger structure still matters most for a weekly outlook. MU had a major run from the spring lows and eventually peaked around 1,255. Since then, price has been working through a broad consolidation with a descending trendline from the high and a rising support line underneath price.
That creates a large compression pattern. MU is no longer in a clean momentum trend higher, but it also has not broken the larger bullish structure yet.
The most important thing I see on the Daily is that price is sitting around 975, underneath the descending trendline and just below the 1,000 to 1,035 resistance area. Until MU can reclaim that zone, the larger breakout is still unconfirmed.
On the downside, the rising Daily support structure is still intact well below current price. The stronger broader support sits around the mid 700s, while 900 becomes the more important intermediate level if the current consolidation breaks lower.
So the Daily is not bearish to me yet. It looks more like a stock compressing inside a larger range and waiting for a catalyst.
1H Confirmation
The 1H chart is weaker than the Daily.
MU rejected from the 1,040 to 1,060 supply zone and then began making lower highs. Price dropped toward 969, bounced, attempted to recover toward 998, and then rolled back over toward 975.
That tells me short-term sellers are still active.
The moving-average structure is also above price, and RSI is sitting around the upper 30s, below its signal line near 40. That confirms weak short-term momentum.
The important point is that MU is now consolidating instead of accelerating lower. The 969 to 975 area has been defended several times. So I would not call this a clean breakdown unless that support actually fails.
For the 1H, I want to see 980 reclaimed first. Above that, 990 to 1,000 becomes the real test. If MU can get through 1,000 and hold it, the short-term structure improves considerably.
GEX Positioning
The 1H GEX map lines up very closely with the technical chart.
MU is trading around 975 while the HVL sits near 970. That makes 970 one of the most important levels for the week.
Above price, the GEX structure shows approximately 980, 990, 995 and 1,000, with 1,000 standing out as the major call level. Above that, the next areas are approximately 1,020 and 1,030, followed by the larger 1,100 level.
Below price, the map shows a much bigger gap. After the 970 area, the next major downside GEX levels are around 940, then approximately 900 and 890.
That is important because if MU loses 970 decisively, there is less visible gamma support immediately underneath price compared with what sits above it.
The snapshot is also showing positive GEX. I treat that as a potential stabilizing influence while MU remains around the main gamma levels. Positive gamma can encourage more two-sided, mean-reverting trade instead of immediate expansion.
So as long as 970 holds, I would not be surprised to see MU continue chopping between roughly 970 and 1,000.
How I Put It Together
The Daily says MU is still compressing inside a larger bullish structure.
The 1H says momentum is weak and sellers still control the short-term trend.
The GEX map says 970 is a major support/pivot while 1,000 is the first major upside barrier.
That gives me a neutral bias inside the range rather than forcing a directional call.
For me, the trade becomes much cleaner once MU leaves 970 to 1,000.
Bullish Scenario
For the bullish case, MU first needs to continue holding 970 and recover 980. That would be the first sign that buyers are defending the lower end of the range.
After that, I would watch 990 and then 1,000.
A clean break and hold above 1,000 would be meaningful because the 1H trend would begin improving at the same time that price clears the major GEX call level.
Above 1,000, the next areas I would watch are approximately 1,020 and 1,030. A stronger move through those levels would put the larger Daily resistance around 1,035 to 1,060 back in play.
If MU can eventually clear that entire zone, then the broader Daily structure becomes much more constructive.
Bearish Scenario
The bearish case begins if MU loses 970 and cannot reclaim it.
That would weaken both the 1H price structure and the GEX support at the same time.
Below 970, I would watch 940 first.
If selling accelerates through 940, the next meaningful downside area becomes approximately 900 to 890.
That would also start damaging the larger Daily compression structure and make the current consolidation look more like distribution than accumulation.
Options Outlook
For calls, I would prefer confirmation over 980 and especially above 1,000. A successful reclaim of 1,000 opens a better path toward 1,020 and 1,030.
For puts, I would rather see a confirmed break below 970 than buy them while price is still sitting directly on top of HVL support.
Because the current GEX environment is positive, I would also be cautious with short-dated options if MU remains trapped between 970 and 1,000. That kind of environment can produce a lot of movement that looks interesting intraday but still goes nowhere on a closing basis.
Conclusion
MU enters Sept. 14–18 in a compression setup rather than a clean directional trend. The Daily structure is still holding, the 1H remains weak, and the GEX map places price directly around the 970 HVL with 1,000 acting as the major upside barrier.
For me, 970 to 1,000 defines the week.
Above 1,000, I watch 1,020, 1,030 and then the larger 1,040 to 1,060 resistance zone.
Below 970, I watch 940 first, followed by 900 to 890 if selling expands.
Until MU leaves that range, I would rather trade the confirmation than predict the breakout.
Educational analysis only. Not financial advice.  Short
Short
NVDA Sept. 14–18: 215 Support vs. 220 Resistance Sets Up the Next Move
NVDA enters the new week around 218 with an interesting conflict between the larger Daily structure and the shorter-term 1H trend. The Daily chart is still holding an important rising support structure, but the 1H remains weak after a rejection from the 230 area. The GEX map adds another important piece: 215 is the major HVL below price while 220 is the first major call level above it.
For me, that makes 215–220 the key decision range for Sept. 14–18. I don't want to assume the next direction while NVDA remains trapped inside it.
Daily Structure
I start with the Daily because the larger structure has not completely broken down. NVDA made a major low around 190 in late July and then developed a series of higher lows into August and September. The rising trendline from that low is still relevant, and price is currently testing that structure around 218–220.
There is also an important change in the larger pattern. The descending trendline from the May high around 236 has already been broken, which initially improved the Daily setup. NVDA subsequently rallied back into approximately 233–236 but failed to break through that major resistance area. That rejection brought price back toward the rising trendline.
This means NVDA is now testing whether the breakout was the beginning of a larger reversal or simply another failed attempt at the highs. As long as the rising Daily structure survives, I am not ready to call the larger setup bearish. However, losing this trendline and then 210 would weaken the Daily picture considerably.
On the upside, 225 is the first area I want to see recovered, followed by approximately 230 and 233–236. The 233–236 area is the real Daily breakout zone. If NVDA eventually clears that resistance with confirmation, the larger structure becomes much more bullish.
1H Confirmation
The 1H is weaker than the Daily and explains why I'm not immediately bullish.
NVDA was rejected from the 231–235 supply area and has been making lower highs since then. Price subsequently lost 225 and 223 before dropping toward approximately 217.20. A bounce developed from there, but it failed around 220–221 and price has returned to approximately 218.
The short-term moving-average structure is also sitting above price, while RSI is around 36 and below its signal line near 45. That tells me momentum remains weak. Unlike ORCL, however, NVDA's RSI isn't extremely oversold, so there is still room for another move lower if support fails.
The level that changes my short-term view is 220. If NVDA can reclaim 220 and begin holding above it, I would look for 223–225 next. If it cannot reclaim 220 and continues making lower highs underneath it, sellers still have short-term control.
The most important nearby price support is approximately 217–216. Losing that area would put the 215 zone directly in play.
GEX Positioning
The 1H GEX map lines up very well with what the technical charts are showing.
NVDA is around 218.26, almost directly between the 215 HVL and the 220 C1 level. That is why I see 215–220 as the battlefield rather than trying to predict direction from the middle.
The GEX environment is positive on this snapshot. Positive gamma generally tends to suppress volatility and encourage more mean-reverting price action while important gamma levels remain intact. It doesn't mean NVDA automatically goes higher. It means I would be more careful expecting a large directional move until price actually escapes the current gamma structure.
Above price, the GEX map shows 220 as C1, followed by approximately 222.5, 225, 227.5, 230 and 235. The interesting part is how closely those levels line up with resistance already visible on the Daily and 1H charts.
Below price, 215 is the HVL and major immediate downside level, followed by approximately 212.5, 210 and 207.5.
That alignment gives me much more confidence in these areas as reaction levels.
How I Put It Together
The Daily is still trying to maintain a larger bullish recovery structure, but the 1H has not confirmed it. Short-term momentum remains bearish underneath 220, while GEX has price sitting between the 215 HVL and the 220 call level.
So I enter the week neutral inside 215–220.
I become more bullish if NVDA reclaims 220 and begins building above it. I become more bearish if NVDA loses 215 and cannot recover it.
This is one of those situations where I would rather let the market show its hand than guess from the middle of the range.
Bullish Scenario
For the bullish case, the first job is reclaiming 220. I want more than a quick move above it. I want to see buyers establish acceptance above that level.
If that happens, 222.5–225 becomes the next target area. A break through 225 would improve the 1H structure and put approximately 227.5–230 back into play.
The bigger test is still 233–236. That is where the Daily chart previously rejected and where the larger resistance structure sits. If NVDA eventually clears 236 with strong price acceptance, I would consider that a much more important Daily breakout than anything happening around 218 today.
Bearish Scenario
The bearish scenario starts with continued rejection below 220 followed by a loss of the 217–215 support area.
A clean break below 215 would be important because both the technical structure and GEX point toward that level. If 215 fails and cannot be reclaimed, I would watch approximately 212.5 and 210 next.
Below 210, the next GEX level is around 207.5, and the Daily structure would also begin looking considerably weaker.
So 215 isn't just another number on the chart. For me, it separates the current consolidation from a potentially deeper pullback.
Options Outlook
For calls, I prefer confirmation above 220 rather than buying while NVDA remains underneath short-term resistance. A successful reclaim of 220 opens 222.5–225 first. Above 225, the setup becomes more interesting for a continuation toward 227.5–230.
For puts, I would rather see a confirmed loss of 215 or another strong rejection from 220. If 215 breaks, 212.5 and 210 become the next areas I would watch.
Because this GEX snapshot is showing positive gamma, I would also be careful buying expensive short-dated options while NVDA remains trapped between 215 and 220. If price simply chops between the major gamma levels, directional option buyers can be right about the larger idea and still lose from time decay and lack of movement.
Conclusion
NVDA enters Sept. 14–18 at a genuine decision point. The Daily structure has improved from the summer lows but is now retesting rising support after failing near 233–236. The 1H remains weaker with lower highs and price below short-term resistance. Meanwhile, the GEX map places NVDA almost perfectly between the 215 HVL and 220 C1.
For me, 215–220 defines the opening setup for the week. Above 220, I watch 222.5, 225, 227.5 and 230, with 233–236 remaining the major Daily resistance. Below 215, I watch 212.5, 210 and 207.5.
I don't need to guess whether NVDA is going to 230 or 210 before Monday opens. I want to see which side of 215–220 breaks and, more importantly, whether price can hold that break. That confirmation should tell us much more about where NVDA wants to trade next.
Educational analysis only. Not financial advice. ORCL Sept. 14–18Daily Reversal Tested as 150 Becomes the Battleground
Oracle enters the new week at an important technical decision point. The Daily chart has made a meaningful improvement by breaking the longer-term descending trendline, but the 1H chart has turned bearish after a strong rejection from resistance. At the same time, the 1H GEX map has ORCL trading below the important 150 HVL in negative gamma.
For me, this creates a simple question for Sept. 14–18: can ORCL defend the larger Daily recovery and reclaim 150, or will the short-term weakness continue toward 145 and possibly 140?
Daily Structure
I always start with the Daily because it tells me what the larger structure is doing before I look at the lower timeframe. ORCL peaked around 250.25 in June and then spent several months making lower highs and lower lows. The descending trendline from that high controlled the stock through June, July and into August.
That trendline has now been broken, which is the first meaningful improvement in the larger structure. ORCL established a major low around 114.50 and then recovered through August and early September. However, breaking a bearish trendline does not automatically create a new bullish trend. Buyers still need to establish higher support and successfully break the next major resistance.
The first important Daily resistance is around 160. ORCL recently traded above that area but couldn't hold it and has now pulled back toward 147.80. For me, the broader recovery remains alive while the major support structure around 140 holds. If buyers eventually reclaim 160, I would watch the 166–170 area next, followed by the larger resistance around 184–185.
1H Confirmation
The 1H chart is where I become more cautious. ORCL recently pushed into approximately 166, directly underneath the larger supply area, and sellers rejected the move aggressively. Price subsequently lost 160, 155 and 150 before reaching approximately 147.81.
That gives the 1H a clearly bearish short-term structure. Price is below the short-term trend structure, the chart is showing a support break, and RSI has fallen to approximately 21. This tells me momentum is weak, but it also tells me the stock is already stretched. Because of that, I don't want to chase puts after a large decline.
The first thing I want to see Monday is how ORCL reacts around 150. If a bounce cannot reclaim 150–151, sellers still control the short-term structure. If buyers recover 150 and then push through 153–155, the 1H begins repairing itself. A recovery above 160 would be a much stronger change in character.
GEX Positioning
The 1H GEX map helps confirm why these price levels matter. ORCL is around 147.81 while the HVL sits near 150, meaning price has moved underneath an important gamma pivot. The GEX environment is also negative. I don't interpret negative gamma as automatically bearish; instead, it tells me dealer hedging can amplify movement once an important level breaks.
Below price, 145 is the first important GEX area, followed by approximately 142 and the major put wall/POI around 140. What gets my attention is that the 140 GEX level also lines up with the broader Daily support structure. When the technical chart and options positioning identify approximately the same area, I give that level more importance.
Above price, the GEX map gives us a clear ladder. The first major level is 150, followed by approximately 155 and the stronger C1 around 160. If ORCL can recover through those areas, the next GEX levels sit around 165, 170, 175 and 180.
How I Put It Together
The three charts are not completely aligned, and that's actually what makes this setup interesting. The Daily says the larger downtrend has been challenged and a recovery is developing. The 1H says sellers currently control the short-term move. GEX shows ORCL below the 150 HVL in negative gamma, which could allow the next confirmed break to travel farther.
Because of that, I enter the week with a neutral-to-bearish short-term bias, but I'm not interested in blindly chasing puts. I want price to confirm the next move.
Bullish Scenario
For the bullish case, ORCL first needs to reclaim 150 and prove it can hold that level as support. If that happens, 153–155 becomes the next test. A recovery through 155 would tell me the 1H selloff is beginning to repair itself and put 160 back into play.
A clean reclaim of 160 would be much more important because the lower timeframe would then begin aligning with the improving Daily structure. Above 160, I would watch 165 and 170 as the next major upside areas.
Bearish Scenario
If ORCL attempts to bounce but continues rejecting below 150, sellers maintain the advantage. The next important test becomes 145. A clean break below 145 would make the GEX levels around 142 and 140 increasingly important.
The 140 area is the major downside decision zone for me. If buyers defend it, ORCL could establish a larger Daily higher low and keep the recovery structure alive. If 140 breaks decisively, I would become much more skeptical about the Daily reversal.
Options Outlook
For calls, I prefer confirmation rather than trying to catch the exact bottom. A reclaim and hold above 150 improves the setup, while a move through 155 makes calls more interesting because 160 becomes the next major GEX target.
For puts, I would rather see a failed rebound into 150 or a confirmed break below 145 than chase ORCL after an already extended selloff. Below 145, I would watch 142 and 140. The 1H RSI is already deeply oversold, so risk/reward becomes more important than simply being correct about direction.
Conclusion
ORCL enters Sept. 14–18 with the Daily and short-term charts telling different stories. The Daily is attempting to build a larger reversal, while the 1H has turned bearish and GEX has price below the 150 HVL in negative gamma.
For me, 150 is the main decision level this week. Reclaiming 150 and then 155 would shift my attention back toward 160 and potentially 165–170. Staying below 150 and losing 145 would shift my attention toward 142 and especially 140.
I don't need to predict the entire week before it starts. I want ORCL to show which side controls these levels, and then I can trade with that confirmation instead of guessing.
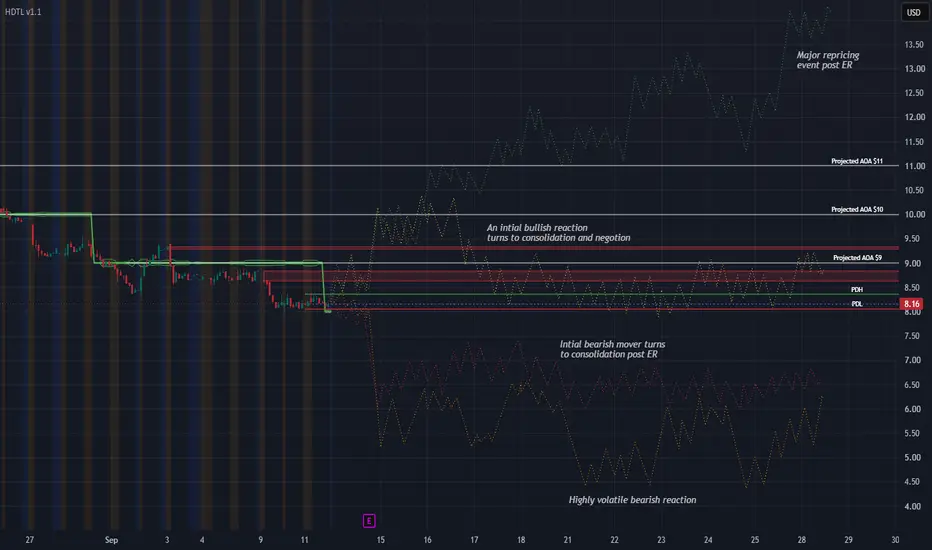
Educational analysis only. Not financial advice. PLAY - Multi-Week Banger or Dud? PLAY reports earnings Monday after the close, and this is one of the more interesting setups on my watchlist this week because I believe the catalyst has the potential to become more than a one-day earnings trade.
Before getting into the thesis, an important point about the chart:
The colored paths are illustrations for visual learners.
They are not predictions of exactly where price will go, when it will get there, or what each individual candle should look like. I’m using them to illustrate the type of behavior and reaction I would expect under several different post-earnings outcomes.
I care about the behavior around the decision areas, not whether price follows one of my squiggly lines perfectly.
Why PLAY has my attention
PLAY has been in a sustained long-term decline and is trading near historically depressed levels.
That alone is not bullish.
A stock being down 80% does not mean it cannot fall another 50%.
What makes this interesting is the combination of an extremely beaten-down equity, a business attempting a turnaround, a major earnings catalyst, and historical evidence that a change in the market’s perception of the company can create an outsized repricing.
We have seen PLAY do this before.
Following a previous earnings event, the stock eventually traveled roughly 118% over the following 87 days.
That does not mean history is about to repeat.
What it tells me is that when expectations become this depressed, a meaningful change in the perceived trajectory of the business can potentially create something much larger than the initial earnings gap.
That is why I deliberately extended this scenario map much farther than I normally would for an earnings setup.
I’m interested in whether Monday’s report can become the beginning of a multi-week repricing event.
🟢 The only scenario I am personally interested in trading
Normally I would explain how I might approach each scenario.
I’m intentionally not doing that here.
The green scenario is the only one that currently fits my trading plan, so it is the only one I am interested in potentially putting money behind.
And even then:
I am not gambling on the earnings print.
I want to see the reaction first.
For me, a bullish earnings headline or a big after-hours candle isn't enough. I want the market to begin proving that investors are actually reassessing the company.
That could include behavior such as:
A meaningful positive earnings reaction.
Holding a substantial portion of that reaction instead of immediately fading it.
Reclaiming the nearby $9 Projected AOA.
Building acceptance rather than producing a one-candle squeeze.
Eventually challenging the $10 and $11 Projected AOAs.
Pullbacks being bought rather than every rally being sold.
New structure beginning to develop above the range PLAY has been trapped in.
If that behavior develops, then I become interested in the possibility that this is no longer simply an earnings pop.
It may be a repricing campaign.
The $11 area would be particularly important to me. A sustained move through that region would represent a much more meaningful departure from the structure PLAY has been living inside.
From there, the question changes from:
“Did PLAY have a good earnings reaction?”
to:
“Has the market materially changed what it believes this company is worth?”
Those are two very different trades.
🟡 Yellow is information — not my trade
The yellow illustration represents something like:
positive initial reaction → failure to develop sustained acceptance → consolidation/negotiation.
PLAY could easily have a decent report, jump initially, and then spend days arguing about what the numbers actually mean.
That might eventually create a trade.
It just isn't the setup I'm looking for right now.
If price remains trapped around the current battlefield and continues negotiating between approximately $8 and $9, I have no reason to force something simply because earnings occurred.
I can wait.
🔴 Red is also information — not my trade
The bearish illustrations represent different degrees of disappointment.
One shows an initial downside reaction eventually stabilizing.
The other represents a much more violent deterioration where the earnings event causes another significant repricing lower.
Both are absolutely possible.
Neither fits what I am looking for.
So I'm not going to manufacture a bearish trade simply because I drew a red line on a chart.
Scenario planning tells me what could happen.
My trading plan determines what I am actually allowed to trade.
Those are not the same thing.
This would require a different risk model
If PLAY develops into the green scenario, I would not treat it like one of my normal intraday options trades.
My normal position can be around $5,000.
For something like this, where I may want to give a multi-day or potentially multi-week thesis room to develop, I would size dramatically smaller.
My maximum position would be approximately $1,000.
And I size it that way for a very specific reason:
I have to be financially and emotionally prepared for that $1,000 to become $0.
That doesn't mean I'm planning to sit there and watch a worthless contract expire.
It means I don't want normal intraday volatility forcing me out of a longer-duration thesis simply because I used an intraday-sized position.
Different trade.
Different timeframe.
Different risk model.
What does not change is the process.
I still want the market to prove the thesis before I participate.
What I’m actually watching Monday night and Tuesday
I don't particularly care whether PLAY simply “beats earnings.”
A beat can gap up and completely fail.
I'm watching for evidence that the market believes the trajectory of the company is changing.
Then Tuesday, regular-hours price action gets the final vote.
I want to see whether buyers defend the repricing once normal liquidity returns.
Does PLAY reclaim important structure?
Does it hold it?
Does VWAP become support instead of a ceiling?
Do sellers immediately crush every rally, or does supply begin getting absorbed?
Does price start spending time in areas it hasn't been able to maintain?
Those questions matter far more to me than whether EPS beat an analyst estimate by a few cents.
The thesis in one sentence
I'm not trying to predict PLAY earnings. I'm looking for evidence after earnings that the market has begun repricing the entire turnaround story.
If that evidence appears, I think this has legitimate multi-week potential.
If it doesn't?
I lose absolutely nothing by watching it happen without me.
Preparation > Prediction.  Long
Long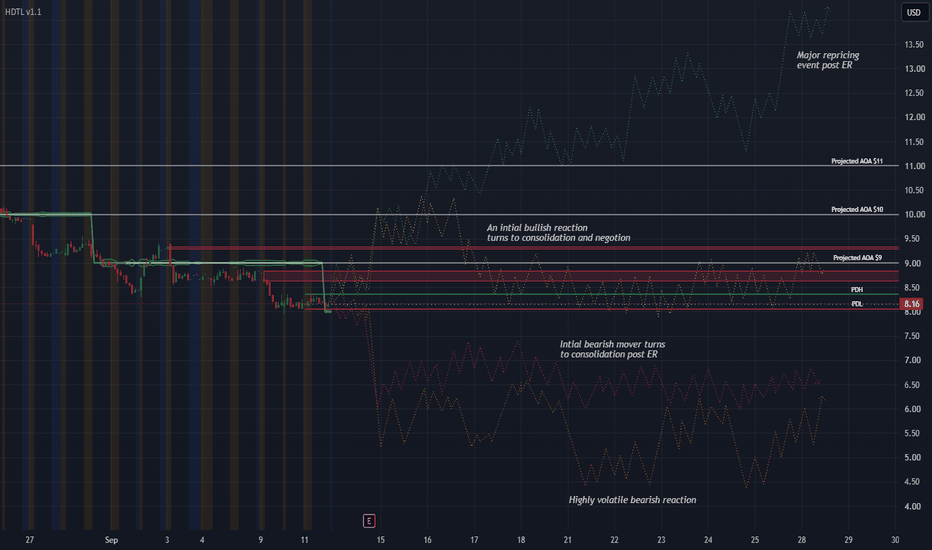
TSLA: Bearish 5-0 Pattern Could Signal a Much Larger Move LowerTesla has reached what I believe could be a long-term top at $498.83. Since that high, the structure has started to change, and the chart is now showing a potential bearish 5-0 harmonic pattern forming alongside Elliott Wave elements.
The interesting part is that the market may still be in the early stages of a much larger correction.
Bearish 5-0 Pattern
The bearish 5-0 pattern is forming near the current area, with price testing the upper portion of the structure.
The key level I am watching is around $367, which is also the 0.5 level marked on the chart.
If TSLA continues to reject this area, the bearish 5-0 could provide the next major leg lower.
Elliott Wave Structure
My bias is that $498.83 marked a major long-term top.
Since that high, TSLA appears to be working through waves 1 and 2 on both higher and lower degrees. In other words, we may still see a series of smaller corrective rallies and declines before the larger structure finally breaks.
The important part comes when this structure snaps and wave 3 begins.
Wave 3 is typically where momentum can accelerate significantly, and that is where I believe the downside could really start to expand.
Trade Setup
Entry: Around $365–$367
Stop Loss: $453.40
Take Profit Targets:
TP1: $259
TP2: $150
TP3: $100
The first target at $259 would be the initial confirmation that sellers are gaining control. If TSLA breaks through that level with momentum, I would be watching $150 and eventually $100.
The Bigger Picture
This is not a call that TSLA has to collapse immediately. The market can continue chopping around while waves 1 and 2 develop on multiple degrees.
But if the bearish 5-0 remains valid and the corrective structure eventually breaks, the move into wave 3 could be much more aggressive than the moves we have seen so far.
For me, the key idea is simple:
$498.83 may have marked the long-term top.
If TSLA continues failing around the current resistance area and the bearish structure confirms, we could eventually see an accelerating wave 3 to the downside.
Entry: $365–$367
Stop: $453.40
Targets: $259 → $150 → $100
This is where the bearish 5-0 gets interesting. The pattern may be forming now, but the real move could come when the larger wave structure finally snaps.  Short
Short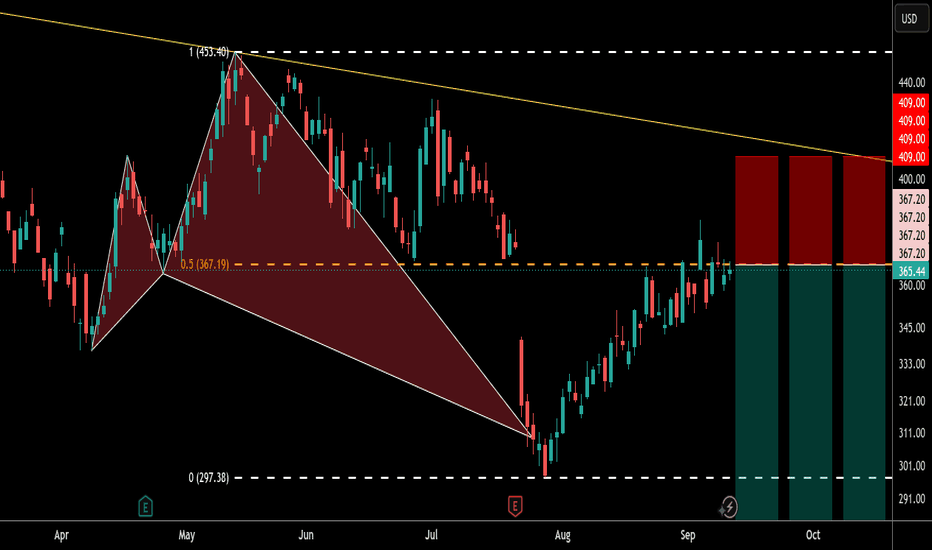
 Long
Long
TSLA Weekly — Coiling at the 150 SMA, Still Trapped Under the DoTesla (NASDAQ: TSLA) — Weekly , Log Scale
What's constructive:
- Price bounced cleanly right off the 150-week SMA (~$314), which has stepped in as dynamic support on this pullback.
- There's also a support trendline running from the November 2025 low — it's sloping downward, not rising, but price keeps holding above it on every test. That, combined with the descending line off the December 2025 ATH, looks more like a flag than a wedge — the two lines are running roughly parallel rather than converging — and this kind of consolidation can still resolve into a real directional move.
What's not:
- Price is still inside the downtrend from the December 2025 ATH (~$488) — that trendline hasn't been reclaimed yet.
- The major support trendline going back to April 2024 got broken in July 2026 and hasn't been reclaimed — it's now acting as resistance overhead.
Bottom line: This is a name I'm watching, not one I'm long yet. Until TSLA reclaims either the ATH downtrend line or gets back above the broken April 2024 trendline, I don't consider this a swing long setup — the basing action above the 150 SMA is a good sign, but structure still says "wait for confirmation."
NFA, just TA.  Long
Long
 Long
Long
Tesco — Downside Pressure Building Toward 430Tesco is currently displaying a fragile price structure, with the latest movement favoring the bearish side. The market is showing persistent weakness, and the prevailing setup suggests that the stock may have further room to depreciate before reaching the 430 target region.
The current price behavior indicates that upward recoveries are facing resistance, while downward moves are gaining greater traction. This imbalance keeps the selling scenario active and increases the probability of another leg lower if the present structure remains intact.
From the chart perspective, 430 stands out as the primary downside destination. The route toward this level could develop through several stages, with intermittent rebounds possible along the way. However, unless the market produces a meaningful structural reversal, such recoveries may remain limited within the broader bearish framework.
The current formation is particularly notable because sellers are dictating the rhythm of the move. Lower pricing is being accepted by the market, while attempts to regain lost territory have not yet produced sufficient strength to change the overall outlook.
External factors such as UK consumer sentiment, retail-sector conditions, inflation expectations, household spending, currency fluctuations, and company-specific developments can influence Tesco's volatility. Nevertheless, the technical configuration currently keeps attention firmly on the downside.
The projected sequence is:
Existing weakness → renewed selling activity → further price erosion → 430 objective.
📍 Market Bias: Bearish
📉 Trade Direction: Sell
⚠️ Current Condition: Weakness prevailing
🎯 Projected Level: 430
🔻 Scenario: Continued downside
The chart remains under pressure, and 430 is the key level in focus while the bearish formation continues to unfold.  Short
Short
 Long
Long
Standard Chartered — Buyers Driving Toward 2627Standard Chartered is currently presenting a favorable bullish setup, with the latest price action indicating that buyers are gaining stronger control and creating scope for a continued advance toward the 2627 target area.
The underlying structure is showing positive development, with upward pressure becoming more prominent across the recent movement. Instead of displaying sustained weakness, price is maintaining a constructive trajectory that can support another leg higher as bullish participation continues to build.
The 2627 region is the principal upside objective for this analysis. A continuation of the current market behavior could allow the stock to progress through intermediate resistance levels and gradually extend its valuation toward the projected destination.
From a technical standpoint, the developing formation favors sustained appreciation. Buyers appear increasingly comfortable at higher levels, while bearish attempts have so far lacked the strength required to change the broader direction. This creates a favorable environment for the bullish scenario to remain active.
Standard Chartered's performance can also be influenced by global banking sentiment, interest-rate expectations, credit conditions, economic growth prospects, currency fluctuations, and developments across international financial markets. These factors may introduce volatility, but the current technical roadmap remains focused on the upside.
The projected progression is:
Positive structure → stronger buyer participation → continued appreciation → 2627 target zone.
📍 Bias: Bullish
📈 Trade Direction: Buy
🚀 Momentum: Positive
🎯 Target: 2627
⚡ Structure: Upside continuation
The chart continues to favor higher ground, with 2627 remaining the key projected destination as buyers attempt to extend the current advance.  Long
Long
 Long
Long
Vodafone — Buyers Positioning for a Move Toward 131Vodafone is currently showing a constructive upside formation, with price action indicating that buyers are gradually gaining stronger influence over the market. The recent behavior suggests that the stock has room to develop another upward phase, keeping the immediate outlook tilted toward the buying side.
The 131 level stands as the primary upside objective in this setup. Current momentum provides a basis for a continued advance, with price potentially progressing through intermediate levels as bullish participation strengthens.
From a technical perspective, the market is attempting to establish a healthier upward trajectory. The developing structure indicates that downside pressure is losing its previous influence, while demand is becoming more prominent. Should this character remain intact, the next meaningful expansion could carry Vodafone toward the projected 131 region.
The broader backdrop may also be shaped by telecommunications-sector sentiment, subscriber trends, competitive conditions, regulatory developments, financing costs, and wider equity-market behavior. These elements can affect the pace of appreciation, but the present chart structure remains oriented toward higher levels.
The anticipated progression is:
Current positioning → strengthening demand → upward extension → 131 objective.
📍 Bias: Bullish
📈 Direction: Buy
🚀 Momentum: Improving upside participation
🎯 Target: 131
⚡ Structure: Bullish continuation
The chart is gradually shifting the balance toward the buyers, with 131 remaining the principal upside destination for this setup.  Long
Long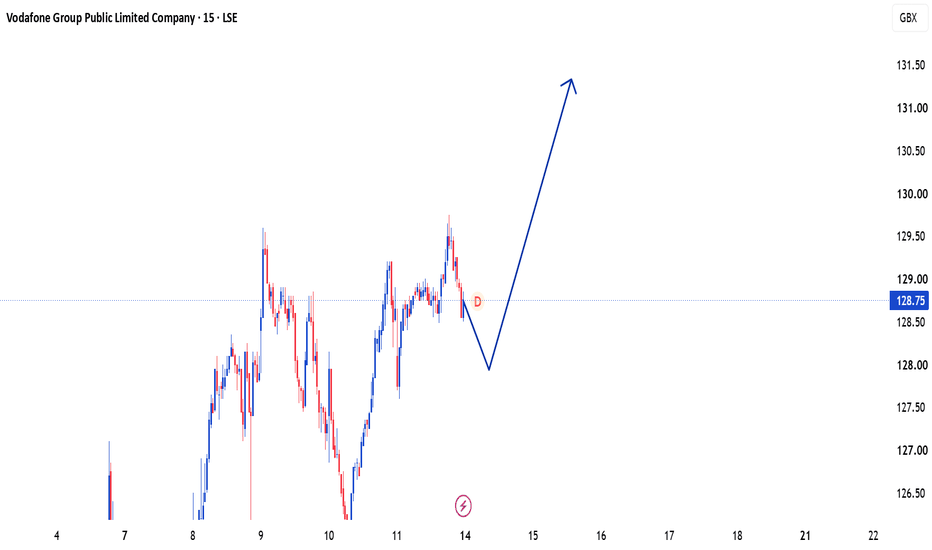
British American Tobacco — Downside Path Toward 3920British American Tobacco is currently developing a bearish setup, with the recent price behavior indicating that the stock remains vulnerable to additional weakness. The prevailing market tone is tilted toward the selling side, while upward attempts appear unable to establish a convincing reversal.
The technical picture points toward a continuation of the downward sequence, with 3920 emerging as the principal objective on the chart. As the current formation unfolds, further depreciation could take place before the market reaches this projected level.
Price action is presently reflecting a lack of sustained upside traction. The inability to regain stronger territory leaves the door open for another extension lower, particularly while bearish participation remains evident. Rather than treating the decline as a short-lived fluctuation, the structure suggests that sellers may continue pressing the valuation downward.
The broader environment can also influence British American Tobacco through consumer-sector sentiment, currency movements, regulatory developments, commodity costs, company-specific news, and changes in international equity conditions. Such factors may affect volatility and timing, while the chart continues to provide a clear downside framework.
The projected sequence is:
Current weakness → continued pressure from sellers → deeper retracement → 3920 target zone.
📍 Market Bias: Bearish
📉 Trade Direction: Selling
⚡ Price Structure: Downward
🔥 Momentum: Seller-led
🎯 Projected Objective: 3920
The market has established a vulnerable formation, and 3920 remains the key downside destination as British American Tobacco continues to face pressure from the selling side.  Short
Short
 Long
Long
Barclays — Sellers Driving the Next Leg Toward 472Barclays is currently showing a weak market structure, with the price action favoring the downside and the selling side maintaining control. The latest movement reflects increasing bearish pressure, suggesting that the stock could continue its decline toward the 472 target area.
The present formation indicates that upside attempts are struggling to generate enough strength to reverse the prevailing direction. Instead, each phase of the price action is keeping the broader trajectory tilted lower, creating the possibility of another downward extension.
From a technical standpoint, the 472 region is the key level in focus. A continuation of the existing bearish pattern could gradually push the stock through lower price levels as sellers maintain their influence. The setup therefore remains oriented toward capturing the next leg of weakness rather than anticipating an immediate recovery.
Market sentiment surrounding financial institutions, interest-rate expectations, economic conditions, credit activity, and broader equity performance can also affect Barclays' volatility. These external factors may alter the speed of the move, but the current chart formation continues to favor a negative trajectory.
The projected sequence is:
Current bearish structure → continued downside pressure → lower price development → 472 objective.
📍 Bias: Bearish
📉 Direction: Sell
🔥 Seller Control: Strong
🎯 Target: 472
⚡ Structure: Downside continuation
The chart is currently leaning decisively toward the lower side, with 472 remaining the major projected destination as Barclays continues to face selling pressure.  Short
Short
SHOP | Weekly Bullish, Daily Flip Zone DecidesBy analyzing the #SHOP (Shopify) chart, we can see a market where the weekly has already made its decision and the daily is deciding when.
1W Timeframe
Weekly chart:
The recovery from the 2022 lows was built internally — an i CHoCH , then repeated i BOS . In 2025 price broke the external swing high and printed a real CHoCH above CAD 220 . Internal breaks say a correction is progressing. An external break says the trend has changed hands.
Two protected lows frame the risk: CAD 33.26 external, CAD 99.87 internal — the working invalidation. Between them sits the weekly Order Block at CAD 123.03 – CAD 136.88 , which price returned into, reacted from, and rallied out of. That reaction is why the case is live.
Above, the resting liquidity at CAD 252.59 is the objective. Price is at CAD 178.41 — a correction inside an intact uptrend.
1D Timeframe
Daily chart:
Price ran out of the weekly block, printed a daily CHoCH , swept CAD 252.59 , and rolled over. It has now arrived at the Daily flip zone (CAD 155.69 – CAD 185.95) — resistance through July and August, support now — trading in the upper third of it.
The weekly says the direction. The daily says when.
The Bias
Bullish while price holds above CAD 99.87.
Scenario A. The flip zone holds and price continues toward CAD 252.59 . I want confirmation on the daily close first — an MSS from inside the zone, or a decisive bullish engulfing. A touch of the top edge is not a reaction.
Scenario B. Price works toward CAD 155.69 before turning. Same trade, better price.
Scenario C. A close beneath CAD 155.69 puts the weekly Order Block back in play as the deeper entry — not an invalidation.
Invalidation: a decisive close beneath CAD 99.87 .
And the rule: a break is a candle close, not a wick.
Fundamental Backdrop
Q2 2026 revenue of $3.58 billion , up 34% year over year, net income up 66%, margin expanding to 42%. AI-referred orders nearly 13x higher with conversion around 50% above organic search. Bernstein initiated at Outperform, Piper Sandler raised to $180, consensus near $171.
The counterweight: the stock fell nearly 8% in one session in early September on rotation out of high-multiple growth names — despite those earnings. P/E near 87 , down roughly 21% year to date.
A company compounding revenue in the thirties, repriced for multiple rather than performance. That is what produces a retracement this deep into structure — and why the confirmation matters more than the level.
This analysis will be updated as the market evolves.
Best Regards, BigBeluga 🐳  Long
Long