ABCD Pattern appearing with Higher Targets!FATIMA Analysis
CMP 147.67 (18-09-2026 10:45am)
ABCD Pattern appearing.
Targeting around 235 - 240.
Currently Near Trendline Support around 145 - 147.
Upside it has immediate resistance around 152,
crossing it may hit around 160 - 165.
It should not break Point C (around 120) else
we may witness some selling pressure.
Risk @ 15925 Reward @ 32645• Strategy Execution: We provide trade calls based on trendline setups.
• Lot Size: The calls given are based on standard F&O lot sizes.
• Stop-Loss Execution: Strictly follow the stop-loss levels.
• 15-Minute Candle Close: Consider the stop-loss triggered only after a 15-minute candle closes beyond the level.
• Position Sizing: Limit exposure to a maximum of two open positions at a time.
• Important Note: Do not risk more than 2% of your capital per trade.
NBIS: Bearish Weekly Cycle In ProgressThis is a pick from a follower.
NBIS: Monthly TF Still In Bullish Cycle. Uptrend Direction structure
Weekly TF is in Bearish Cycle and will stay bearish until 1st or 2nd week of Oct. Downtrend
Daily TF Is also in Bearish Cycle. Downtrend
4hrs TF is in Bullish Cycle. Uptrend
As we can clearly see on the Daily TF is telling us that the Monthly has been in a uptrend direction since April 2025 and The Weekly started its Downtrend Direction on the 2nd week of June 2026, so knowing where the weekly is heading and when it started its Bearish Cycle we can estimate that still has like 2 to 4 weeks to the down side and with that info we can trade the Daily and the 4hrs TFs.
Now moving to the Daily TF we can see that entered in a sideways move (orange shared area) and we can see it clearly on the 4hrs TF.
NBIS is doing a nice job on its Weekly TF meaning that Bulls had the power of controlling the damage that bears can do .
How would I trade NBIS very simple enter near the bottom of the orange shared area and exit near the top for as long as the sideways move remains active and the Weekly remains Bearish.
The Weekly target (green shaded area), will be on the table for as long as the Weekly stays bearish
For long term Bulls to have the most probabilities on your side wait until the weekly changes to Bullish Cycle and that will take place around the 2nd week of Oct.
Play it right.................Play it safe........................Play it The Numberfive Way.
Boost....................Follow.................Share...............Comment.
TEAM: Not Quite Dead After AllWhat Has Happened?
Since our last update, Atlassian shares have seen a noticeable pullback, which the stock used to gather fresh momentum to the upside. While the bullish momentum has eased somewhat in the meantime, our primary expectation remains for further gains.
Primary Scenario
In our primary scenario, we see TEAM in a sustained bullish trend, with the stock expected to continue advancing step by step as part of the ongoing upward impulse. The next top should form within our red target zone (coordinates: $245.85–$270.05), after which we expect a noticeable corrective move to the downside.
Alternative Scenario
In our alternative scenario, TEAM would already be further advanced within the ongoing upward impulse and would imminently break below the support level at $159 without first forming a top within our red target zone (coordinates: $245.85–$270.05). However, while still clearly above the lower $80 level, the stock would then turn back to the upside and resume its advance (probability: 33%).
Broader Outlook
The daily chart confirms our view that Atlassian remains in a broader uptrend, which should continue to unfold in stages and eventually extend above the resistance level at $483.13, taking the stock to new all-time highs.
RISK 13125 REWARD 26600• Strategy Execution: We provide trade calls based on trendline setups.
• Lot Size: The calls given are based on standard F&O lot sizes.
• Stop-Loss Execution: Strictly follow the stop-loss levels.
• 15-Minute Candle Close: Consider the stop-loss triggered only after a 15-minute candle closes beyond the level.
• Position Sizing: Limit exposure to a maximum of two open positions at a time.
• Important Note: Do not risk more than 2% of your capital per trade.
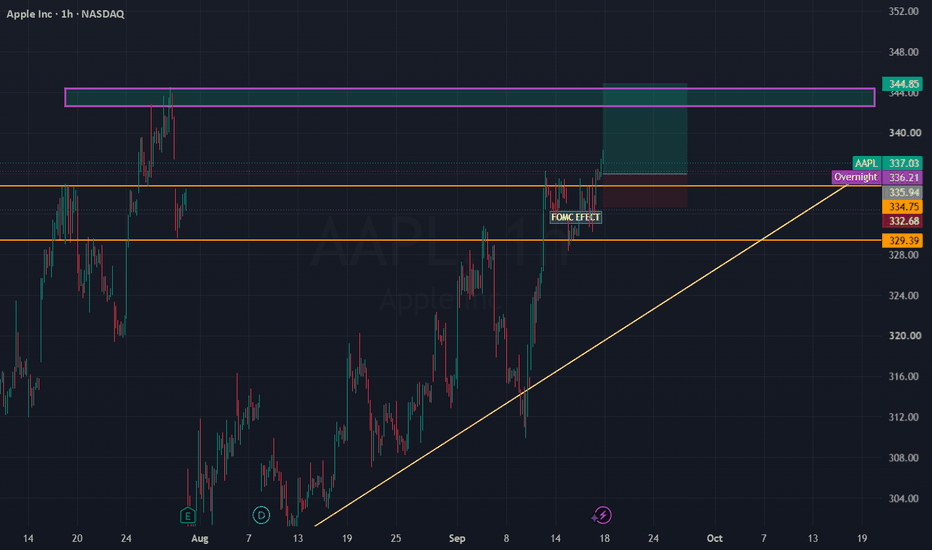
AAPL After FOMC: From 334.96 Flush to Clean BreakoutAfter the September 16 FOMC decision, AAPL showed one of the cleaner reactions among the major names.
Why it dropped
The Fed hiked 25 bp to the 3.75–4.00% range and the tone was hawkish. Higher yields and a stronger dollar hit growth stocks hard. AAPL sold from the $334.96 area down to $329.39 as liquidity swept the recent lows.
Why it’s rising again
Once the market digested that this wasn’t the start of a heavy multi-hike cycle and the economy still looks resilient, risk appetite returned. AAPL consolidated above the $329–330 zone, then pushed higher and broke back through $334.96 — flipping the old resistance into support.
The setup
Long on the break and hold of $334.96
• Entry: market or a shallow pullback toward $335.95
• Stop: $332.44
• Target: next key level $343.77
As a day trader currently in the Bitget KCGI competition, these zones are enough for me. When liquidity is available I don’t force size NASDAQ:AAPL I wait for the high-probability structure that actually delivers the R:R I’m looking for. And I always make sure the exchange fills the planned stop and target cleanly.
Having Stocks, CFDs, and Crypto on one platform with deep liquidity on U.S. Stock Perps makes it easier to execute cleanly around major U.S. market events like this FOMC reaction without jumping between venues.
Simple levels, clear invalidation, measured target.
NSE Visa Chrome Stock May Hit 28, 20 & 10 Levels?📉 NSE:VISACHROME is showing a potentially important Elliott Wave setup on the hourly chart.
The larger structure suggests that Primary Wave W is still developing , with Intermediate (A) and (B) appearing to be in place and Intermediate (C) now developing. Within Wave (C), the chart is showing a possible Minor Wave 3 , with Minute Wave iii developing .
🛡️ Strong Support: 28.60
The 28 area is particularly important because it is close to the 61.8% Fib level .
If the bearish Wave (C) structure continues to develop as expected, the deeper 20 area becomes another important reference zone.
🔻 Larger Wave (C) projection: 100% zigzag measurement around 9.97
🎯 Targets:
Target: 28
Target: 20
Target: 10 → potential larger Wave (C) completion level
What do you think? 👇
Will Visa Chrome hold around 28–28.60, or could Wave (C) continue toward the deeper levels shown on the chart?
AMD looks like a pretty good long continuation next month or twoNASDAQ:AMD I see it break all time high's once it does gonna go much higher, even possibly 700-800$ but then would become overbought to me.. Gotta wait and see. But firstly I 90% see it head back to 583$ the all time high's.
Then i'm 85% sure that It will break and hold all time high's and then rocket up from 583$ break and make between 20-40% upside. About a 700-800$ price target, 1000$ round number is possible, but would be crazy overbought if goes there, could mark the top and also massive psychological level... So I don't wanna see anyone fomo long's at 1k... Wait for a confirmation break of atleast 2-3 days above 1000$ to buy with a stop loss at 950$.
ONE POINT SOLUTIONS## One Point One Solutions Ltd. (CMP ₹59.14, NSE: ONEPOINT)
**The SmartWay Research Desk | 18 September 2026**
A Navi Mumbai‑based **Business Process Management (BPM) and IT services company**, incorporated in 2006. One Point One Solutions provides **customer lifecycle management, collections, technical support, and digital transformation services** to clients in BFSI, telecom, e‑commerce, and healthcare sectors.
**Promoter Holding (Jun 2026):** **Ravi Kedia & Family — ~74.8% stake (no pledges)**
---
### FY22–FY26 Snapshot
- **Revenue Growth:** FY26 revenue ₹642 Cr vs ₹562 Cr in FY25 (+14.2% YoY). → **Good**
- **Net Profit:** FY26 PAT ₹62 Cr vs ₹52 Cr in FY25 (+19.2% YoY). → **Good**
- **Operating Margin:** FY26 EBITDA ₹122 Cr, margin 19.0% vs 18.3% last year (+70 bps). → **Good**
- **Equity Capital:** Stable, face value ₹2. → **Good**
- **Dividend Policy:** Dividend ₹0.50/share declared for FY26. → **Neutral/Good**
- **Asset Building:** Investments in **AI‑driven customer support and digital platforms**. → **Good**
- **Sales:** Strong demand from **BFSI and telecom outsourcing contracts**. → **Good**
- **Expense:** Employee and infra costs remain elevated. → **Neutral/Good**
- **EPS:** FY26 EPS ₹2.25 vs ₹1.90 last year (+18.4%). → **Good**
---
### Institutional Interest & Ownership Trends (Jun 2026)
- **Promoter Holding:** ~74.8% (no pledges)
- **FII Holding:** ~1.2%
- **DII Holding:** ~2.6%
- **Retail & Others:** ~21.4%
---
### Strategic Moves & Innovations
- Expansion in **AI‑enabled BPM and analytics services**.
- Focus on **digital transformation for BFSI and healthcare clients**.
- Partnerships with **global IT firms for technology integration**.
- Diversification into **collections, technical support, and e‑commerce solutions**.
---
### Cash Flow & Balance Sheet Strength
- Market cap ~₹420 Cr.
- Debt‑to‑equity ratio ~0.36 (moderate leverage).
- Book value per share ₹22.00; P/B ~2.7.
- EPS (TTM) ₹2.25; P/E ~26.3.
---
### Risk Factors
- Moderate‑high **P/E ratio ~26.3**, valuations slightly expensive.
- Dependence on **outsourcing contracts and client retention**.
- Exposure to **employee attrition and wage inflation**.
- Competition from Firstsource Solutions, Hinduja Global, and Datamatics.
---
### Investor Takeaway
One Point One Solutions has delivered **steady FY26 performance**, supported by BPM growth, AI‑driven services, and BFSI outsourcing demand. With strong promoter backing (Kedia Family, 74.8% stake), dividend payouts, and niche positioning in customer lifecycle management, the company remains a **small‑cap IT & BPM play**. At CMP ₹59.14, valuations are **moderately expensive (P/E ~26.3, P/B ~2.7)**, reflecting growth expectations with manageable risks.
MVST | WeeklyNASDAQ:MVST — HIEQ Model
Quan-Analysis | Reaching the Market Depth
MVST is one of the high-potential projections I’ve designed into the HIEQ Model. The final decline may now have completed, with a 45%📉 decline identified by HIEQ-Structure φ , pausing precisely at the Sup Trend E-line Δ of the Trend Ray χΔ.
The Primary-degree Wave ⓶ corrective phase, representing an approximately 92% decline, may have concluded at $0.5613—very close to the defined HPQ Target ➤ $0.5555 🎯, although the target itself was not touched.
I’ll wait for the weekly close before providing the projected paths of the Primary Impulsive Trend ⓷ on the TS Map.
#StrategicAnalysis #TrendAnalysis #CymaticTrendflow #FutureVision #TimeSpaceMap
Value Trap or Opportunity ?
I initiated a position in this company back in Dec 2019 and for the next two years or so, we did capture the peak at 85.50.
However, I continue to hold on to TODAY and now my position is in the RED!
Balance Sheet wise, this company is still strong and while it has closed many outlets in China, it is also aggressively rolling out new initiatives like the one person hotpot concept which is well received in China. It has also moved from a self managed chain to a franchise model, increasing its scalability (though I am somehow sceptical about the timing ???)
I am equally concerned about its future ability to pay 8% dividends as the domestic spending patterns in China is still subdued and confidence remains low. Property market (after 5 long years is still not out of the woods, CCP is still stubbornly not dishing out sufficient stimulus to prop the market), job market remains weak with many graduates unable to find job continuously.
So, I have little choice but to hang out to my bloody red position for now and monitor the macrotrends and study if Haidilao will be able to turnaround the business in the near future.
LALPATHLAB set up for a break out swing trade LALPATHLAB set up for flag break out on daily.
Bullish engulfing daily candle on September 17.
On weekly chart SMA20 above SMA30 which is above SMA40.
Price near 52 week high
Risk to reward at 1: 3
SL: 1815
Target : 2250
Exit trade on: SL or Target or after 3 months time stop.
QCOM: Bull Run Appears Over – Major Support BrokenAfter reaching a high of 258, QCOM appears to have completed its bullish cycle. The stock failed to print a new higher high and has now broken below the key 190 support, shifting the long-term technical outlook to bearish.
Key Technical Observations:
📉 Failure to make a new high after the peak at 258, indicating weakening bullish momentum and strong bearish sentiments, since the fall is supported by huge volume.
🔻 Breakdown below the major 190 support confirms a bearish change in market structure.
🎯 A classical Inverse Head & Shoulders Top (head-and-shoulders reversal pattern) projects a measured downside target near 121.
🛑 Intermediate support is expected around the 160-165 area, where a temporary bounce or consolidation could occur.
Unless buyers reclaim key resistance, rallies are likely to be corrective rather than the start of a new uptrend.
Bullish Invalidation
This bearish outlook would be invalidated by a strong daily close above 233, which would suggest the breakdown was a false move and put the bulls back in control.
Until then, the path of least resistance remains to the downside.
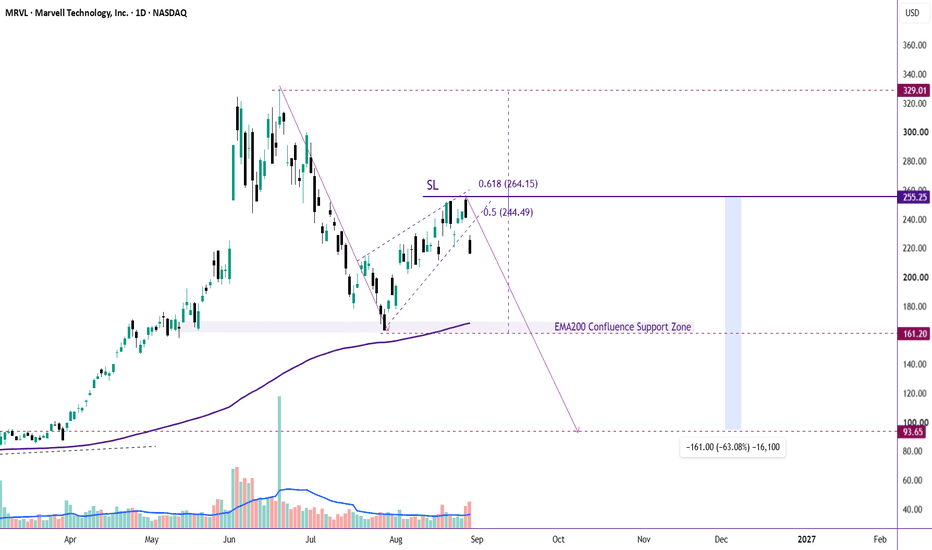
MRVL: Rising Wedge Breakdown Suggests Further Downside📉 Price has broken down decisively from a rising wedge while trading inside the 0.5 - 0.618 Golden Pocket retracement zone, and that too with strong volume, increasing the probability of a deeper correction.
🎯 Bearish Points:
📉 Golden Pocket: $244 - $264
📉 Rising Wedge Breakdown
📉 Supported by huge volume
✅ Targets:
🎯 First major support/ Target: $160 - $167
📊 Extended Bearish Scenario
⚠️ Break below $160-$167 opens the door for a move toward sub-$100 levels
📉 That would represent a decline of more than 60% from the recent swing high around 255
❌ Bearish Invalidation
Strong daily/weekly reclaim above $255. A breakout back into the wedge structure would weaken the current bearish outlook
👀 For now, all eyes are on the $160-$167 EMA200 confluence zone. How price reacts there will likely determine whether this becomes a normal pullback or the start of a much larger correction.
ADBE - Reversal Strategy Long Setup
🍀Overview
I am not a discretionary technical analyst, so I rely on predefined setups rather than subjective chart analysis. I built the rules into a strategy to make the decision-making process more systematic.
This setup occurred before the strategy was developed. The trade is documented retrospectively and will be followed until the strategy exits or a discretionary exit is executed according to predefined rules.
🍀Process
Ticker : NASDAQ:ADBE
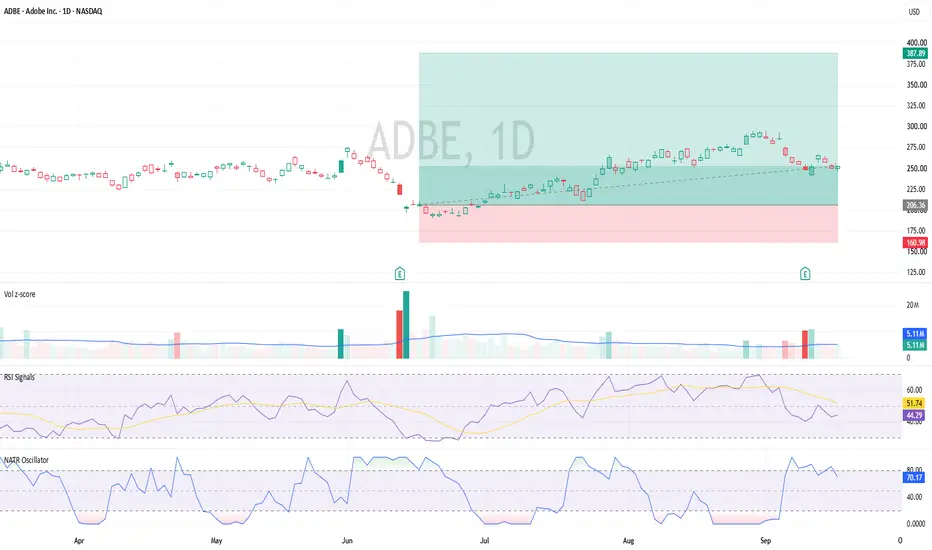
Date : 15/06/2026
Timeframe : Daily
Direction : Long
Strategy : Reversal Strategy
Strategy Overview : Overview: A Reversal Strategy for Trading on the Daily Timeframe
Strategy Chart : Please refer to the 2nd screenshot
Signals
Main signal: RSI Signals crossed above 30, indicating an exit from the oversold zone. This contributed a score of 0.5
Confirmation signal: NATR Oscillator reached 90.31, exceeding the required threshold of 80. This contributed a score of 0.5
Signal Scoring
Main signal score = 0.5
Confirmation signal score = 0.5
Long setup score = Main signal score + Confirmation signal score = 0.5 + 0.5 = 1.0
Long score threshold: 1.0
The long setup score met the required threshold. The strategy therefore placed a long bracket order.
Risk Management
Reward-to-risk ratio: 4:1
Entry: 206.36 (the close of the setup candle)
Stop distance: 45.38 (approximately 4x daily ATR)
Target distance: 181.53 (approximately 16x daily ATR)
Order Management : Bracket order
Limit entry: 206.36
Market stop: 160.98
Limit target: 387.89
Baseline
Assume the worst has already happened: the stop loss has been reached.
🍀Outcome
Trade Execution
15/06/2026: The daily candle closed, triggering the strategy to place a long bracket order.
16/06/2026: Price reached the trigger level, and the long entry filled.
Trade Status
Trading: active
P.S. I’m currently applying this strategy to the Nasdaq-100. Let me know which stock you’d like me to look at next.
Stay lucky!🍀
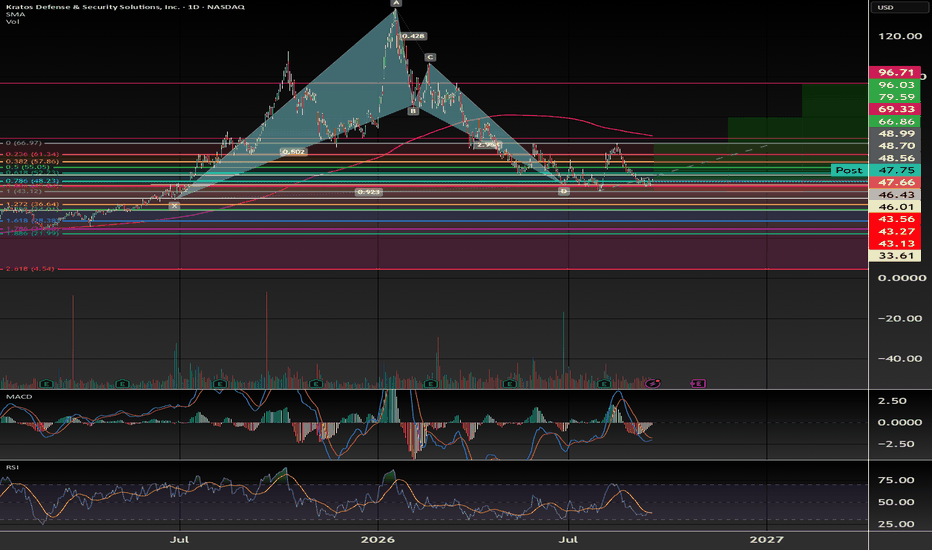
$KTOS BullishNASDAQ:KTOS is currently at a important level that goes back to August 2004. At current Price it's showing HIDDEN bullish divergence at the .886 retrace. Also, it's just about to enter into positive momo if they coming days playout as imagined. I think theres a strong case for it and if you combine it with the Fundamentals of this company. This company is very profitable and I heard they are doing something with the Ukraine's Military
Also shown on this is the MEGA BAT Pattern that has formed and currently holding it as support.