$MU: Another Swing Profit — What’s Next Before Q4 Earnings?In my NASDAQ:MU analysis last week, I mentioned:
“On the 4H timeframe, NASDAQ:MU has broken out of a triangle structure with strong volume, followed by the formation of a bullish H4 Order Block at $940–920.”
After the market opened this week, NASDAQ:MU pulled back into the bullish H4 OB and reacted strongly, delivering another ~6% swing profit. 📈
🔘 My Current Plan
I’m holding my position and waiting for price to break above the 0.5 level of the trading range — the $1,000 area.
As mentioned last week, if price pulls back toward the $850 area (fib 0.618-0.66),
I’ll continue scaling into the position.
🔘 A Different Perspective
Today, I want to look at NASDAQ:MU from a different angle: earnings-driven price action.
Q2 FY2026 — March 18, 2026
$415 → $800
Q3 FY2026 — June 24, 2026
$965 → $1,255
Q4 FY2026 — September 30, 2026, after market close
$900 → ?
The next earnings report could become another major catalyst for $MU.
Micron has officially scheduled its Q4 FY2026 earnings release for September 30, 2026, with the earnings call following after the U.S. market close.
I’m also currently participating in the KCGI Trading Competition.
Since I started sharing my NASDAQ:MU swing-trading plan on TradingView back in July, the strategy has already delivered five swing-trade profits.
Hopefully, this next swing can help me put up another strong result in the competition. 🚀
Structure first. Earnings next. Price action will tell us the rest.  Long
Long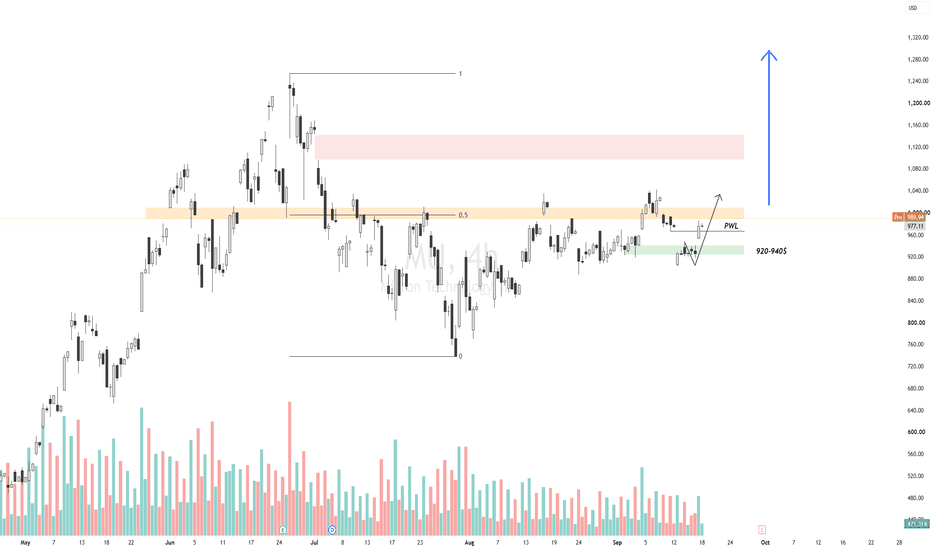
 Long
Long
PLTR: Rebound Toward $180 | A Defined Plan for $189 and $202Palantir is attempting to recover after pulling back from the $185–$188 area. On the daily chart, price has rebounded from the mid-$160s and is now trading around the $176.24 reference level.
The next test is the $180 area. A sustained move above it would strengthen the recovery scenario and bring the recent highs back into focus. Until then, this remains a rebound within the recent trading range.
Key levels and trade framework
- Reference entry: $176.24.
- Initial stop: $163.11, approximately 7.45% below the reference entry.
- First target: $189.37, approximately +7.45%.
- Second target: $202.50, approximately +14.90%.
These targets come from the risk-management plan displayed on the chart; they are not both established resistance levels.
Bullish scenario
Holding the recent rebound structure and reclaiming $180 would support a move toward the $185–$189 area. A convincing breakout above that zone would then open the possibility of an extension toward $202.50.
Risk management
The plan splits profit-taking equally between the two targets. This represents approximately 1R at TP1 and 2R at TP2, or a blended 1.5R if both are reached, before execution costs and slippage.
The chart also marks $195.94 as a profit-protection trigger for the remaining position. Reaching that level would be a point to reassess protection rather than assume the final target is guaranteed.
Invalidation
Failure to reclaim $180 would leave the recovery vulnerable to another pullback. A return below the recent lows would weaken the setup, while $163.11 defines the planned stop level.
My bias is cautiously bullish, with confirmation still needed above $180. The priority is to respect the predefined risk and let price confirm the next leg.
Can PLTR reclaim $180 and challenge $189, or will sellers reject this rebound?
For educational purposes only. This is a conditional trading scenario, not a recommendation to buy or sell.
Laurent - Private Investor
✅ DL INVEST | Community Leader
 Long
Long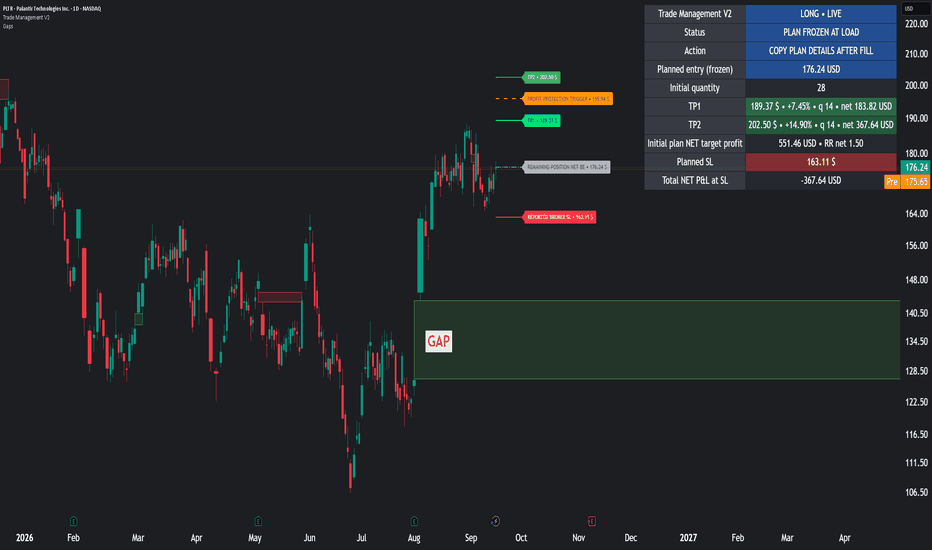
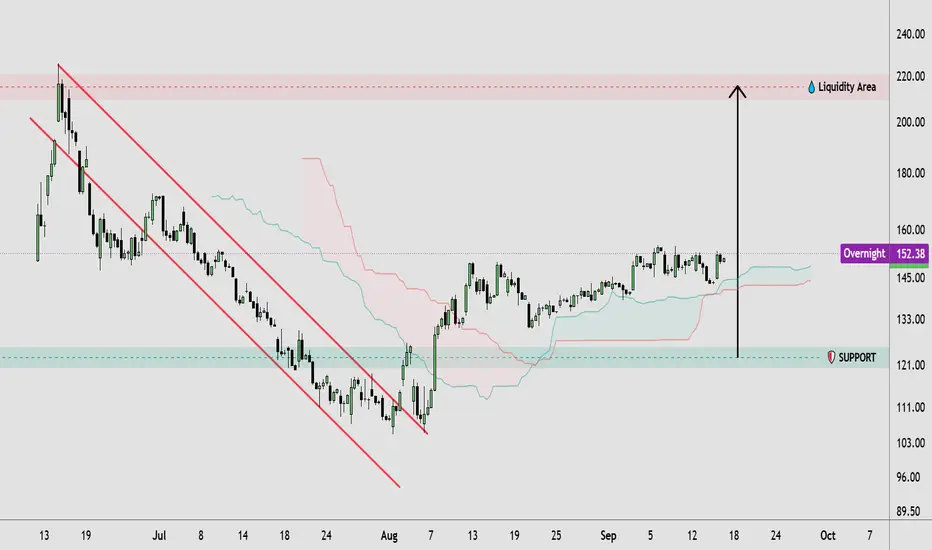
SPCX: Breakout Structure & Liquidity Target🔹 SPCX price action shows a recovery from the previous descending structure, with price breaking above the falling trendline and developing a series of higher lows. The market has since entered a consolidation phase around the 145–155 area, while the 121–125 region remains a key support zone. Above the current structure, the 215–220 area is highlighted as a major liquidity region and potential resistance.
🔸 If SPCX maintains its structure above the highlighted support, price could continue developing toward higher resistance and the overhead liquidity area, particularly if a breakout above recent highs is confirmed. Traders may wait for price confirmation before considering any trade. If the key support zone fails, the bullish structure could weaken and price might revisit lower levels before establishing a new direction. This technical analysis focuses on SPCX price action, market structure, breakout, support, resistance, and liquidity.
This analysis is for educational purposes only and does not constitute financial or investment advice. Always conduct your own research before making trading decisions.  Long
Long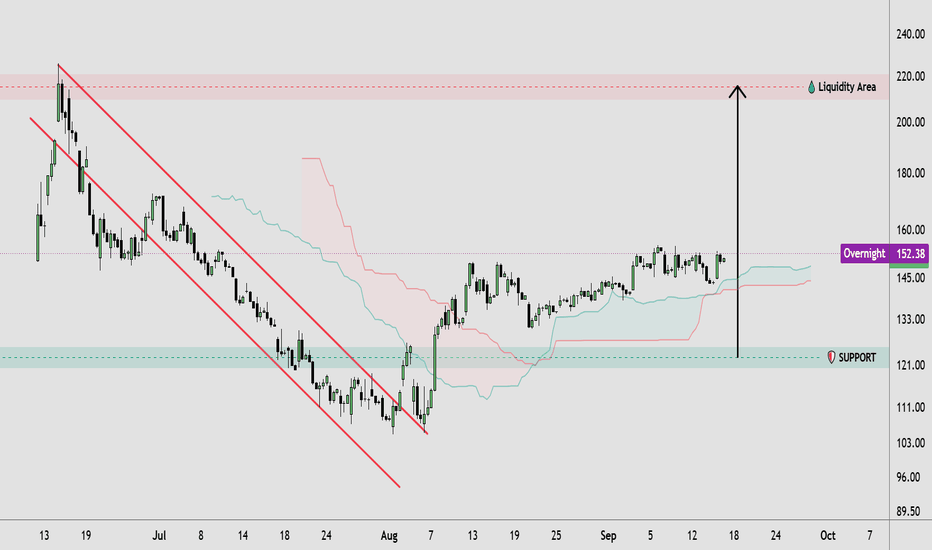
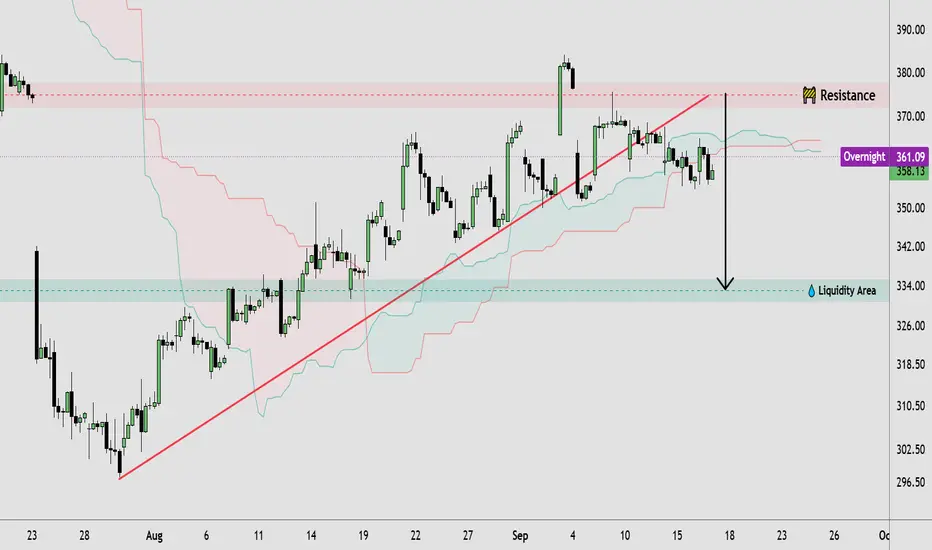
TSLA | Resistance Rejection & Liquidity Retest🔹 TSLA price action shows a broader upward market structure, with higher highs and higher lows developing from the August low. Price has recently consolidated beneath the highlighted resistance zone around 373–377, following a rejection from the 380+ area. The rising trendline continues to support the structure, while the current consolidation suggests a period of balance before the next directional move. The nearby liquidity area around 333–335 remains an important downside reference if selling pressure increases.
🔸 If TSLA breaks and holds above the resistance zone, the price structure could support further bullish continuation, particularly if the breakout is confirmed through sustained price action. Alternatively, rejection from resistance could lead to a deeper pullback toward lower support and the highlighted liquidity area. Traders may wait for clear price confirmation before considering any trade, while a decisive failure of the rising structure could shift attention toward the downside liquidity zone. This technical analysis focuses on price action, market structure, resistance, support, breakout, and liquidity.
This analysis is for educational purposes only and does not constitute financial or investment advice. Always conduct your own research before making trading decisions  Short
Short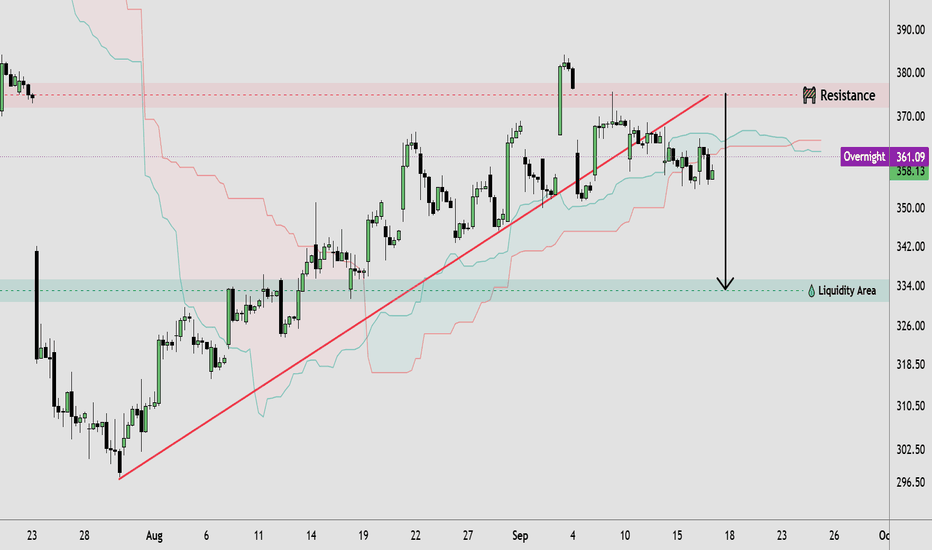
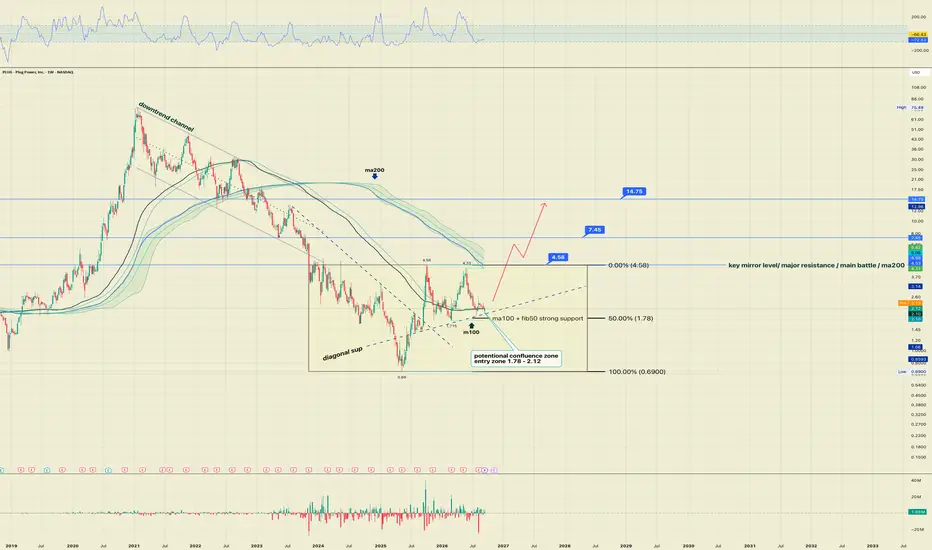
PLUG: Multi-year bottom is in. The end of the three-year dramaPLUG has been under heavy selling pressure for a long time. Following a multi-year protracted decline, a key structural shift occurred in November 2023 when the price broke below the lower boundary of the global downtrend channel. This breakdown was a major manipulation designed to shake out weak hands and capture short liquidity, triggering a final wave of capitulation where the market hammered out an absolute macro bottom at $0.69 . This flush out completely reset the old bearish cycle and launched a massive reversal base, where smart money has been systematically absorbing market supply via limit orders from late 2023 to the present day $PLUG.
This multi-year base forms a complex accumulation structure. The ascending dotted line (diagonal sup) has proven its absolute validity, acting as the primary dynamic axis holding the entire chart geometry together. Currently, the price is compressed within a local confluence zone of $1.78–$2.12. This is the most critical battleground for buyers to defend their positions, as it marks the intersection of the 50.00% Fibonacci retracement level ($1.78), the heavy 100-week moving average (ma100), and the dynamic support line. The $1.78–$2.12 area is the primary zone where the market must show a strong bullish reaction if the long-term base scenario is to remain valid. Crucially, this is not a guaranteed bottom. If the price closes the week below $1.55, the base structure will be compromised, the limit barrier broken, and the bullish thesis completely invalidated. A major headwind to keep in mind is the fundamental context — the company's high cash burn rate, which keeps Wall Street consensus conservative with intermediate targets set around $3.50–$5.00.
Overhead lies the absolute ultimate technical barrier of the macro structure — the key mirror resistance level at $4.58, which aligns with the heavy 200-week moving average (MA200). This is the "main battle" and the upper boundary of the multi-year base. As long as the price remains below it, the stock continues to trade within the global accumulation phase. A clean breakout and confirmation above $4.58 will fundamentally shift the technical landscape on a macro scale. Piercing through this heavy supply wall will trigger a massive short squeeze, confirm an official exit from the accumulation base, and unleash three years of coiled energy, clearing the path toward structural targets at $7.45 and a long-term macro target of $14.75.
This publication is for analytical purposes only and does not constitute individual investment advice. Technical levels are scenarios, not guarantees of price movement.  Long
Long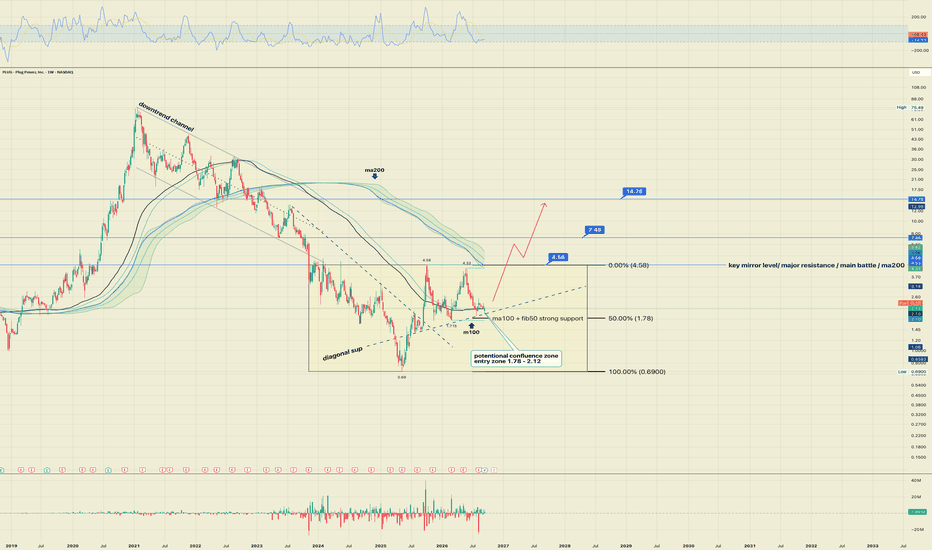
Salesforce Raises Guidance and Launches $25 Billion Buyback Salesforce Raises Guidance and Launches $25 Billion Buyback to Calm the Market
By Ion Jauregui – ActivTrades Analyst
Salesforce (NYSE:CRM) decided to use its Investor Day, held this Wednesday as part of Dreamforce in San Francisco, to send a clear signal of confidence to a market that had been questioning the company's growth pace for months. The firm raised its revenue guidance for fiscal year 2027 to a range of $46.1 billion to $46.4 billion, a year-over-year increase of between 11% and 12%, and reaffirmed its target of $63 billion for 2030, above the average of $61.4 billion projected by the analyst consensus compiled by Bloomberg.
I believe this move is no coincidence. The company needed a catalyst that would turn the narrative back in its favor, and it found it on two fronts: the upward guidance and an accelerated share buyback of $25 billion, whose final settlement will be completed in October. Robin Washington, Chief Financial and Operating Officer, emphasized at the conference that the company has already repurchased a cumulative $60 billion in its own shares, although it's worth noting that this program was financed with debt: $25 billion in senior notes issued in March, which left the company with $33.3 billion in unsecured liabilities as of the close of July.
The real backbone of the story remains Agentforce. Its annual recurring revenue already exceeded $1.5 billion, with growth of more than 240% year-over-year, and when combined with Data 360, the figure is around $3.9 billion.
On the technical side, the stock closed yesterday at $243.18. The point of control (POC) is located around $185.49, within the prior price zone, which leaves the stock trading well above that historical volume reference. Moving average crossovers point to an uptrend and a trend change, with the increase in value sustained since the bullish gap opened on Thursday, August 27, which for now appears to be holding without being filled. The RSI stands at 56.87%, after having gone through a period of elevated overbought conditions, indicating that momentum has cooled into a more neutral-to-bullish zone. However, the RSI is trading above the histogram in an incremental downward trend, a divergence worth watching: the price is rising, but the underlying momentum is progressively losing strength.
Currently, the price is moving within the range prior to the yearly lows of $147.55, hit in June, placing the stock in a technical rebuilding zone following that bottom. In my view, as long as the August gap support holds, the short-term bias remains constructive, although the bearish momentum divergence calls for caution before chasing the move without additional confirmation.
*******************************************************************************************
The information provided does not constitute investment research. The material has not been prepared in accordance with the legal requirements designed to promote the independence of investment research and such should be considered a marketing communication.
All information has been prepared by ActivTrades ("AT"). The information does not contain a record of AT's prices, or an offer of or solicitation for a transaction in any financial instrument. No representation or warranty is given as to the accuracy or completeness of this information.
Any material provided does not have regard to the specific investment objective and financial situation of any person who may receive it. Past performance and forecasting are not a synonym of a reliable indicator of future performance. AT provides an execution-only service. Consequently, any person acting on the information provided does so at their own risk. Political risk is unpredictable. Central bank actions can vary. Platform tools do not guarantee success.
 Long
Long
 Long
Long
 Long
Long
 Short
Short
 Long
Long
Long 
 Long
Long
 Long
Long
 Long
Long
HUL- 20 & 50 EMA Bearish Crossover After 20 Years Fresh Supply Zone: ₹2,100–₹2,239 — fresh monthly supply zone and key resistance on any pullback.
🔹₹2,000 psychological & historical support, which held since 2022, has been decisively breached on the monthly chart.
🔹EMA: 20 & 50 EMA bearish crossover confirmed on 3 Aug 2026, on the monthly chart is a rare long-term signal. A similar bearish phase was seen around 2004, after which HUL witnessed a deep correction. Historical 2004 data confirm significant weakness in the stock during that period
🔹Demand Zone 1: Tested twice and weakened, increasing the possibility of further downside if breached.
🔹Demand Zone 2: ₹1,228–₹1,412 — Strong monthly demand/support zone. (50% correction)
🔹Demand Zone 3: ₹1,100–₹1,180 — Very strong long-term demand/support zone.
🔹Overall Trend: BEARISH
If the current bearish structure develops into a correction of 50–60% from the major top, it would not be surprising from a historical/technical perspective. However, this is a scenario, not a price prediction.
 Short
Short
How Long Does a Gap Take to Fill? 396 Gaps, MeasuredA gap on a chart is a claim that something got skipped. "It will fill" is a different claim, and it is the one worth measuring.
Someone says it under every gap on every chart: that will fill. It sounds like structure talking, and on this chart it is even true. Over the last 1,300 daily bars, Snowflake NYSE:SNOW left 396 gaps behind, and 380 of them were fully filled. That is ninety-six percent.
So the claim survives the hit rate. It does not survive the clock, and the gap between those two things is where most of the damage gets done.
--------------------------------------------------------------
1. What was measured, so you can repeat it
I used the plain three-bar definition and nothing else. A bullish gap exists when the low of the third bar sits above the high of the first. A bearish gap exists when the high of the third bar sits below the low of the first. The zone runs between those two prices, and it is created on the third bar. No size minimum, no trend filter, no session rules.
From there, two questions per gap. Touched means a later bar reached the near edge of the zone. Filled means a later bar reached the far edge, all the way through. Both are measured in trading bars from the day the gap was created, and both only look forward.
The sample is 1,300 daily bars on Snowflake, July 2021 to September 2026: 396 gaps, 205 of them bullish and 191 bearish. Anyone can rebuild this. That is the point of using the boring definition.
One note before the numbers. The layer drawn on the chart applies its own conditions on top of this definition, so the zones you can count on the chart will not match my totals exactly. That is deliberate. I ran the measurement on the plain definition so anyone can reproduce it without our tool, and where the two disagree, the arithmetic below is the definition talking, not the indicator.
--------------------------------------------------------------
2. The hit rate, which is why the claim feels true
390 of the 396 gaps were touched. That is 98.5 percent. 380 were filled through the far edge, 96.0 percent. Six were never touched at all.
If the analysis stopped there, the conclusion would write itself: on this chart, gaps fill. And every gap you have ever pointed at and called unfinished would look like a sound read.
Stopping there is the mistake. A hit rate tells you how often something happens. It says nothing about when, and when is the only part you have to live through.
--------------------------------------------------------------
3. The distribution, which is where the claim breaks
Of the 380 gaps that filled, this is how long they took:
1 to 5 bars: 208 gaps (54.7 percent)
6 to 20 bars: 79 gaps (20.8 percent)
21 to 60 bars: 31 gaps (8.2 percent)
61 to 250 bars: 51 gaps (13.4 percent)
more than 250 bars: 11 gaps (2.9 percent)
The median is four bars. More than half of all gaps on this chart were closed inside a week, and that is the whole reason the claim has such a good reputation. Nine out of ten filled inside 97 bars.
Then there is the tail, and the tail is not a rounding error. It is a different market.
The five slowest fills on this chart were all bearish gaps left on the way down from the late-2021 high:
345.90 to 349.79, created 29 December 2021, filled 3 September 2026 - 1,174 bars
330.51 to 331.18, created 4 January 2022, filled 7 August 2026 - 1,151 bars
282.48 to 285.50, created 22 February 2022, filled 29 July 2026 - 1,111 bars
234.00 to 261.31, created 3 March 2022, filled 27 October 2025 - 916 bars
224.42 to 250.58, created 4 March 2022, filled 8 October 2025 - 902 bars
Read the first line again. Somebody could have looked at that gap in the last days of 2021, said it will fill, and been right. The filling happened two weeks ago. Between the claim and the outcome sit four and a half years, an entire drawdown, and a recovery that had nothing to do with the reason the gap existed.
In the hit rate, that gap is one dot next to a gap that filled in three bars. They are the same statistic and they are not the same event.
And the tail has a direction. Of the eleven gaps that took more than 250 bars to fill, ten were bearish. Put the two groups side by side and the typical case is almost identical - bullish gaps filled in a median of four bars, bearish in five, and the ninetieth percentile is 95 bars against 96. The difference lives entirely in the disaster case: 5.3 percent of bearish gaps took more than a year of bars, against 0.5 percent of bullish ones, one single gap. Gaps left behind on the way up got closed by ordinary pullbacks. Gaps left behind on the way down waited for the market to change its mind about the company, and that is not something a pullback can do. Same definition, same chart, same median - and the thing you are exposed to when you are wrong is not the median.
--------------------------------------------------------------
4. The six that never filled, and what they mark
Six gaps in this sample were never touched, by the plain definition used here. The oldest is a bearish zone at 392.40 to 396.39, created 22 November 2021 , and in the 1,208 bars since then price has not come within eight dollars of its lower edge. The highest high after that date is 384.56. The stock closed today at 338.39.
That zone is not waiting. It is a record. It marks the two days when price left the area on the way down from a top it has not seen again, and the market has had five years to come back and has not.
The other five are younger and they show the censoring problem in the flesh. One sits at 110.81 to 113.06 from October 2024, open for 487 bars. Another sits at 140.63 to 144.48 from May 2026 and is 90 bars old, which is to say it has barely been given the chance to fill yet. Counting that one as evidence that gaps do not fill would be as careless as counting a three-bar fill as evidence that they always do.
This is the part worth keeping. An unfilled gap is usually not a pending event. It is usually the fingerprint of a repricing the market never took back. Micron NASDAQ:MU has a five-percent-wide zone at 50.02 to 52.73 that has stood untouched for 928 bars. Nvidia NASDAQ:NVDA has its oldest unfilled zones between 12.50 and 15.47, created in late 2022 and early 2023, and the market re-rated straight up through them without ever looking back down. In every one of those cases, the gap is not telling you where price is going. It is telling you where the old regime ended.
--------------------------------------------------------------
5. The honesty tax: three ways this number can be dressed up
Any statistic like this can be made to look better than it is, so here is how.
Count the noise and the fills look fast. On this chart the plain definition produced 396 gaps. Throw away every gap smaller than half a percent of price and 334 remain, which barely moves the story. On the S&P 500 ETF AMEX:SPY the same filter is brutal: 463 gaps become 226, half the sample gone, and the ninetieth percentile fill time nearly doubles from 45 bars to 78. The comforting version of "gaps fill fast" lives almost entirely inside gaps too small to trade.
The newest gaps have not had time to fail. 71 of these 396 gaps are less than 250 bars old, eighteen percent of the sample. A gap created three months ago has had a fraction of the chance to disappoint that one created three years ago has. Every fill-rate number on every chart is flattered by this, including mine.
The window decides the answer. This sample holds one large decline and one strong recovery. The 2025 and 2026 fills in that tail exist because the recovery happened. Run the same measurement ending in late 2022 and the same gaps are open, and the conclusion reverses. A fill rate is a statement about a path, not a property of gaps.
--------------------------------------------------------------
6. What a gap is actually worth as a read
It is a where, not a when. It marks an area price crossed too quickly for both sides to be present, and it stays on the chart until the market comes back for it. That is all it claims, and it is enough to be useful: it gives you a place to watch and a condition to review.
What it never gives you is a date. The layer we built for this, Structura Blocks, draws these zones and stretches each one to the right for as long as it stays untouched, so a zone's width is its age - and a wide one is not a stronger case, it is an older one. The tool will not tell you when. Nothing will. Half of them resolve inside a week, one in thirty takes more than a year, and the six that never resolve are the ones that turned out to matter most.
So the honest version of the sentence is longer than the sentence. Not "that gap will fill", but: on this chart, gaps like this one have filled about ninety-six percent of the time, usually within a week, occasionally after four years, and when one of them does not fill at all, it is generally because the market moved on and did not want the price back.
If you run this on your own charts, the number I would look at first is not the fill rate. It is the age of the oldest zone still open. How old is yours?  Education
 Long
Long
 Long
Long