## KALYAN JEWELLERS – 15-Minute Chart Analysis## KALYAN JEWELLERS – 15-Minute Chart Analysis
1. Kalyan Jewellers is in a **strong short-term uptrend**, supported by a series of higher highs and higher lows after a sharp breakout from the ₹380 zone.
2. Price is currently trading inside a **rising channel**, approaching the upper boundary near **₹550–₹555**, where resistance is likely to emerge.
3. The stock has rallied significantly in a short period, increasing the probability of **profit booking** from higher levels.
4. The upper trendline of the channel is acting as immediate resistance, and any rejection from this zone could trigger a healthy corrective phase.
5. As long as the price remains above the **lower channel support around ₹535–₹540**, the short-term bullish trend remains intact.
6. A decisive breakdown below the channel support would confirm the beginning of a correction, with the first downside target near **₹510–₹515**.
7. If selling pressure intensifies, the correction could extend toward the **₹485–₹490** zone, where stronger buying interest may reappear.
8. On the bullish side, a sustained close above **₹555** would invalidate the immediate correction scenario and could extend the rally toward **₹565–₹570**.
9. Traders should closely monitor price action near the **₹550–₹555 resistance zone**, as rejection from this area would support the corrective outlook shown on the chart.
10. **Overall Outlook: Neutral to Moderately Bearish (7/10)** with the expected path: **₹548 → ₹555 (Resistance) → ₹515 → ₹485 → ₹460**, while **₹555** remains the key breakout and invalidation level.
---
### Disclaimer
> **Disclaimer:** This analysis is based on technical indicators, price action, chart patterns, trendline analysis, and the current market structure. It is intended **solely for educational and informational purposes** and **should not be considered financial or investment advice**. Financial markets are inherently volatile, and no technical analysis can guarantee future price movements. Please conduct your own research and consult a qualified financial advisor before making any investment or trading decisions.
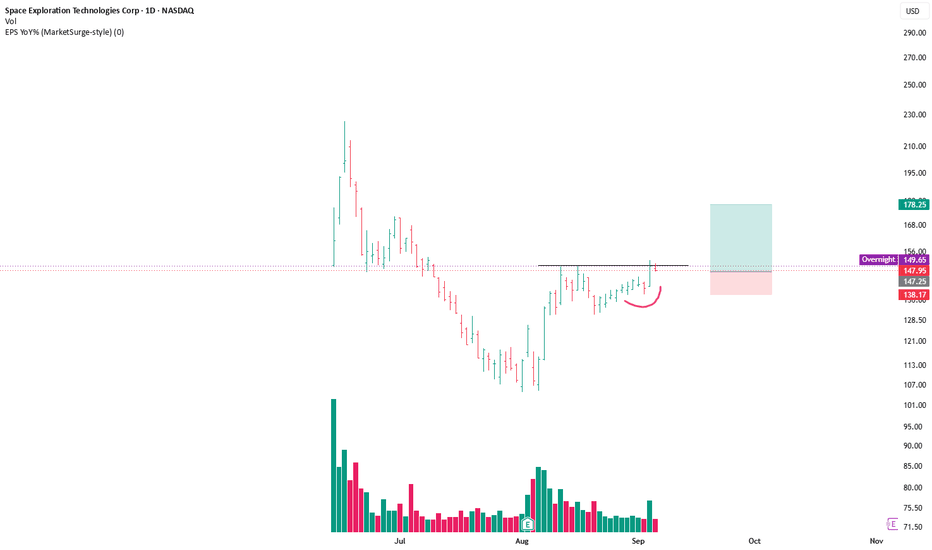
SpaceX: More Pain Ahead, or the Traditional IPO Trajectory?
SPCX is down 2.2% today to $136, sitting below its $150 IPO opening price and giving back the entire post-listing rally that took it to an all-time high of $225 just weeks ago. Price failed to reclaim the $160-180 midrange and has broken the stock's opening-low zone, with the next visible support levels sitting at $125 and then $100.
This isn't unusual for a mega-IPO , it's structural. Only around 5% of SpaceX's shares are currently floating. The rest unlock in stages: 20% after Q2 earnings (late July/August), 7% employee tranches every couple weeks through October, and a larger 28% release after Q3 earnings. Every one of those dates is a real supply event, and markets tend to price some of that pressure in before it even hits.
Palantir and Rocket Lab both ran the same script after their own debuts ; an early hype spike, a brutal multi-month drawdown as lockups and valuation reality collided, then a real base before any sustained move higher. The first chart rarely tells you where a stock actually settles.
Levels to watch: holding above $125 keeps this a normal post-IPO cooldown. A break below opens $100 as the next liquidity pool. Reclaiming $150+ would be the first real sign buyers are stepping back in.
Follow for updates , hope you liked today’s analysis
BULL | Continued stock growth- Timeframe: Weekly
- Trade type: Buy stop order
- Price: 7.53
- Take Profit: Open
- Stop Loss: 6.94 (-7.90 %)
Idea: Long on a breakout above last week's high - bullish momentum continuation.
Entry: Buy stop above last week’s high.
Stop-loss: Below the low of the same candle.
If the weekly candle closes below this level, the trade is invalidated.
Take Profit: Trailing stop following the lows of new weekly candles.
SNPS | Continued stock growth- Timeframe: Weekly
- Trade type: Buy stop order
- Price: 479.80
- Take Profit: Open
- Stop Loss: 438.55 (-8.60 %)
Idea: Long on a breakout above last week's high - bullish momentum continuation.
Entry: Buy stop above last week’s high.
Stop-loss: Below the low of the same candle.
If the weekly candle closes below this level, the trade is invalidated.
Take Profit: Trailing stop following the lows of new weekly candles.
PRCL - GOOD fundamental / low risk / uptrend, longterm PRCL - Timeframe: 1 Week
Prices rose and closed higher at 15.45 on a weekly basis as of December 7, 2025.
15.45 is a historical price level.
This occurred after prices formed a higher bottom, signaling renewed buyer interest.
Currently, prices are retesting the broken top (15.45) to assess buyer strength.
The current price is 15.80, which presents a favorable opportunity to open a long position.
Stop loss: 13.70 (last weekly bottom).
Potential targets: 20 and 26, among others.
We'll observe developments in the coming weeks.
Disclaimer: This is not investment advice, only my analysis based on chart data.
Consult your account manager before making any investments.
Thank you, and good luck.
NFLX Bearish Wedge Breakdown Setup | 1H Analysis.Netflix (NFLX) is trading within a contracting wedge while facing repeated rejection from the highlighted resistance zone. The lower highs and weakening bullish momentum suggest sellers remain in control.
A confirmed break below the wedge support could trigger a continuation of the bearish move toward the projected support levels.
Key Levels:
* 🔴 Resistance: 74.80 – 75.80
* 🟦 1st Support: 70.00
* 🟦 2nd Support: 66.00
* 📉 Bias: Bearish while below resistance.
Aston Martin Lagonda ($AML) Daily: Key Support at 35.40Aston Martin Lagonda ( LSE:AML ) Daily: Key Support at 35.40 Holds the Key – Mapping a 21.56 Breakdown vs. 50.45 Rebound
### 🇬🇧 Aston Martin Lagonda Global Holdings Plc ( LSE:AML ) Daily Technical Outlook (Ref: AML_2026-07-15_08-51-00.png)
We are releasing a high-priority structural framework for Aston Martin Lagonda ( LSE:AML ) on the Daily (1D) interval. The equity is currently trading at a critical macro inflection point, compressing aggressively into a tight corner between a multi-month Descending Trendline (red LTB) and a historical horizontal demand shelf.
The stock is experiencing a minor relief bounce today, trading up **+3.08% at 37.46**, but the broader structural framework remains highly defensive.
---
### 🔍 The Dual-Tactical Roadmap: Boundary Breakdown vs. Range Rebound
Our systematic model isolates two distinct structural pathways based on how price action interacts with the immediate demand floor:
#### 🐻 Bearish Breakdown Path: Target 21.56
* **The Setup:** The primary defensive anchor is located at the **35.40 support baseline** (marked by our horizontal red support line at 35.72).
* **The Target:** A decisive daily candle close below this key support level will confirm structural breakdown. This trigger will unlock a major downside expansion leg, projected via the 1.0 Fibonacci extension node targeting the **21.56 – 21.60** discount zone.
#### 🐂 Bullish Rebound Path: Target 50.45
* **The Setup:** If buyers successfully absorb supply and defend the **35.40** floor, we anticipate a localized counter-trend accumulation phase.
* **The Target:** A validated bounce off this floor will trigger a mean-reversion rally, targeting the premium resistance ceiling locked at the **50.45** horizontal red line.
* *Note:* This upside target heavily confluences with the descending red LTB and sits just below the declining institutional **200-period EMA (purple line at 53.19)**, which will act as a major distribution wall.
---
### 📊 Tactical Framework Summary:
* **Immediate Bias:** Neutral-Bearish (Awaiting Boundary Resolution)
* **Key Support Pivot:** 35.40 (35.72 Horizon)
* **Breakdown Target (Fibonacci 100%):** 21.56
* **Rebound Resistance Target:** 50.45
* **Dynamic Resistance Ribbon:** 72-period SMA (orange line at 42.15)
---
📊 **ChartPro Data**
*Equity Architecture, Boundary Squeezes & Systematic Range Expansion Models.*
⚠️ **Disclaimer:** For educational and informational purposes only. This technical study represents a personal trading model and does not constitute financial or investment advice.
NAK: Macro ABC Correction Setup Points to Major Downside TargetLooking at the overarching structure of Northern Dynasty Minerals (NAK), it is becoming difficult to ignore the dominant macro ABC bearish corrective sequence playing out. The multi-year descending trendline originating from the structure's highest point has acted as perfect overhead resistance, capping the rally attempt precisely at point B. As long as this crucial pivot point holds, the technical bias remains overwhelmingly skewed toward the downside, aligning perfectly with a high-stakes fundamental environment. The company's entire valuation hinges on the Pebble Project, and with oral arguments in the federal lawsuit to overturn the EPA's veto concluded on June 25, 2026, the case is officially ripe for a decision. A final ruling against the company would demolish the fundamental thesis and trigger the technical completion of this pattern.
Zooming into the daily price action, the internal rally that formed the "BC" leg was captured within a clear consolidation range before collapsing back through the key breaker block. The failure to reclaim this breaker block as support and the subsequent breakdown below it signal that intermediate buying pressure is completely exhausted, giving way to heavy distribution. This technical weakness mirrors the underlying financial strain; as a pre-revenue exploration company, NAK’s April 2026 annual filings included a critical "going concern" warning from its auditors. Sustaining this massive litigation is incredibly expensive, and without operational cash flow, any prolonged delay in the court's ruling will likely force aggressive share dilution, putting further organic downward pressure on the stock.
This combination of technical rejection and fundamental fragility sets the stage for a dramatic trend-completion leg down to target C. The Department of Justice's active defense of the EPA's veto earlier this year has already demonstrated the market’s extreme sensitivity to adverse regulatory news, previously triggering a massive single-day plunge. If the federal district court rules against the company in the near term, there is virtually no fundamental safety net to prevent a complete capitulation. The chart is signaling a full downward flush toward the projected target, marking the ultimate technical and fundamental resolution of this multi-year saga.
TEDS Swing Trading Analysis | AU Bank 1H long setup | 14 July 26TEDS Swing Trading Analysis | Every Recovery Is Not an Entry
One of the most common trading mistakes is assuming that every price bounce marks the beginning of a new trend.
The TEDS (Trend Exhaustion Detection System) is designed to help traders avoid impulsive decisions by waiting for structured confirmation before planning a trade.
Chart Observation
🔹 After the recent decline, the framework entered a Long Queue, signalling that the market required observation rather than an immediate buy.
🔹 Once the confirmation conditions aligned, TEDS generated a Buy Signal and established a predefined Entry Zone for a structured trading plan.
🔹 Before any trade is considered, the framework also defines the Stop Loss Area and the first Target Level, ensuring that both risk and reward are planned before execution.
A disciplined trading process should always answer these questions:
• Has the market confirmed the recovery?
• Is my entry based on predefined rules rather than hope?
• Is the downside risk clearly defined before entering?
• Do I have a complete trading plan before placing the order?
The objective is not to catch every market move. The objective is to develop the patience to wait for high-quality opportunities supported by a repeatable process.
Trade with a Framework. Not with Emotions.
Disclaimer: This chart is shared for educational purposes only to explain a structured trading framework and market behaviour. It is not investment advice or a recommendation to buy or sell any security. Please conduct your own analysis and apply appropriate risk management before making any trading decisions.
PayPal's $53B Buyout: A Global Fintech AwakeningStripe and Advent International just disrupted the financial world. They offered over $53 billion to acquire PayPal. This bold proposal values PayPal at $60.50 per share. It represents a massive 28% premium over recent market closures. Macroeconomic indicators frame this historic bid. High inflation and shifting interest rates squeeze legacy payment processors. Despite the premium, Goldman Sachs maintains a cautious outlook. They recently raised their price target for PayPal to $48. However, Goldman keeps a "Sell" rating. Markets demand profitability and resilience. This proposed mega-merger highlights rapid consolidation in global economics. Private equity and agile fintechs now dictate market momentum.
Geopolitics and Geostrategy
Global financial infrastructure is a prime geopolitical battleground. A Stripe-PayPal merger would create an undisputed Western payments titan. This geostrategic move counters the dominance of Asian networks like Alipay. Regulators across multiple continents will scrutinize this $53 billion transaction. Anti-monopoly laws will test international alliances. Cross-border capital flows determine national security parameters. Controlling this vast transaction network grants immense geopolitical leverage. Governments rely on digital payment arteries to enforce economic sanctions. Thus, this buyout carries severe strategic implications for global financial sovereignty.
Industry Trends and Business Models
The digital payments sector faces rapid evolution. Industry trends heavily favor embedded finance and unified commerce platforms. PayPal struggles against younger, more agile competitors. The proposed business model involves Stripe and Advent sharing equal ownership. This 50/50 split blends private equity capital with aggressive fintech innovation. It transforms traditional transaction fee models. The new entity would dominate both online checkout and backend merchant acquiring. Diversified revenue streams now mandate cryptocurrency integration and dynamic checkout experiences. Stagnant business models will perish in this hyper-competitive ecosystem.
Management, Leadership, and Company Culture
PayPal’s management faces a defining leadership crisis. New executives must navigate a fierce turnaround strategy. They must evaluate this $53 billion lifeline objectively. Rejecting the offer requires flawless execution of internal cost-saving plans. Accepting it demands a massive cultural shift. Company culture at PayPal must pivot toward rapid innovation. Stripe’s aggressive, builder-centric ethos contrasts sharply with PayPal’s legacy corporate structure. True leadership requires making ruthless decisions under immense Wall Street pressure. The boardroom must prioritize long-term survival over short-term pride.
Technology, High-Tech, and Cybersecurity
A combined Stripe-PayPal entity would control immense technological power. High-tech integration demands flawless execution. The companies must merge distinct cloud infrastructures and API architectures. Cybersecurity remains the paramount concern. Processing trillions of dollars attracts sophisticated state-sponsored hackers. The unified network must deploy zero-trust security frameworks. Advanced artificial intelligence will detect fraud anomalies instantly. Machine learning algorithms optimize transaction approval rates. Superior technology dictates market share in modern finance. This merger would set a new global benchmark for financial cybersecurity.
Science, Patent Analysis, and Pharmaceutical Industry
Digital finance increasingly intersects with hard science. Patent analysis reveals intense competition over cryptographic tokenization. These distinct patents build the foundation for future commerce. The pharmaceutical industry directly benefits from these payment innovations. Secure, instant cross-border transactions streamline global drug supply chains. Pharmaceutical companies manage complex intellectual property purchases utilizing encrypted payment rails. Furthermore, advanced data analytics trace sensitive medical transactions securely. This synergy between high-tech finance and life sciences accelerates global healthcare delivery.
BEN - Resistance Break and 50 SMA Support Retest💡 Swing setup idea
50 SMA support retest
🔎 Analysis summary:
The stock broke above resistance and came back to retest the 50 SMA as support. Buyers are also starting to step in, which keeps this setup constructive.
👀 Levels to watch:
Entry trigger: Break above $32.35
Target: $34.92
Stop: Under the support / 50 SMA
💬 What do you think about this setup? Let me know in the comments! 👇
Good luck!
⚠️ Note: This is for educational purposes only and is not financial advice.
$KMB - Darvas Box Consolidation & 50 SMA Breakout on High Volume💡 Swing setup idea
Bullish breakout
🔎 Analysis summary:
The stock is consolidating and forming a Darvas box pattern. It successfully crossed the 50 SMA with high volume, showing strong relative strength while the broader market is trending down.
🔔 Friendly reminder: The S&P 500 is currently trending down, so please keep the broader market weakness in mind before entering any new trades.
👀 Levels to watch:
Entry trigger: Break above $100.82
Target: $109.44
Stop: Break back into the box
💬 What do you think of this setup? Let me know in the comments! 👇
Good luck!
⚠️ Note: This is for educational purposes only and is not financial advice.
Will Bosch Ltd (BOSCHLTD) Reverse from this Level?Analyzing the current trend for Bosch Limited. The price is approaching a significant reversal zone. Check out my technical outlook on the daily chart. #BOSCH #Investing #StockMarketIndia #TradingIdeas #NIFTY
Technical analysis of Bosch Limited (NSE: BOSCHLTD). Identifying a key supply/reversal area on the daily timeframe. Is a pullback coming? Watch these levels closely for potential price action confirmation. #StockMarket #TechnicalAnalysis #BOSCHLTD #TradingView #StockAnalysis
Al Rajhi Bank: Facing Liquidity and Regional HeadwindsDespite reporting solid Q1 2026 results, with a 14% growth in net profit, several systemic and macroeconomic risk factors could exert pressure on the stock in the medium term. Prolonged instability linked to the Iranian conflict represents a material risk for the entire Saudi banking sector. If the conflict were to escalate, Fitch warns that asset quality, profitability, and bank liquidity could contract, forcing an increase in provisions for credit losses (impairment charges). The sector is facing a contraction in liquidity conditions, with loan-to-deposit ratios hitting record levels across the board. In a stress scenario, Al Rajhi Bank's liquidity position could be tested: estimates indicate that the liquidity coverage on deposits for Al Rajhi, Riyad Bank, and Bank Albilad could fall to critical levels (10% or less) in the event of significant outflows. Growing competition for deposit gathering is driving up the cost of funding. If interest rates remain "higher for longer," banks with a high reliance on certificates of deposit or subject to greater domestic competition would see their net interest margins (NIM) compressed. The massive adoption of fintech, instant payments, and digital banking in Saudi Arabia is "compressing" risk timelines. The need to constantly update Anti-Money Laundering (AML) frameworks and cybersecurity in a rapidly evolving environment entails increasing operational investments which, over time, could weigh on the cost-to-income ratio. Despite the positive Q1 2026 results, shares have shown immediate signs of weakness on the stock exchange, reflecting growing "market caution" rather than simple fundamental weakness. When a stock reacts negatively to positive news, it often signals that the market has already priced in optimistic growth scenarios, making the asset vulnerable to potential corrections should future expectations not be met.
$NVDA, LongNVDA is a leader of SPX and NDX holding ~8% and ~12% of respective indices.
NVDA had a failed head and shoulder breakdown. After breaking above the polarity zone, the price sustained 5 consecutive closes above this level creating a bullish momentum.
Possible inverted SHS formation can also been seen. See green ellipticals.
The depth of neckline to head is ~ about 22.5.
AVWAP~ 210
Today, the market closed above the neck line, 212.6.
Now above the neck line, the price may swing high to 230.
Credit: Rachel Dashiell from Schwab.
The Banking Giants Are Back in Record TerritoryThe biggest U.S banks have kicked off earnings season with another impressive quarter. Strong trading activity, a rebound in investment banking, and resilient consumer spending pushed results above expectations, even as inflation, geopolitical tensions, and pressure on lending margins continue to create uncertainty beneath the surface
Banks generate revenue through two primary sources
💵 Net Interest Income (NII): This is the spread between the interest banks earn on loans such as mortgages and the interest they pay on customer deposits. Since it's the largest income source for most banks, changes in interest rates have a major impact on profitability
👔 Noninterest Income: This comes from fee based and market related businesses, including trading, investment banking, advisory services, payment processing, and account fees. Banks with a larger share of noninterest income are generally less exposed to swings in interest rates
Key themes from Q2 FY26
💰Record breaking quarter: America's largest banks outperformed expectations despite geopolitical tensions, including the Iran conflict, and persistent inflation. Trading operations were the biggest driver, delivering exceptional results. JPMorgan CEO Jamie Dimon even remarked that conditions are "getting close to as good as it gets"
🎰 Trading and investment banking steal the show: Volatile markets turned into a major opportunity. Equity trading desks posted outstanding results, with JPMorgan's equities revenue soaring 86% year over year. Meanwhile, a revival in mergers, acquisitions, and capital markets highlighted by the SpaceX IPO helped investment banking achieve its strongest quarter since 2021
🏦A widening gap in lending profits: While capital markets flourished, traditional banking painted a mixed picture. JPMorgan increased its full-year Net Interest Income outlook, but Bank of America, Citigroup, and Wells Fargo all faced pressure on net interest margins as deposit costs remained elevated. The era of effortless NII growth has faded, creating clear winners and losers.
💵 Shareholders continue to benefit: Strong earnings translated into generous capital returns. JPMorgan approved a new $50 billion share repurchase program alongside a 10% dividend increase. Wells Fargo bought back roughly $7 billion of stock during the first half of the year and raised its dividend by 11%, while Citigroup and Bank of America also continued returning significant capital. Healthy balance sheets are giving banks confidence to reward investors
🛢️Temporary relief on inflation:June CPI eased to 3.5% year over year, largely because gasoline prices fell 9.7% following the Iran ceasefire and the reopening of the Strait of Hormuz. However, that relief appears short-lived. After the ceasefire broke down on July 8, oil prices began climbing again, suggesting inflation could reaccelerate in July
📉 The consumer remains resilient but unevenly: Credit and debit card spending increased 9% year over year at both Bank of America and Wells Fargo, while loan-loss provisions came in below expectations, indicating consumers are still spending and keeping up with payments. However, executives continue to warn that lower-income households face increasing financial strain, reinforcing the growing divide between wealthier consumers and everyone else
🌋Warning signs remain: Despite delivering record profits, bank executives stressed that significant risks are still building. Jamie Dimon warned that geopolitical tensions, persistent inflation, widening fiscal deficits, and elevated asset valuations are "shifting below the surface like tectonic plates." Wells Fargo CEO Charlie Scharf added that today's favorable environment "does not go on forever."
America's largest banks delivered another record quarter, fueled by booming trading activity and a rebound in investment banking while continuing to return substantial capital to shareholders. Yet beneath the strong headline numbers, pressure on lending margins and persistent macroeconomic risks suggest the outlook remains far from risk free