Do Not Miss Out on XPENGNYSE:XPEV
XPENG - AI, Autonomy, And A Channel Within A Channel. Three Entry Scenarios.
XPENG is one of the most compelling stories in the EV space right now and it goes well beyond electric cars. Q2 2026 revenue came in at $2.91 billion, up 51.5% quarter-over-quarter, with gross margins expanding to 20.7%, up 3.4 percentage points year-over-year. The cash position stands at $5.97 billion. Its Volkswagen partnership, one of the largest Western automakers in the world choosing XPENG's technology as the foundation for its next-generation vehicles in China, is one of the strongest third-party validations a Chinese EV company has received. Add proprietary chip development, an autonomous driving platform that is genuinely competing with the best in the world, a humanoid robotics division already valued at over $6 billion, and analyst consensus implying 86% upside from current levels, this is not just an EV play. It is a physical AI company wearing an EV badge.
The Setup
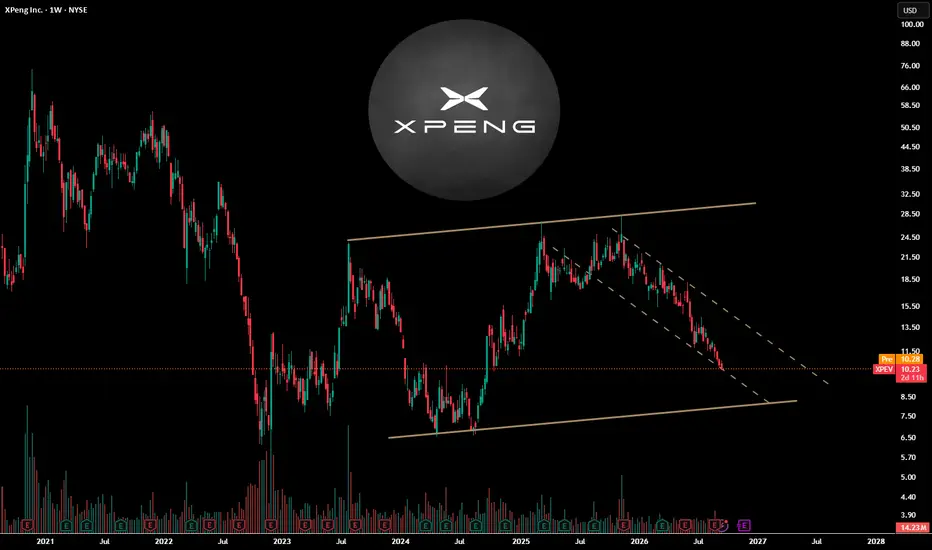
Up until 2024 XPENG was locked in a sustained downtrend. That downtrend was broken, a significant structural shift. Since the breakout, the stock has been operating within a well-defined ascending channel, with resistance tested three times and support tested three times. The structure has been respected consistently.
After testing channel resistance in November 2025, price entered a corrective descending channel within the larger uptrend, a consolidation phase heading toward the ascending channel support.
We have three potential entry scenarios, all confirmed, none anticipated:
Scenario 1 - A weekly close above the descending channel resistance. The corrective structure resolves to the upside and the next leg of the larger channel begins.
Scenario 2 - A confirmed bounce from the ascending channel support. Price reaches the lower boundary of the larger channel, buyers step in, and the structure holds.
Scenario 3 - If channel support fails, a retest of the Horizontal Support all time low is likely
We are not in a position yet. We are watching all three levels. The chart tells us when.
Keep posted for any updates.
 Long
Long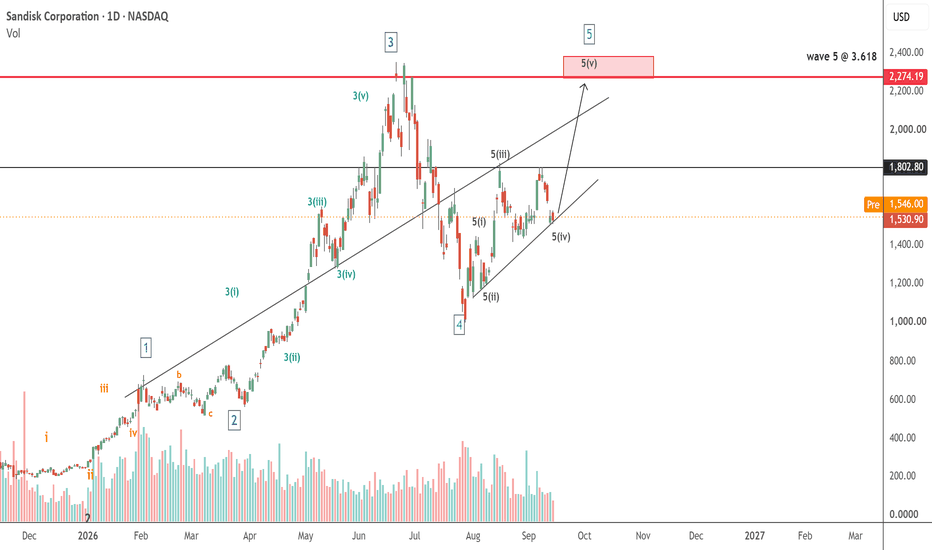
 Long
Long
 Long
Long
 Long
Long
 Long
Long
Will SNDK go down to $1,450 GEX magnet level this week?SNDK is currently trading near $1,531, while this week’s gamma-exposure snapshot shows the largest negative GEX concentration at the $1,450 strike, with estimated net GEX of approximately -$22.1 million.
That places the $1,450 level roughly 5% below the current price.
The main question is whether $1,450 could attract price as expiration approaches—or whether the negative gamma surrounding this strike makes it more likely to behave as an acceleration and volatility zone.
Negative gamma should not automatically be interpreted as support or a guaranteed price magnet. In a negative-gamma environment, dealer hedging may reinforce the direction of the underlying move. If SNDK weakens and breaks below the nearby $1,500 area, hedging flows could potentially contribute to a faster move toward $1,450.
Possible scenarios:
• Above $1,500: Price remains separated from the largest negative-GEX concentration, reducing the immediate probability of a $1,450 test.
• Below $1,500: The distance to $1,450 narrows, making the large GEX concentration increasingly relevant.
• Near $1,450: Watch whether price stabilizes, rejects the level, or accelerates through it. The reaction may be more useful than assuming the strike will automatically provide support.
GEX levels are estimates based on options positioning and assumptions about dealer exposure. They can change as contracts are opened, closed, or approach expiration. For that reason, the $1,450 level is best treated as a potential reaction zone—not a guaranteed target.
For traders who incorporate GEX into their process:
1. Would $1,450 be classified as a magnet or an acceleration level?
2. Is a break below $1,500 necessary before considering $1,450 relevant?
3. How often do large negative-GEX strikes attract price compared with positive-GEX strikes?
4. What confirmation—volume, implied volatility, price action, or time to expiration—is most useful?
This analysis is educational and does not constitute financial advice.
 Short
Short
 Short
Short
 Long
Long
 Long
Long
Intel's Bold Rebirth: AI, Chips and Global PowerIntel faces a pivotal transformation in 2026. Global tech demands force radical shifts in silicon manufacturing. Artificial intelligence drives unprecedented semiconductor growth. Intel must adapt to survive. The global economy relies on robust supply chains. Macroeconomic pressures squeeze legacy hardware producers. Memory prices have risen sharply, with SK Group Chairman Chey Tae-won describing them as abnormally high and calling for supply expansion. Data centers devour available global silicon output. This creates immense economic friction. Intel seeks dominance in this new paradigm. The company pivots increasingly from monolithic processors to agile chiplets. This strategic shift redefines global high-tech industries.
Geopolitics and Geostrategy
Semiconductors dictate modern geopolitical leverage. The US government aggressively secures domestic supply chains, and last year took a 10% equity stake in Intel itself. Commerce Secretary Howard Lutnick has publicly pressed foreign memory giants to build locally, telling an audience at Micron's New York fab in July that he wants to bring Samsung Electronics and SK Hynix to the United States to build production facilities. Intel broke ground on its New Albany, Ohio campus in 2022 with an initial $28 billion commitment and a longer-term vision approaching $100 billion across as many as eight fabs. After missing its original 2025 target, Intel pushed first production to 2030 or 2031, five to six years later than planned. The site remains strategic, designed to support 14A and future nodes. Korea JoongAng Daily reported in July that SK Hynix was in talks to acquire the campus. SK Hynix firmly denied these specific buyout claims in a Korea Exchange filing. However, Semafor subsequently reported early-stage discussions about an operational partnership, so strategic collaboration remains viable. SK Hynix is testing integration of its HBM with Intel's EMIB-based 2.5D packaging technology, and Samsung and Micron are assessing EMIB as well, reflecting memory makers' push to diversify away from tight TSMC CoWoS supply. Intel leverages government support aggressively. Geostrategy now revolves around localized silicon independence.
Business Models and Economics
Intel embraces a radically new business model. The company separates its foundry operations from chip design. This bold move attracts external clients, and Intel has onboarded marquee customers including Apple and SpaceX under chief executive Lip-Bu Tan. High capital expenditures challenge traditional profit margins. Building advanced fabs costs tens of billions. Intel Foundry lost $10.3 billion in 2025 on $17.8 billion of revenue, followed by a further $2.4 billion loss in the first quarter of 2026. The Arizona Fab 52 has begun mass production of 18A nodes. Intel pushes the Ohio facility launch to 2030. Joint investment programs spread massive financial risks. Brookfield partnered with Intel for Arizona expansions. Intel monetizes its advanced packaging capabilities effectively. Supplying ecosystem partners diversifies revenue streams.
Company Culture and Leadership
Management prioritizes pragmatic adaptability over rigid tradition. Decades of monolithic CPU dominance fostered complacency. Chief executive Lip-Bu Tan, appointed in 2025, ruthlessly targets high-growth AI sectors. The corporate culture now emphasizes rapid iteration. Teams race to bridge previous technological gaps. Intel acknowledges its late entry into AI hardware. Leaders implement an aggressive recovery strategy that has included large-scale layoffs and capital expenditure cuts. This requires immense organizational resilience. Managers foster diverse industry collaboration initiatives, and Intel hired Lee Seok-hee, SK Hynix's former chief executive, in June to help run its packaging business. Intel builds partnerships rather than fighting isolationist battles. This cultural evolution ensures long-term survival.
Technology, High Tech and Innovation
Innovation centers on heterogeneous compute architectures. Intel moves steadily away from traditional monolithic chip designs. Advanced packaging technology connects specialized silicon chiplets. Engineers optimize hardware specifically for large language models. New chips feature efficient SoftMax calculations for transformers. Speculative kernel execution accelerates chiplet GPU performance. Early exit mechanisms speed up neural inference. Sparse neural network inference reduces required computational power. Hardware compression of sparse matrices eliminates wasted operations. These innovations make AI deployments significantly cheaper.
Cybersecurity and Patent Analysis
Intel's patent portfolio reveals clear strategic priorities. Advanced packaging dominates recent filings, consistent with the company's chiplet and EMIB strategy. AI accelerator filings surged during 2025. Cybersecurity remains a foundational pillar for enterprise clients. The portfolio shows a deliberate security evolution. Intel transitioned from client-side secure enclaves. The focus shifted to cloud-scale confidential computing. Trust Domain Extensions now secure shared cloud environments. Hardware encryption protects critical AI matrix accelerators.
Science and The Pharmaceutical Industry
Intel silicon supports breakthroughs in modern medical science. The Intel Pharma Analytics Platform, developed with contract research organization ICON under an agreement first announced in 2018, captures sensor data from remote study subjects. Edge-to-cloud AI quantifies therapy impacts objectively. This automation aims to reduce clinical trial costs. High-quality data accelerates new drug market delivery. A notable personal link runs through the leadership. Lip-Bu Tan, Intel's chief executive, serves as board chairman of Greenstone Biosciences, the Palo Alto company combining human iPSC biology with AI-driven drug discovery. Greenstone has announced collaborations with NVIDIA and with Illumina rather than with Intel. Silicon innovation nonetheless underpins computational drug discovery across the sector.  Long
Long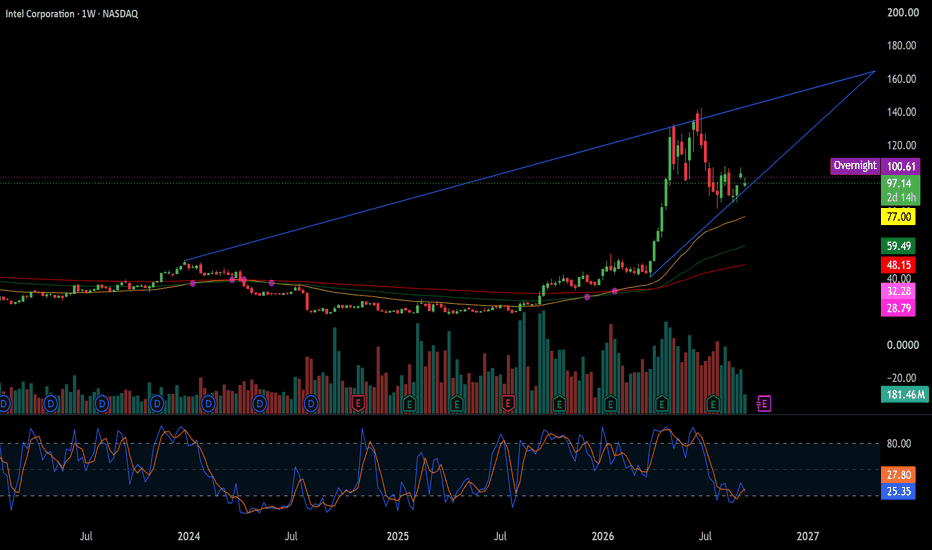
 Long
Long
A New Trendline Break in META, With a Double Bottom Next to ItA New Trendline Break in NASDAQ:META , With a Double Bottom Next to It
There are two things I love in this chart, and they are happening at the same time.
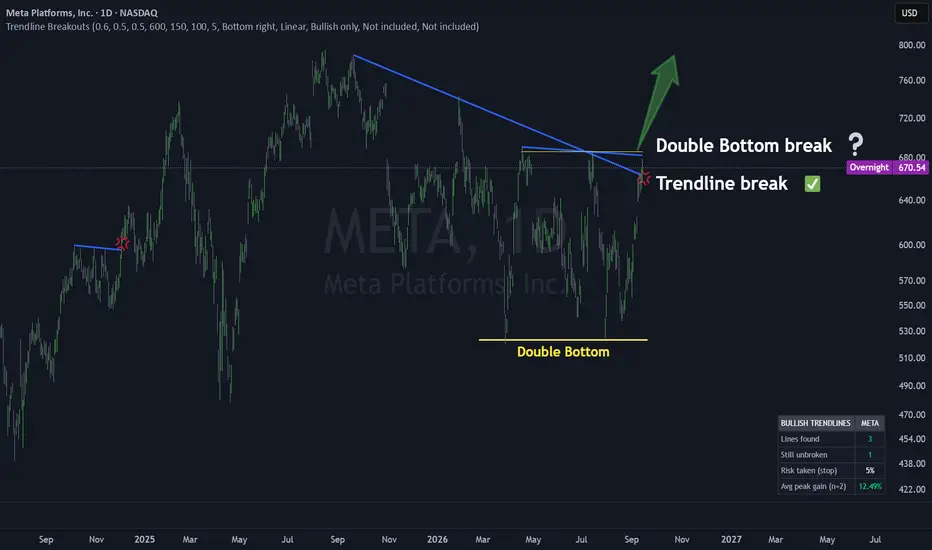
The first is the blue line. Since last autumn, every rally in META stopped there. Buyers pushed, sellers were waiting, price turned back. On Monday, price closed above the Trendline.
A trendline is a queue of sellers. Each time price touched the line, someone in the queue sold. On Monday the queue ran out and that's a short term bull signal.
The second thing is the shape under the line. Two lows at about the same level, a bounce in the middle. A double bottom. The neckline is the yellow line near $688. Price is sitting right under it.
Why I care about Monday
Most days on a chart are noise. The day a trendline breaks is not a normal day. When a line like this one gives way, the next weeks are, on average, much better than the weeks that follow any random day. How much better, with the sample size and the bad cases, is in a study I will publish soon here.
To properly find trendlines and avoid drawing trendlines with different criteria everyday, I built the indicator you see here. It finds these lines by itself and marks the break. No drawing, no opinion.
It already happened once on this chart
Scroll left to late 2025. META broke a trendline of the same kind. What followed was a rally of about 20% . One example proves nothing. But it shows you what the setup looks like when it works.
The Chart
The level I watch next is the yellow line near $688. If price closes above it, the double bottom is complete and the two signals agree. Above that, the last area where sellers showed up in size is near $800. That is a reference, not a target. Below, the blue line is now the level that has to hold.
The full trendline statistics are shared on my profile.  Long
Long
 Long
Long
You can see Bear thereTechnical Analysis — ADBE (Daily TF)
The chart shows a clear short-term bearish structure. Price has been making lower highs and is currently showing rejection after the recent retracement.
1. Bearish impulse
Price dropped sharply from around $275–276 toward $250.
This created strong downward momentum and established the current bearish structure.
The large bearish candles indicate that sellers were dominant during the initial move.
2. Current upward move = retracement
After reaching around $250, price bounced strongly toward $264–265.
However, the rebound has not broken the previous major high around $275–276.
Therefore, technically, this can be interpreted as a retracement within the larger bearish move, rather than a confirmed trend reversal.
3. Rejection around $264–265
Price reached approximately $264–265 and was immediately followed by a bearish candle.
This indicates selling pressure appearing at the retracement area.
The inability to hold above $260–265 strengthens the bearish interpretation.
4. Important levels
$264–265: immediate resistance / retracement rejection area
$260: important short-term level
$252–250: previous support / recent low
$240–236: potential downside areas if $250 breaks
Bearish scenario
If ADBE continues to trade below the $264–265 resistance zone, the current structure remains bearish. A break below $250 would provide stronger technical confirmation that sellers are attempting to extend the downward move.
The projected arrow toward $240–236 represents a potential continuation target, not a guaranteed destination.
ADBE remains technically bearish on the Daily timeframe. The recent upward movement from the $250 area appears to be a retracement rather than a confirmed trend reversal. Price rallied toward $264–265 but failed to sustain the recovery and faced clear rejection. The lower-high structure remains intact, while the previous bearish impulse continues to dominate price action. As long as price remains below the $264–265 resistance zone, the bearish structure remains valid. A break below $250 could open the way toward lower support levels around $240–236. Therefore, the current upside movement can be viewed as a retracement within the broader bearish structure rather than a confirmed bullish reversal.
TRADE at your own risk. This is only personal opinion and not financial advice.  Short
Short
 Long
Long
 Long
Long
Cloudflare New High: AI Safety Threat Turns Into Growth Engine?Cloudflare (NET) has become one of the strongest names in software and cybersecurity. On September 14, the stock surged 7.8% to $330.36 and touched $334.60 intraday, extending a sharp September rally.
The immediate catalyst is a broader reassessment of which companies could benefit from the next phase of artificial intelligence. But Cloudflare’s rally is about more than short-term rotation. The company increasingly sits at the intersection of AI agents, internet infrastructure, cybersecurity and machine-generated traffic.
The key question is whether that strategic position can support a valuation that has already become extremely demanding.
AI Is Becoming a Tailwind Rather Than a Threat
For much of the AI boom, software companies faced a difficult question: if AI can automate workflows, write code and replace parts of traditional software, will existing platforms eventually lose pricing power?
Cloudflare presents a different case. As AI models and autonomous agents generate more internet traffic, the infrastructure required to identify, secure, route and control that traffic becomes more important.
A recent partnership with OpenAI highlights this shift. On September 3, Cloudflare announced Vulnerability Discovery and Remediation, a security service using OpenAI Daybreak models, including GPT-5.6 Cyber. The system combines AI-based code investigation with real-time information from Cloudflare’s global network.
That gives Cloudflare an interesting position in the AI ecosystem. It does not need to compete directly with frontier model developers. Instead, it can provide the security and network layer through which increasingly autonomous software operates.
Cloudflare is also experimenting with new ways to monetize AI traffic. Its Pay Per Crawl system allows website owners to charge AI crawlers for access to their content. Although the product remains in beta, the strategic direction is clear: Cloudflare wants to become an intermediary between AI systems and the open internet.
Growth Is Accelerating — But Valuation Is the Main Risk
The AI narrative is supported by improving fundamentals.
Cloudflare generated $696.1 million in second-quarter revenue, up 36% year over year. Current remaining performance obligations grew 35%, while management raised full-year 2026 revenue guidance to $2.864-$2.870 billion.
That acceleration matters. Cloudflare spent several years trading at a premium while revenue growth gradually slowed. A return toward the mid-30% range strengthens the argument that AI, security and developer infrastructure are creating another growth cycle.
The problem is that investors are already paying heavily for that scenario.
With the stock around $330, Cloudflare’s equity value is approaching $120 billion. Against roughly $2.87 billion of expected 2026 revenue, the company is trading at around 40 times current-year sales.
Even on non-GAAP earnings, the valuation remains exceptionally high.
The market is therefore pricing Cloudflare as more than a fast-growing cybersecurity company. Investors are effectively assuming it can become a critical infrastructure layer for the AI-driven internet while sustaining very high growth for years.
That may eventually prove correct, but the margin for disappointment is now small. Strong results alone may not be enough. Revenue growth, large-customer expansion and guidance will increasingly need to exceed already elevated expectations.
After the Breakout, What Should Traders Watch?
Technically, NET has entered price-discovery territory.
The first key level is $334-$335, around the latest intraday high. A clean breakout above this area would confirm that buyers remain willing to chase the stock after its rapid September move.
Below that, $315-$320 is the first important support zone. A pullback into this area would still be consistent with a strong trend.
The more important level is $300-$305. As long as NET remains above $300, the broader breakout structure stays intact and weakness can still be viewed as consolidation rather than trend failure.
A decisive move below $300 would change the setup. It would suggest that the recent AI-security revaluation moved too quickly and could expose the stock to a deeper retracement.
Cloudflare therefore presents a clear tension: fundamental momentum is improving at the same time valuation risk is becoming more extreme.
AI may be expanding Cloudflare’s addressable market rather than disrupting it, which helps explain the recent re-rating. But with NET near record highs and trading around 40 times expected 2026 sales, the next leg higher will require continued execution.
From here, the fundamentals need to catch up with the price.  Long
Long
OPTIEMUS INFRA## Optiemus Infracom Ltd. (CMP ₹605.00, NSE: OPTIEMUS)
**The SmartWay Research Desk | 16 September 2026**
A Gurugram‑based diversified company, incorporated in 1993. Optiemus Infracom Ltd. operates across **telecom distribution, mobile handset manufacturing, electronics, and infrastructure services**. The company is known for its partnerships with global brands in smartphones and accessories, and has expanded into **electronics manufacturing services (EMS)** under the “Make in India” initiative.
**Promoter Holding (Jun 2026):** **Ashok Gupta & Family — ~74.6% stake (no pledges)**
---
### FY22–FY26 Snapshot
- **Revenue Growth:** FY26 revenue ₹3,242 Cr vs ₹2,812 Cr in FY25 (+15.3% YoY). → **Good**
- **Net Profit:** FY26 PAT ₹212 Cr vs ₹182 Cr in FY25 (+16.5% YoY). → **Good**
- **Operating Margin:** FY26 EBITDA ₹462 Cr, margin 14.3% vs 13.6% last year (+70 bps). → **Good**
- **Equity Capital:** Stable, face value ₹10. → **Good**
- **Dividend Policy:** Dividend ₹2.50/share declared for FY26. → **Good**
- **Asset Building:** Investments in **EMS facilities and smartphone assembly plants**. → **Good**
- **Sales:** Strong demand from **mobile distribution and electronics manufacturing**. → **Good**
- **Expense:** Raw material and import costs remain elevated. → **Neutral/Good**
- **EPS:** FY26 EPS ₹14.25 vs ₹12.20 last year (+16.8%). → **Good**
---
### Institutional Interest & Ownership Trends (Jun 2026)
- **Promoter Holding:** ~74.6% (no pledges)
- **FII Holding:** ~2.1%
- **DII Holding:** ~3.4%
- **Retail & Others:** ~19.9%
---
### Strategic Moves & Innovations
- Expansion in **electronics manufacturing services (EMS)**.
- Focus on **smartphone assembly and accessories distribution**.
- Partnerships with **global brands for technology transfer**.
- Diversification into **IoT devices and telecom infrastructure**.
---
### Cash Flow & Balance Sheet Strength
- Market cap ~₹6,200 Cr.
- Debt‑to‑equity ratio ~0.42 (moderate leverage).
- Book value per share ₹142.00; P/B ~4.3.
- EPS (TTM) ₹14.25; P/E ~42.5.
---
### Risk Factors
- Very high **P/E ratio ~42.5**, valuations expensive.
- Dependence on **smartphone demand cycles and global brand tie‑ups**.
- Exposure to **import cost volatility and forex risks**.
- Competition from Dixon Technologies, Amber Enterprises, and Foxconn India.
---
### Investor Takeaway
Optiemus Infracom has delivered **robust FY26 performance**, supported by EMS expansion, smartphone distribution, and IoT diversification. With strong promoter backing (Gupta Family, 74.6% stake), dividend payouts, and leadership in electronics manufacturing, Optiemus remains a **mid‑cap EMS and telecom play**. At CMP ₹605.00, valuations are **expensive (P/E ~42.5, P/B ~4.3)**, reflecting growth expectations but also sectoral risks.  Long
Long
 Long
Long