Long
Long
 Long
Long
 Short
Short
 Long
Long
 Short
Short
 Short
Short
 Long
Long
 Long
Long
 Long
Long
The secret of Strong Resistance that you can't find in a bookStrong Resistance — A Bearish Warning Sign
In my view, strong resistance is not simply a level where price has previously been rejected.
The key is this:
Price approaches a resistance level but never actually reaches it.
Price comes very close, attempts to push higher, but fails before touching the resistance.
Instead of making a new high, price is rejected and turns downward again.
This shows that selling pressure may be appearing before price even reaches the major resistance.
If this behaviour continues, it can create a lower-high structure, increasing the possibility of a deeper decline and eventually a lower low.
On this ADBE chart, 253.74 is the strong resistance level I am watching. Price repeatedly moved toward this area but failed to reach or break it, then reversed lower.
This is the secret nobody ever taught you.
You are lucky because I am sharing this with you.
My personal view: if ADBE continues failing below this resistance, the probability of another downward move and a potential lower low becomes an important scenario to watch.
This is my personal technical analysis, not financial advice.  Short
Short
 Long
Long
 Long
Long
 Long
Long
 Long
Long
 Long
Long
 Long
Long
AAPL Is Near Its Highs Again — But I’m Watching for a Rejection
Apple is back near its recent highs, but I’m not convinced this is a level to chase.
AAPL closed around $336.13, just below the $340.56 area marked on my daily chart. Above that sits another important level around $351.47. Instead of assuming the stock will keep pushing higher, I want to see how sellers react around this zone.
The setup I’m watching is a short only if price shows a clear rejection from the $340–$351 resistance area. If that happens and momentum starts turning lower, the first thing I’ll watch is whether AAPL can lose the recent support structure. My chart has $273.31 as the larger downside target, but I would not expect price to move there in one straight line.
There is plenty happening around Apple right now. The iPhone 18 Pro and Pro Max went on sale today, while the stock finished slightly lower despite the launch. At the same time, today’s quarterly options expiration and the BOJ rate decision are adding another layer of volatility to the broader market.
That is why I’m more interested in the reaction than the headline. If buyers can push AAPL cleanly above $351.47 and hold there, I would drop the short idea and reassess. I don’t want to fight a confirmed breakout.
For the trade itself, my invalidation is therefore simple: a sustained move above $351.47. If price rejects the resistance zone and starts breaking lower, the bearish setup becomes more interesting. The $273.31 area is the larger target shown on my chart, while the path toward it would need to develop through smaller support levels along the way.
This is also where I find Bitget useful for a setup like this. AAPL is available through supported stock perps, giving me the ability to trade the setup 24/7 rather than being limited to regular U.S. market hours. That matters if the rejection or confirmation happens after the cash market closes. Bitget also supports both long and short positions on its stock perps, so I can change direction when the chart changes instead of being locked into one bias.
After the U.S. session, the levels I’d keep watching are $340.56, $351.47 and the nearby support structure. A rejection keeps the short idea alive; a clean breakout above $351.47 changes the picture.
For now, I’m not shorting AAPL just because it is near resistance. I want the rejection first. Short 
 Long
Long
Liquidity Sweep, Trendline Break, and Whats Next Here’s a clean way to walk your blog readers through this chart without overcomplicating it:
> **What I’m seeing on SPY**
>
> SPY spent most of the session recovering from an earlier selloff. The important part is that buyers started producing **higher lows**, which tells us selling pressure was being absorbed instead of price simply continuing straight down.
>
> At the same time, SPY was still trading underneath a larger **descending trendline** coming down from the prior high. That trendline represented an area where sellers had repeatedly been able to stop price from advancing.
>
> Late in the session, those two forces began squeezing price together: **rising support underneath and falling resistance above**. That creates a compression point. When price gets compressed like this, I’m looking for expansion—either buyers finally break resistance or sellers break the rising support.
### Why the breakout matters
On your chart, SPY began pushing **through the descending trendline** and then moved toward the **$762–$763 area**. That matters because the market is no longer just bouncing inside the downtrend. Buyers are attempting to change the short-term structure.
The sequence was basically:
**sell-side liquidity taken → buyers respond → higher lows → compression → trendline break → price expansion.**
That’s much stronger than simply saying, “SPY went up.”
The key question now is whether the breakout becomes **accepted**.
A breakout is not confirmed just because one candle crosses a line. The stronger confirmation is:
**breakout → pullback → old resistance holds as support → buyers continue higher.**
### readers
The area around **$760.5–$761** was important because that was where the descending trendline and previous resistance were sitting.
Now that price has pushed through it, that zone becomes the first place I would want buyers to defend.
Above that, the chart is moving into roughly **$762.5–$763**, which is the next meaningful resistance/liquidity area.
If buyers can hold the breakout and establish acceptance above that area, the structure becomes considerably more constructive.
But if SPY falls back underneath **$760.5–$761** and cannot reclaim it, then the breakout starts looking more like a **liquidity grab or failed breakout** rather than a true change in trend.
### One important detail on this screenshot
Your chart is also showing **post-market pricing around $763**, while the regular-session close was around **$761.69**.
That distinction matters.
After-hours moves can be useful information, but liquidity is thinner and price can move more easily. I would not treat the $763 print alone as confirmation.
The real test comes when regular trading resumes and institutional liquidity returns.
### What I would expect next
I would present it as two scenarios rather than pretending we know which one must happen.
**Bullish scenario:** SPY holds roughly **$761**, absorbs any pullback, then starts accepting above **$762–$763**. That would support the idea that buyers successfully broke the short-term downtrend.
**Bearish scenario:** SPY loses the breakout area, falls back underneath approximately **$760.5**, and fails to reclaim it. That would tell us the breakout did not attract enough sustained buying and could send price back toward the lower support/liquidity areas.
The important lesson for your readers is:
> **The trendline break gets our attention. The retest tells us whether we should trust it.**
That’s the difference between chasing a green candle and actually reading market structure.
 Long
Long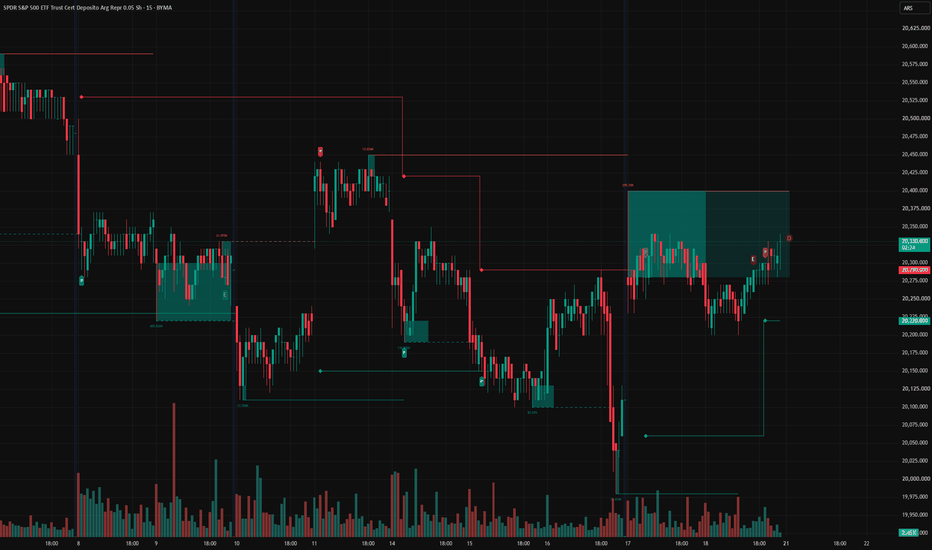
 Long
Long
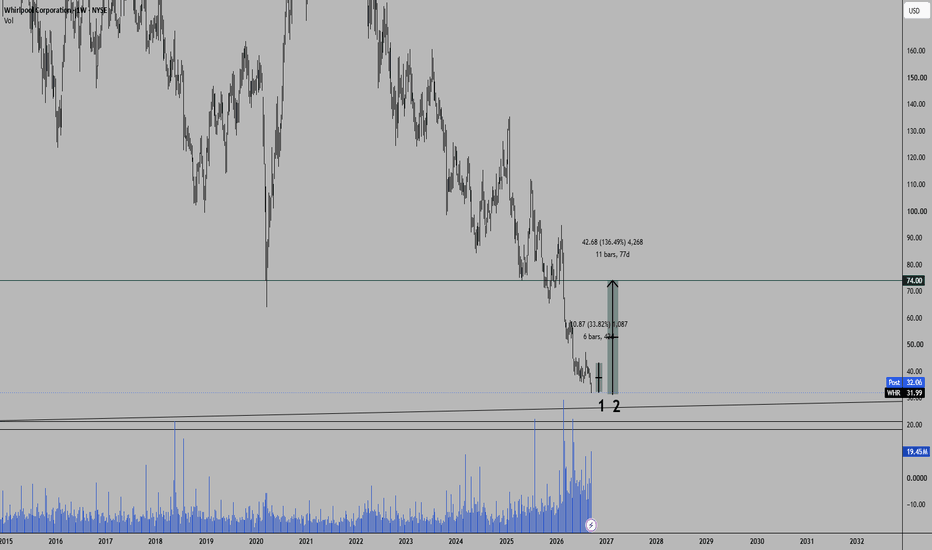
Whirlpool Corporation (WHR) Is AwakeningKEY TAKEAWAYS
• Price Target: US$74 per share
• Potential Upside: approximately 137%
• Thesis: The combination of technical structure, a favorable economic cycle for the sector, recovering fundamentals, and positive analyst outlooks creates a compelling setup for further analysis.
WHIRLPOOL CORPORATION
Whirlpool Corporation is a leading U.S. multinational and the #1 home appliance company in North America and Latin America. The company designs, manufactures, and markets home appliances and related household products. It also ranks among the Top 3 globally , competing at the highest level with major international players such as Haier, Midea, LG Electronics, and Samsung Electronics.
Founded on November 11, 1911, Whirlpool has been listed on the New York Stock Exchange (NYSE) since 1955 and has maintained a position of industrial leadership and resilience for more than a century.
Whirlpool Corporation also maintains strategic relationships with some of the largest home improvement and department store chains across North and Latin America, including Home Depot, Lowe's, Sears, and major regional retailers.
Unlike competitors that rely heavily on importing their products from Asia, Whirlpool manufactures a significant portion of its volume directly in North America. This helps reduce international freight costs and improves response times. Its scale also allows the company to spread production costs over a large volume while continuing to invest in research and development.
TECHNICAL ANALYSIS
The first thing that caught my attention was the presence of elevated institutional volume on the price chart.
In Figure 1, you can see how historically elevated trading volumes have preceded significant price increases in Whirlpool. A leading company with a long history of consistent returns is unlikely to go unnoticed by major institutions and large investors.
Figure 1
When multiple technical tools also reveal an alignment of technical and psychological price zones, the analysis becomes more robust and encourages us to take a deeper look at the company's fundamentals.
Figure 2
EARNINGS REPORT JUST AROUND THE CORNER
The next earnings report is only 27 days away , and the current analyst outlook is positive.
One factor worth considering is that the large home appliance business tends to concentrate a significant portion of its sales and replacement activity during the second half of the year. In addition, the company has announced cost-reduction initiatives aimed at recovering approximately $150 million in operating margins .
After two consecutive quarters in negative territory, partly related to adjustments and accumulated inventories at retailers, analysts are modeling that even a modest stabilization in retail demand could bring earnings back into positive territory.
During the second quarter of 2026 , net earnings available to common shareholders increased to $75 million ($1.15 per share) , compared with $65 million ($1.17 per share) during the same period in 2025.
The company also recognized a $139 million gain related to the sale of its remaining 25% stake in Beko Europe, the termination of the agreement concerning its Russian business, and the release of accumulated indemnification provisions.
Furthermore, Whirlpool raised approximately $1.081 billion net in February 2026 through a combined issuance of common stock ($524 million) and mandatory convertible preferred stock ($557 million).
Another important factor is the IEEPA tariff recovery process. This is the legal mechanism through which U.S. importers seek refunds for tariffs collected under the International Emergency Economic Powers Act. Whirlpool secured approximately $50 million in tariff recoveries through this process.
Other factors worth keeping in mind include the decline in interest expense, from $86 million to $63 million during the quarter, while selling, general and administrative expenses (SG&A) decreased by 6.7% to $371 million .
Whirlpool Corporation also has a share repurchase program authorized by its Board of Directors. As of June 30, 2026, approximately $2.5 billion remained authorized and available under this program.
LITIGATION
For a multinational company of Whirlpool's size, many legal cases are typically resolved through economic settlements, often involving compensation funds for consumers or shareholders, without necessarily compromising the company's overall operational stability.
However, there is a significant tax dispute related to the BEFIEX program in Brazil , which represents one of the more relevant legal and tax contingencies on Whirlpool Corporation's balance sheet.
The BEFIEX program was a Brazilian government tax-incentive program — Benefícios Fiscais a Exportação — designed to support exporting companies by compensating or exempting certain federal taxes.
The dispute arose when Whirlpool used tax credits derived from this program to offset tax liabilities. Brazilian tax authorities subsequently challenged the validity and scope of a significant portion of these offsets.
The accumulated administrative and judicial proceedings amount to approximately $538 million . In its regulatory filings with the SEC, Whirlpool classifies this tax contingency as a possible but not probable loss and continues to actively defend its legal position.
If final judicial decisions in Brazil ultimately go against Whirlpool, the company could be required to make capital outlays or negotiate tax settlements, potentially affecting liquidity.
My view is that this issue is unlikely to materially affect Whirlpool in the medium term. Brazil is known for having one of the world's most complex and prolonged tax and litigation environments, meaning that disputes of this nature can take years — and sometimes decades — to reach a definitive resolution.
CONCLUSION
My analysis of Whirlpool Corporation does not rely on a single indicator or isolated phenomenon.
Instead, it is the combination of multiple factors that makes the company particularly interesting to me: the technical structure, sector dynamics, improving fundamentals, cost-reduction initiatives, potential tariff recoveries, capital structure developments, and the current analyst outlook.
The upcoming earnings report will be especially important because it should provide further evidence as to whether the recovery that the market is beginning to anticipate is actually supported by Whirlpool's operating numbers.
Price Target: US$74
Potential Upside: ~137%
As always, this is my personal analysis and not financial advice. Investors should conduct their own research and consider their individual risk tolerance before making any investment decision.
 Long
Long