Long
Long
 Long
Long
 Long
Long
 Short
Short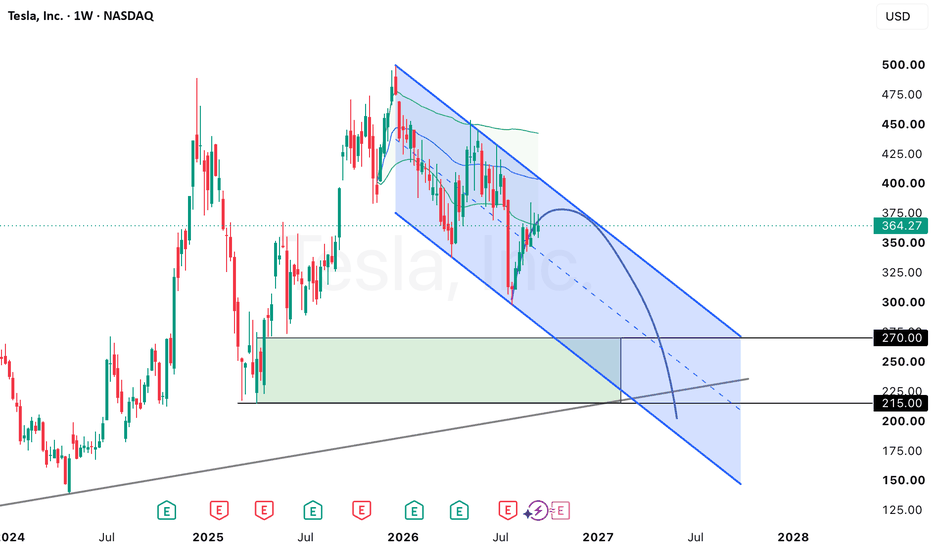
 Long
Long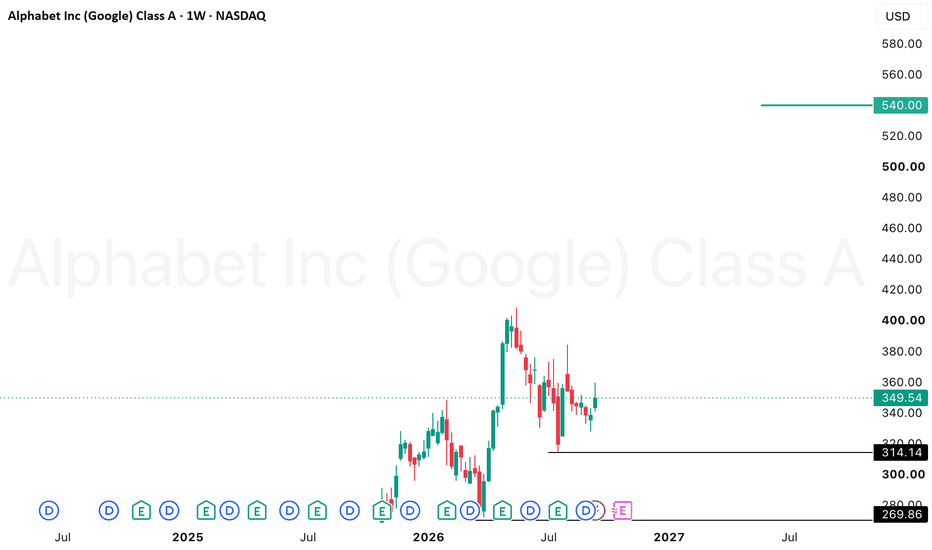
Week 39 of 52 | MSTR $120 Reclaimed — $175–190 Is Back in PlayNASDAQ:MSTR has come a long way from where we were watching it a few weeks ago. Back then the idea was pretty simple: first I wanted to see the $82–95 area hold, then MSTR needed to recover $100–105, and after that $120 was the next level that really mattered. Now we’re trading around $154, so a big part of that move has already happened.
That changes the setup. At $90–100, I was interested in whether support could hold. Around $120, I was watching for the reclaim. At $154, I’m thinking a lot more about patience. This is usually the point where people start getting interested because the stock is moving fast, and it’s also where it becomes easy to chase.
I don’t really want to do that here. A big green candle makes the chart look obvious after the fact, but it doesn’t automatically mean the risk/reward is still attractive at the current price. I’d rather wait and see what MSTR does when it finally pulls back.
The first area I’m watching is around $140–145. After a move like this, I think that’s a reasonable place to look for buyers. If MSTR pulls back, holds that area and starts moving higher again, the structure would still look healthy to me. If we lose it, then $120–125 becomes much more important.
That $120–125 area matters because it was resistance before. Now I want to see if it can become support. That’s one of the things people sometimes overcomplicate in technical analysis. A breakout by itself is not enough. What happens after the breakout matters just as much.
If price breaks resistance and later comes back to the same area, that’s where you get more information. Do buyers defend it? Does price immediately fall back below it? Does volume come in? Does the stock start building higher lows? That reaction tells you a lot more than just drawing a line on the chart.
That’s why I’m paying attention to $120–125. If MSTR eventually comes back there and buyers defend it, I’d see that as a much stronger confirmation that the structure has really changed.
Above current price, I’m still watching the $175–190 area. That zone was already on the chart before this move. I’m not saying MSTR has to go there next, but if momentum continues, that’s the next area where I’d expect things to get more interesting.
There will probably be more sellers there, maybe some profit taking, maybe a rejection, maybe a breakout. I don’t know yet, and I don’t need to know yet. I’d rather wait and see how price reacts when it gets there.
That’s really the part I care about most. The level itself isn’t the trade. The reaction at the level is.
Bitcoin also remains a big part of the picture. MSTR doesn’t trade like a normal software company anymore. BTC sets a lot of the direction, and MSTR tends to amplify the move. When Bitcoin is strong, MSTR can move very fast. But that works the other way too, and if BTC starts losing momentum, MSTR can give back gains quickly.
So even though this chart looks much better than it did a few weeks ago, I’m not interested in assuming the next move is straight to $190.
For now, these are the levels I care about:
$140–145 — first area to watch on a pullback
$120–125 — key breakout support
$175–190 — major supply area
$82–95 — major support
And for me, the main lesson here is still patience. You don’t have to catch every candle, and you don’t have to buy just because something is moving. Sometimes the best thing you can do is already know your levels and wait.
If MSTR keeps running without giving a good setup, that’s fine. There will always be another trade. I’d rather miss part of the move than force an entry just because I’m afraid of missing it.
Patience is part of the trade.
Not financial advice. Tesla-Can Buyers Build Enough Momentum for Another Break Higher?Market Structure
Tesla remains in a medium-term bullish structure on the 4-hour chart. After recovering strongly from the late-July low, price has entered a consolidation phase below resistance. Higher lows continue to hold, suggesting buyers are still defending the trend despite the recent sideways movement.
Market Sentiment - Moderately Bullish
Momentum has cooled after the recent rally, but buyers continue to absorb selling pressure around support. As long as higher lows remain intact, the overall sentiment stays cautiously bullish.
Bullish Scenario
If Tesla breaks above the 368 resistance zone with strong buying volume, bullish momentum could accelerate toward 375, with 382 becoming the next upside target.
Bearish Scenario
If price falls below the 356 support area, short-term selling pressure could increase and drive the price toward 348. A decisive break below 348 would weaken the current bullish structure and shift momentum back to the downside.
────────────────────
Market View
Tesla is trading within a consolidation range after a solid recovery from recent lows. While buyers continue defending support, the market is waiting for a clear breakout before establishing the next directional move.
────────────────────
Key Levels
First Resistance: 368
Second Resistance: 375
First Support: 356
Second Support: 348
────────────────────
Outlook
A sustained breakout above 368 would confirm renewed buying strength and could open the door toward 375–382.
On the other hand, losing 356 would increase the probability of another corrective move toward 348 before buyers attempt to regain control.
────────────────────
Event Risk
Tesla may remain sensitive to broader Nasdaq performance, U.S. economic data, Treasury yield movements, EV industry developments, company-specific announcements, and overall market risk sentiment. These events could lead to increased short-term volatility.
────────────────────
Please share your view below:
Do you think Tesla is ready to break above resistance and continue its recovery, or will the current consolidation lead to another pullback?
I'll continue sharing more Market Structure and Key Level updates.  Short
Short
 Long
Long
If my thoughts are correct, we should see a rally sep 21-22 , The pattern matches with 2024 rally ,, Macd, rsi, Pmo, stochastic in 4 timeframes, and Gme call options just broke out of the downtrend ,,,, we could see 36$ to 43$ ,,,,, hopefully next week  Long
Long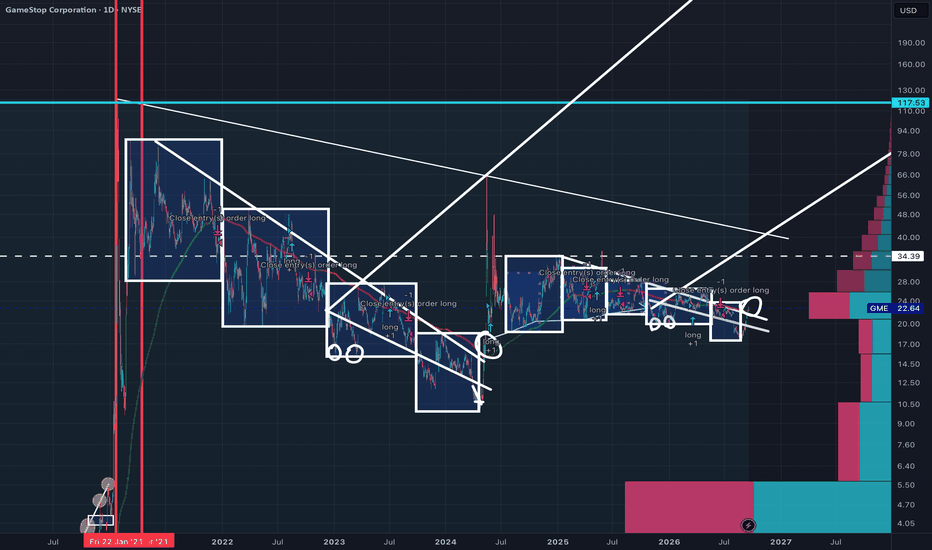
 Long
Long
 Long
Long
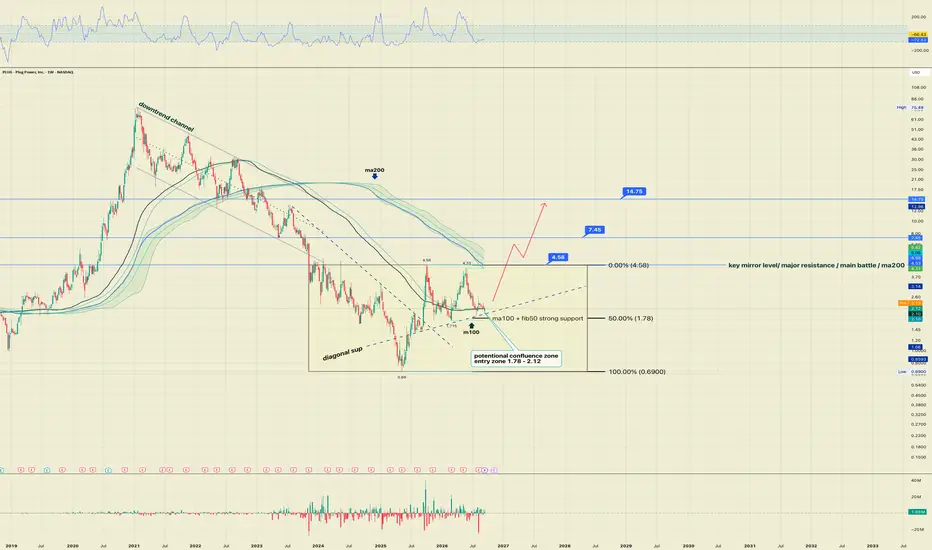
PLUG: Multi-year bottom is in. The end of the three-year dramaPLUG has been under heavy selling pressure for a long time. Following a multi-year protracted decline, a key structural shift occurred in November 2023 when the price broke below the lower boundary of the global downtrend channel. This breakdown was a major manipulation designed to shake out weak hands and capture short liquidity, triggering a final wave of capitulation where the market hammered out an absolute macro bottom at $0.69 . This flush out completely reset the old bearish cycle and launched a massive reversal base, where smart money has been systematically absorbing market supply via limit orders from late 2023 to the present day $PLUG.
This multi-year base forms a complex accumulation structure. The ascending dotted line (diagonal sup) has proven its absolute validity, acting as the primary dynamic axis holding the entire chart geometry together. Currently, the price is compressed within a local confluence zone of $1.78–$2.12. This is the most critical battleground for buyers to defend their positions, as it marks the intersection of the 50.00% Fibonacci retracement level ($1.78), the heavy 100-week moving average (ma100), and the dynamic support line. The $1.78–$2.12 area is the primary zone where the market must show a strong bullish reaction if the long-term base scenario is to remain valid. Crucially, this is not a guaranteed bottom. If the price closes the week below $1.55, the base structure will be compromised, the limit barrier broken, and the bullish thesis completely invalidated. A major headwind to keep in mind is the fundamental context — the company's high cash burn rate, which keeps Wall Street consensus conservative with intermediate targets set around $3.50–$5.00.
Overhead lies the absolute ultimate technical barrier of the macro structure — the key mirror resistance level at $4.58, which aligns with the heavy 200-week moving average (MA200). This is the "main battle" and the upper boundary of the multi-year base. As long as the price remains below it, the stock continues to trade within the global accumulation phase. A clean breakout and confirmation above $4.58 will fundamentally shift the technical landscape on a macro scale. Piercing through this heavy supply wall will trigger a massive short squeeze, confirm an official exit from the accumulation base, and unleash three years of coiled energy, clearing the path toward structural targets at $7.45 and a long-term macro target of $14.75.
This publication is for analytical purposes only and does not constitute individual investment advice. Technical levels are scenarios, not guarantees of price movement.  Long
Long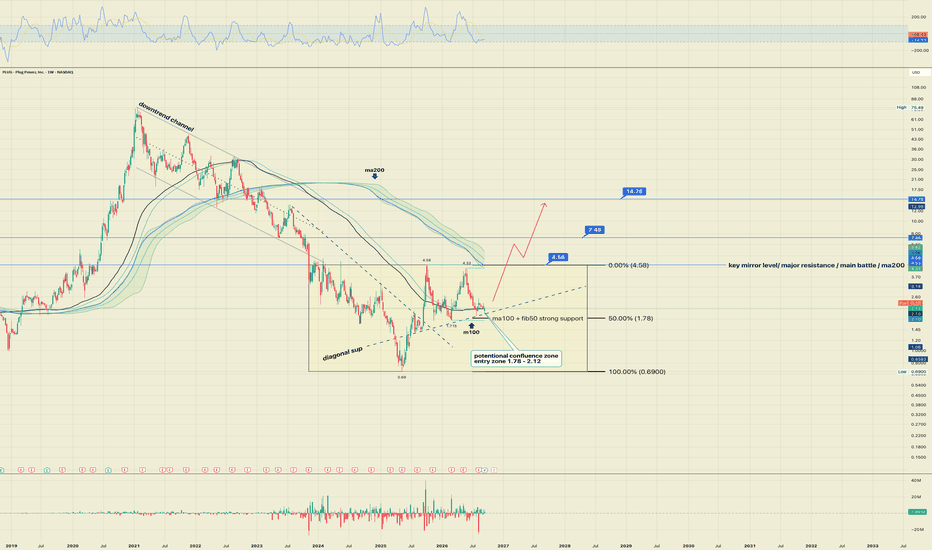
NFLX: Completion of Massive Head-Shoulder, Target Zones!Hello Community,
welcome to my new analysis of NFLX on the weekly timeframe perspective. In this stock, I have detected crucial signs of completion of the massive bearish head-and-shoulders formation. Now I have identified all the factors that will be highly necessary to consider next.
When looking at my chart, we can see how NFLX formed the breakdown below the neckline of this gigantic head-and-shoulders formation. Now, it is confirming this breakdown, with the bearish continuation formation ready to form the next bearish wave towards the downside.
With the breakdown, NFLX has already activated the bearish target zones. With the current bearish momentum, it is highly likely that these targets will be reached in the upcoming times. Once the final targets have been reached, I am going to update on the bearish momentum and consider whether NFLX continues the bearish trend or not.
In this manner, thank you a lot for watching!
The support is highly appreciated.
VP
UWMC: Is the Downtrend Running Out of Sellers?Good Morning,
Hope all is well. Here is my TA on UWMC.
What I’m Seeing
Looking at UWM Holdings on the weekly chart, the primary trend is still decisively bearish. Price has fallen from roughly $8 in 2024 to around $1.29, remains well below a declining weekly trend/average, and continues to print lower highs and lower lows.
But there is one development that catches my attention: the relationship between bearish volume and price is starting to change.
Earlier high-volume selling around $4–$5 produced significant downside continuation. The next heavy-volume event around the low-$3s again pushed price materially lower.
More recently, however, I've marked what appears to be the strongest bearish-volume event of the decline near roughly $1.30–$1.60, yet price did not immediately follow through proportionally lower.
That's potentially significant.
I'm seeing:
increasing bearish effort → decreasing bearish result.
That can be an early sign of seller exhaustion or absorption—but I need more evidence before calling it accumulation.
The Volume Progression Is the Key
The first high-volume event around $4.00–$4.50 didn't stop the downtrend.
Another large selling event around $3.00–$3.30 also failed to create a durable bottom.
But the latest event is different.
Despite very heavy selling near the current lows, price has so far remained around the $1.20–$1.50 region instead of immediately accelerating toward $1 or below.
That's the first thing that makes me interested.
The question now becomes:
How much additional downside can sellers actually produce?
If volume remains elevated but price refuses to make meaningful new lows, the absorption thesis strengthens.
$1.20–$1.50 Is My Observation Zone
I wouldn't call this a confirmed accumulation zone yet.
I'd call approximately $1.20–$1.50 my observation zone.
The stock needs time to prove that buyers are actually willing to defend these levels.
Ideally, I want to see price stop trending vertically downward and begin moving sideways.
Something like:
selling climax → failed new low → consolidation → higher low → breakout.
Right now I may have the first two pieces developing.
I don't have the rest.
Bearish Momentum May Be Losing Strength
Your directional-indicator observation is also interesting.
Based on the way you're reading the indicator, the negative directional component moving beneath the broader directional/trend measure suggests bearish directional pressure is beginning to weaken.
At the same time, your longer-term volume trajectory appears to be rolling over.
That combination matters because bottoms generally don't begin when everything suddenly becomes bullish.
They often begin when the existing bearish trend simply stops becoming more bearish.
That's potentially what I'm seeing here.
$1.50–$1.60 Is My First Test
Before thinking about a major recovery, I want UWMC to prove it can reclaim nearby resistance.
Approximately $1.50–$1.60 would be my first area.
Then I'd watch $1.80–$2.00.
A move through $2 would be more meaningful because it would start taking out part of the recent lower-high structure.
My ideal sequence would be:
$1.20–$1.50 base → $1.60 breakout → higher low → $2 reclaim → continuation.
Until something like that develops, this remains a falling stock showing possible exhaustion—not a confirmed reversal.
$2.50–$3.00 Would Be the Bigger Structural Change
If the stock eventually gets above $2, I think $2.50–$3.00 becomes the first genuinely important recovery zone.
That's where previous support broke and where I would expect substantial overhead supply.
Above there, the declining weekly trend/average around the low-$3 area becomes the bigger test.
So my rough roadmap is:
$1.20–$1.50 → $1.60 → $2.00 → $2.50–$3.00 → weekly trend.
I wouldn't start projecting $5 or $6 from here.
UWMC has a lot of structural damage to repair first.
Fundamentals — There Are Real Reasons for This Decline
This is where I have to be much more careful with UWMC than some of the other bottoming charts.
Q2 2026 originations were $39.7 billion, essentially flat year over year but down from $44.9 billion in Q1. Revenue was $888 million, up from $758.7 million a year earlier. Gain margin also improved to 133 basis points, versus 113 bps in Q2 2025.
So the core mortgage operation is still producing substantial volume.
But earnings were extremely volatile. UWM reported a $451.9 million Q2 net loss, versus $314.5 million of net income a year earlier. Adjusted EBITDA was $185.9 million versus $195.7 million a year earlier. The reported loss was heavily affected by fair-value movements in mortgage-servicing rights and interest-rate derivatives, which makes the headline earnings number particularly noisy.
So this isn't simply:
business collapsing → stock collapsing.
The financial picture is more complicated.
The Dividend Suspension Is a Major Change
One fundamental development I would take seriously is UWM's decision to suspend its quarterly dividend after Q2.
Management said it wants a more disciplined capital-allocation approach and will continue evaluating future capital returns.
That's important because the dividend had historically been a meaningful part of the UWMC investment case.
Its removal can change the shareholder base and valuation framework.
It also tells me management currently sees greater value in preserving or redeploying capital than continuing the previous distribution.
That isn't automatically bearish or bullish—but it's a material change.
The Balance Sheet Deserves Attention
This is probably my biggest fundamental caution.
UWM reported approximately $6.04 billion of non-funding debt at June 30, up from $3.32 billion a year earlier, while total equity declined to approximately $985 million from $1.75 billion.
Its reported non-funding debt-to-equity ratio therefore increased from 1.90x to 6.13x.
At the same time, the company reported approximately $1.3 billion of available liquidity, including $498 million of cash.
So I don't interpret this as an immediate liquidity crisis from those figures alone.
But the leverage trajectory is something I would monitor closely.
For this technical bottom to become attractive fundamentally, I'd like to see the capital structure stabilize rather than continue deteriorating.
Mortgage Rates Are the Bigger Macro Problem
UWMC is also extremely sensitive to the U.S. mortgage environment.
And right now that environment remains difficult.
As of September 17, the average U.S. 30-year fixed mortgage rate had climbed to 6.95%, its highest level since January 2025.
A Reuters survey this week also found expectations for mortgage rates to remain elevated, with housing affordability continuing to suppress transaction volumes.
That matters directly to UWM.
Higher rates generally reduce refinancing incentives and can constrain home-purchase activity. So a sustained improvement in the mortgage market would be an important fundamental catalyst, while prolonged high rates remain a major risk.
There Is Still Operating Strength Underneath the Volatility
The positive side is that UWM remains a very large mortgage originator.
Q2 purchase originations were approximately $23.8 billion, up from $18.7 billion sequentially. Refinance volume was $15.9 billion, down sharply from Q1 but above $12.4 billion a year earlier.
The servicing portfolio also continued growing, reaching approximately $247.6 billion of unpaid principal balance, versus $211.2 billion a year earlier.
So the operating franchise hasn't disappeared.
The problem is the combination of mortgage-cycle pressure, earnings volatility, leverage and capital-allocation changes.
Why This Setup Interests Me
Technically I'm seeing:
high-volume selling → lower prices → more high-volume selling → further decline → strongest bearish-volume event → surprisingly limited immediate follow-through.
That's exactly where I start asking whether sellers are becoming exhausted.
But fundamentally, this one carries considerably more risk than a simple oversold quality-company setup.
The housing backdrop remains difficult, the dividend has been suspended, leverage has increased, and earnings are heavily influenced by servicing-right and derivative valuations.
So I need more confirmation from price.
My Bullish Scenario
The structure I'd want to see is:
$1.20–$1.50 holds → bearish volume declines → price stops making new lows → $1.60 reclaimed → higher low → $2 breakout.
If that happens, I'd start looking toward $2.50–$3.00.
A successful reclaim of the declining weekly trend after that would be much stronger evidence that this is transitioning from seller exhaustion into an actual recovery cycle.
My Bearish Scenario
This one has a very obvious risk.
If UWMC loses approximately $1.20 and begins accepting prices below it with expanding volume, then the latest high-volume event wasn't absorption—it was simply another stage of distribution.
A break beneath $1.00 would be particularly significant psychologically and structurally.
Fundamentally, I'd also become more cautious if leverage continues rising, liquidity deteriorates, origination economics weaken materially, or the housing market worsens further.
My Bias
I'm interested, but more cautious here than on some of the other potential bottoms we've looked at.
The technical signal that interests me is straightforward:
the largest bearish-volume event near the lows has so far produced surprisingly little additional downside.
That's worth watching.
But I don't want to confuse seller exhaustion with a completed bottom.
For me:
$1.20–$1.50 = observation / potential absorption zone.
$1.60 = first sign of improvement.
$2.00 = meaningful structural confirmation.
$2.50–$3.00 = major recovery test.
If sellers keep hitting this area with heavy volume and UWMC simply refuses to move materially lower, I'll become increasingly interested.
The signal I'd really want is for that selling pressure to dry up, price to establish a higher low, and then buyers to push through $1.60–$2.00.
That's when I'd have stronger evidence that seller exhaustion is actually turning into accumulation rather than just another temporary pause in a powerful downtrend.
Trade Safely
Enjoy!  Long
Long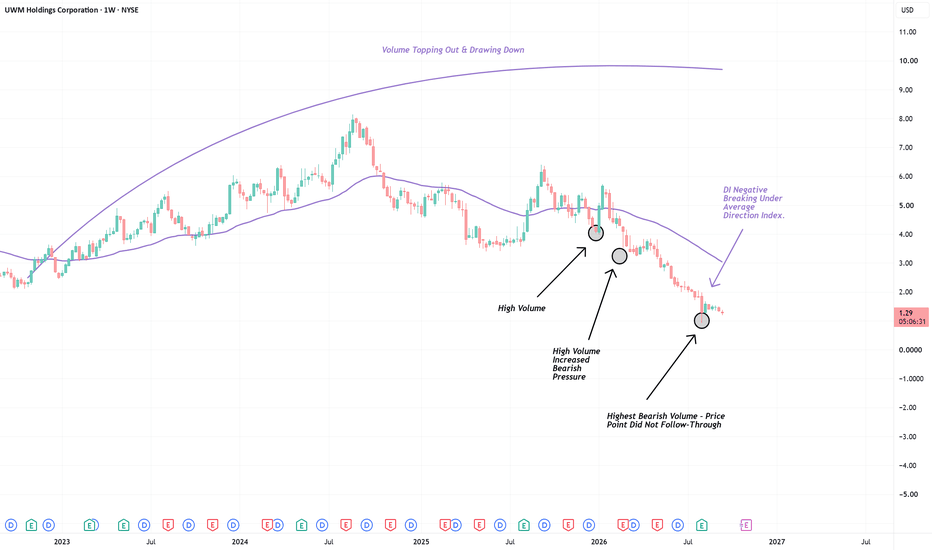
 Long
Long
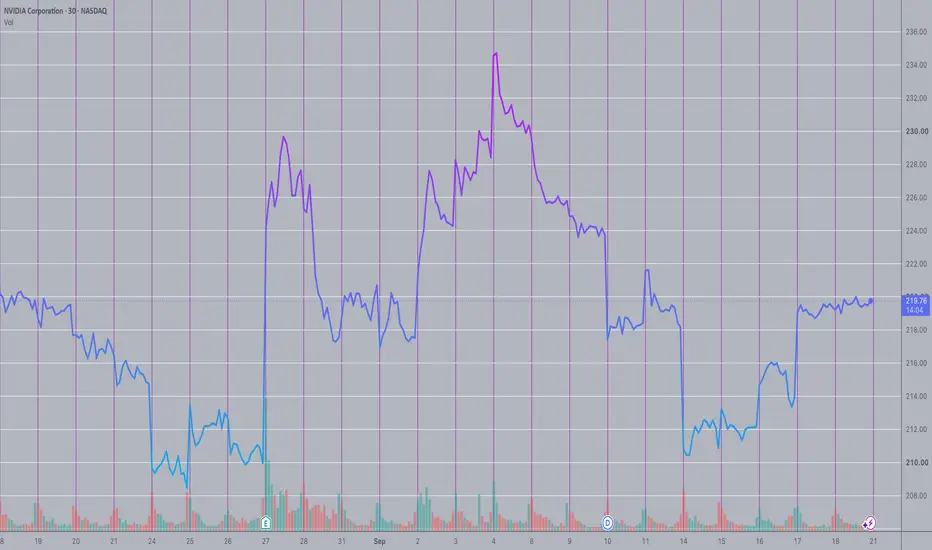
NVDA's September Drop: The 7-8% Rule in Real TimeNVIDIA printed an intraday high of $234.55 on September 4. Ten days later, on September 14, it traded down near $210 -- a peak-to-trough decline of just over 10%. It has since recovered back above $219.
I don't use this space to call tops or bottoms. I use it to talk about the mechanical rules that keep a portfolio intact when the story around a stock gets loud in either direction.
The rule here is William O'Neil's: sell if a position falls 7-8% below where you bought it. No exceptions, no waiting for the fundamentals to "catch up." Applied here, an 8% stop off the September 4 high sits around $215.80 -- a level the stock cleared on the way down well before the eventual low near $210.
The rule doesn't claim to catch the exact bottom, and it won't feel good in a case like this one, where the stock bounced back within days. That's fine. The rule isn't graded trade by trade -- it's graded over hundreds of trades, where the handful of names that don't bounce are the ones that would otherwise do real damage to an account. Capping the downside mechanically is what lets you stay in the game long enough for the winners to matter.
I apply the same logic outside of equities too -- real estate, the private fund, even the vehicle fleet at Glencore: know the number that gets you out before you're in the position, not after.
Educational breakdown of a risk-management framework, not a recommendation to buy, sell, or hold NVDA. Not investment advice. Do your own research before trading any security. SNDK Is Back Near $1,800 — This Level Could Decide the Next Move
SNDK has moved hard, but I’m more interested in what happens next. Price is back around $1,739, right below the $1,800 area that has repeatedly acted as resistance on the 4H chart.
The bigger structure still looks constructive to me. SNDK has been making higher lows inside a rising channel, and the current move is bringing price back toward the top of the recent range.
The setup I’m watching is simple: I want a clean 4H close above $1,800, followed by a hold or retest of that level. If buyers can turn $1,800 into support, I’ll be watching $2,300–$2,400 as the next major area, close to the upper side of the broader channel.
There is also a reason to pay attention to SNDK right now. The stock is scheduled to join the S&P 100 on September 21, while memory and AI data-center demand remain important themes around the company.
Today also comes with extra market noise. The BOJ raised its policy rate to 1.25%, while U.S. markets are dealing with quarterly derivatives expiration. That can make price action less clean, so I’d rather wait for SNDK to confirm its direction than force an entry.
The downside is just as clear. My main support zone is $1,450–$1,500. If price loses that area and breaks down from the rising channel, the breakout thesis is no longer valid for me.
This is also where Bitget becomes useful for this type of setup. SNDKUSDT is available as a stock perp on Bitget with 24/7 trading, so if the setup changes after the U.S. session closes, I can still monitor and manage the position instead of waiting for the next market open.
I also like the flexibility of being able to trade the stock perp long or short with USDT rather than needing a traditional brokerage account. Bitget says its stock perps are designed for 24/7 trading and support both directions, although liquidity can vary outside regular U.S. market hours.
So my map is straightforward:
Above $1,800: breakout confirmation → watch $2,300–$2,400.
Rejection below $1,800: no chase → wait for another setup.
Below $1,450–$1,500: rising structure is weakened → reassess.
I’m not trying to predict the next candle. I’m watching $1,800 to see whether SNDK can finally turn resistance into support.
Not financial advice.  Long
Long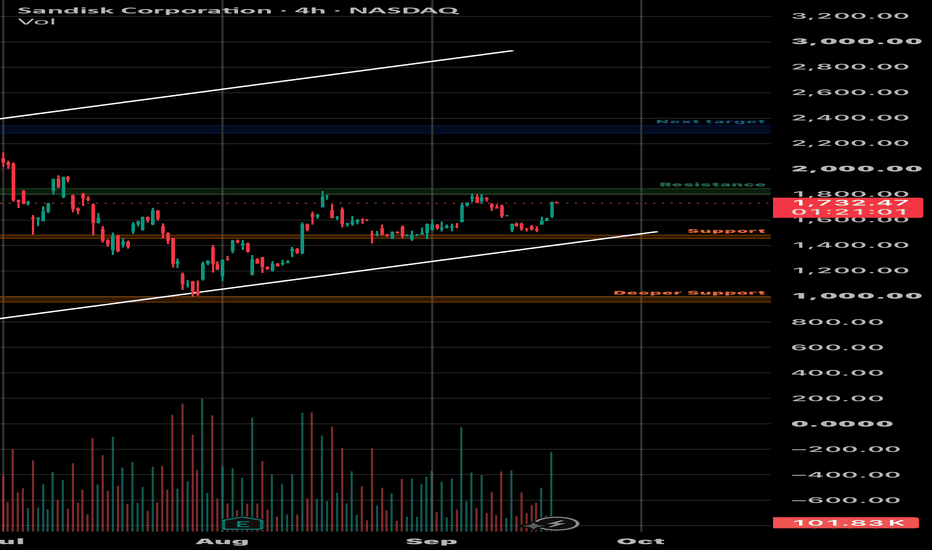
 Short
Short
Could Alphabet Start Moving Again?Alphabet has drifted for months, but some traders may think it’s ready to start moving again.
The first pattern on today’s chart is the long pullback since mid-May, which has seen the Internet giant bounce twice at its rising 200-day simple moving average (SMA). That may confirm a longer-term uptrend is in place.
Second, GOOGL is pushing above its 50-day SMA. That could suggest the intermediate-term trend is getting bullish again.
Third, MACD is rising and the 8-day exponential moving average (EMA) crossed above the 21-day EMA. That may indicate its short-term trend is also turning positive.
Next, Bollinger Band Width has narrowed as prices converge. Could that narrowing price action give way to expansion?
Finally, GOOGL is an active underlier in the options market. (Its average daily volume of 367,500 contracts ranks 11th in the S&P 500, according to TradeStation data.) That could help traders take positions with calls and puts.
TradeStation has, for decades, advanced the trading industry, providing access to stocks, options and futures. If you're born to trade, we could be for you. Learn more here about TradingView’s Broker of the Year!
Past performance, whether actual or indicated by historical tests of strategies, is no guarantee of future performance or success. There is a possibility that you may sustain a loss equal to or greater than your entire investment regardless of which asset class you trade (equities, options or futures); therefore, you should not invest or risk money that you cannot afford to lose. Online trading is not suitable for all investors. View the document titled Characteristics and Risks of Standardized Options at www.TradeStation.com . Before trading any asset class, customers must read the relevant risk disclosure statements on www.TradeStation.com . System access and trade placement and execution may be delayed or fail due to market volatility and volume, quote delays, system and software errors, Internet traffic, outages and other factors.
Securities and futures trading is offered to self-directed customers by TradeStation Securities, Inc., a broker-dealer registered with the Securities and Exchange Commission and a futures commission merchant licensed with the Commodity Futures Trading Commission). TradeStation Securities is a member of the Financial Industry Regulatory Authority, the National Futures Association, and a number of exchanges.
Options trading is not suitable for all investors. Your TradeStation Securities’ account application to trade options will be considered and approved or disapproved based on all relevant factors, including your trading experience. See www.TradeStation.com . Visit www.TradeStation.com for full details on the costs and fees associated with options.
Margin trading involves risks, and it is important that you fully understand those risks before trading on margin. The Margin Disclosure Statement outlines many of those risks, including that you can lose more funds than you deposit in your margin account; your brokerage firm can force the sale of securities in your account; your brokerage firm can sell your securities without contacting you; and you are not entitled to an extension of time on a margin call. Review the Margin Disclosure Statement at www.TradeStation.com .
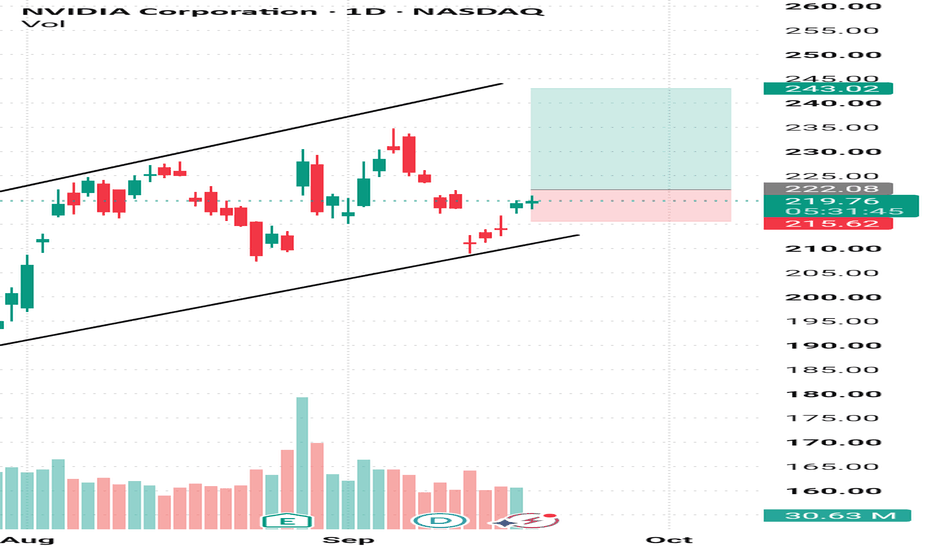
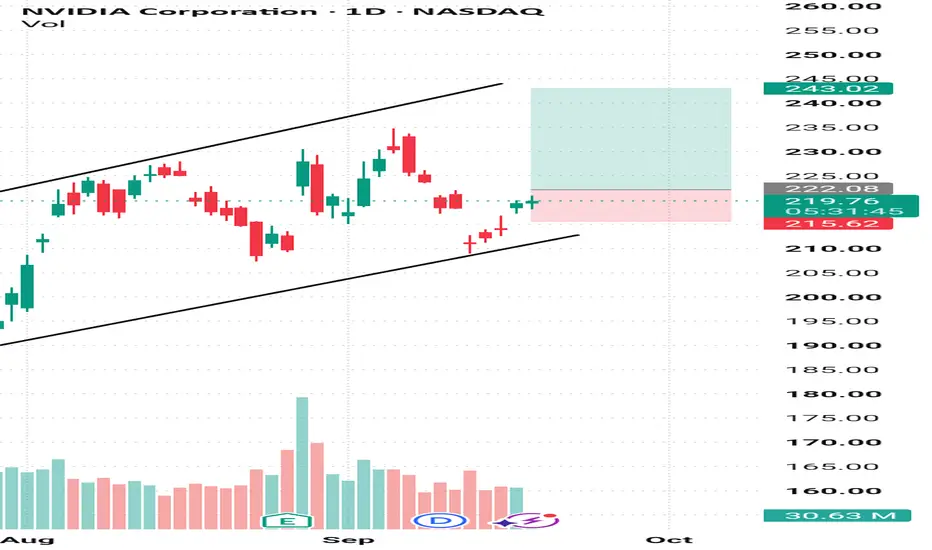
TradeStation Securities, Inc. and TradeStation Technologies, Inc. are each wholly owned subsidiaries of TradeStation Group, Inc., both operating, and providing products and services, under the TradeStation brand and trademark. When applying for, or purchasing, accounts, subscriptions, products and services, it is important that you know which company you will be dealing with. Visit www.TradeStation.com for further important information explaining what this means. NVDA Is Back at $220 — But Can It Break the Next Wall?The FOMC reaction created a sharp pullback in NVDA, but buyers stepped back in quickly. Now price is back around $220, and this is where I think the next move starts to become interesting.
📊 My setup
On the daily chart, NVDA is trading around $220.42 inside an upward channel.
The first level I’m watching is $222.08. A clean break and hold above that level would give me more confidence that buyers are ready to push the stock higher.
If that happens, my next area of interest is around $243, which lines up with the upper part of the channel.
I’m not interested in buying just because price is moving up. I want confirmation first.
⚠️ What would change my view?
The level I’m watching on the downside is $215.62. If NVDA loses that area and starts trading below the lower part of the channel, I’d step back and reassess the setup instead of forcing a trade.
The FOMC decision also reminds me why these levels matter. The Fed raised rates by 25bps to 3.75%–4.00% on Sept. 16, and the following session saw a broad tech-led rebound.
💡 Why I’d trade this on Bitget
For an event-driven setup like NVDA, I want flexibility. Bitget gives me access to NVDAUSDT stock perps 24/7, so I’m not limited to the traditional U.S. stock market hours. Bitget also supports both long and short positions, which gives me a way to trade either direction when the setup changes.
Another thing I like is having Stocks, CFDs and Crypto on the same platform instead of moving between different exchanges when the market changes. Bitget’s stock perps are USDT-margined, so I can manage the position from the same trading environment I already use for crypto.
Liquidity matters too, especially around major U.S. market events. The campaign’s comparison highlights Bitget’s U.S. stock perp liquidity against Binance, OKX, Bybit and Hyperliquid. For me, that matters because a good setup is only useful if I can execute it properly.
🎯 My plan
Above $222.08 → watch for continuation toward $243.
Below $215.62 → bullish setup needs to be reassessed.
For now, I’m waiting for price to show me which level it wants to break rather than predicting the move.
Not financial advice Long