Long
Long
 Long
Long
MBUU Below Book Value: Can Saxdor Turn Malibu Boats Into a GlobaNASDAQ:MBUU is one of the more interesting traditional-business turnaround setups I’m watching.
The stock trades around 0.95x book value, which looks cheap on paper, but FY2026 fundamentals were weak. Net income dropped 88.8% to about $1.7M even though revenue rose 13.3% to $914M.
The key issue was margin pressure.
Gross margin fell to around 16%, while acquisition costs, higher labor expenses and Saxdor-related integration costs weighed heavily on profitability.
But FY2027 could look very different.
Management expects revenue of roughly $1.08B–$1.12B, or 18–22% growth, and adjusted EBITDA of $101M–$109M, implying 37–48% growth.
The main catalyst is Saxdor.
Saxdor was only consolidated for about four months in FY2026, but a full-year contribution could materially change MBUU’s revenue mix. It also gives Malibu access to 100+ dealers across 50 countries.
My current framework:
Attractive buy zone: $23.97–$25.91
Short-term downside risk: $23.09
First take-profit / gap area: $34–$38
Turnaround fair value: ~$42.30
The $34–$38 gap is important to me because it could become a faster take-profit zone if MBUU rerates on improving sentiment before the full turnaround is reflected in earnings.
In other words, I would not necessarily wait for $42.30 if the stock quickly fills that gap while fundamentals are still in the early stages of recovery.
The risks are still meaningful: higher rates, expensive fuel, tariffs and execution around integration.
My view: MBUU is not a “cheap because PBV is below 1x” story. It only gets interesting if Saxdor helps restore margins and growth.
If the turnaround starts working, $34–$38 could be the first realistic profit-taking zone, while $42.30 remains the more optimistic fundamental fair-value case.  Long
Long
SpaceX Gains Weight in the Nasdaq 100
Ion Jauregui – Analyst at ActivTrades
SpaceX faces a significant increase in its weighting in the Nasdaq 100, which could rise approximately from 1.28% to 2.82% in the September rebalancing.
The adjustment is mainly due to the increase in free float following the release of more than 1 billion shares that remained subject to restrictions after the IPO.
The higher weighting will force funds and ETFs that replicate the Nasdaq 100 to increase their exposure to SpaceX. JPMorgan had previously estimated that a weighting close to 2.25% could generate around $15.5 billion in net purchases.
However, the increase in passive demand will coincide with new share unlocks over the coming months, which will also increase the supply available in the market.
Fundamental Analysis
SpaceX maintains a strong growth rate, supported mainly by Starlink, while continuing to increase investment in Starship and technological infrastructure.
The company reported revenue of approximately $7.8 billion in the second quarter of 2026, with year-on-year growth of close to 92%, while adjusted EBITDA exceeded $3.5 billion.
The main challenge remains the high capital intensity. The company’s valuation, above $2 trillion, incorporates very high growth expectations, meaning that the performance of Starlink, Starship, and the ability to turn investment into profitability will be key over the coming quarters.
Technical Analysis of SpaceX, SPCX
The SPCX price has maintained a sideways structure since August 11 and closed at around $151.21, while in premarket it is trading near $147.26.
The price is approaching the 25% Fibonacci retracement, calculated from the move that began on July 14, with a technical reference around $148.
The MACD maintains a slightly positive trend, although with a low-amplitude histogram, while the RSI is close to 59%, showing a progressive recovery in momentum since mid-August.
The $148 area remains the immediate support, while a recovery above $155 would reinforce the bullish continuation scenario.
Technical Analysis of the Nasdaq 100
The Nasdaq 100 maintains a positive medium-term structure, although with lower momentum in recent sessions.
The 29,100 to 29,200-point area represents the immediate technical support, while the 29,550 to 29,650-point area represents the main short-term resistance.
The increase in SpaceX’s weighting will have a direct effect on vehicles that replicate the index, although its aggregate impact on the Nasdaq 100 will remain limited compared with the performance of the major technology companies.
Outlook
The rebalancing represents a favorable technical catalyst for SpaceX in the short term, by generating additional demand from passive funds. However, the progressive increase in free float and upcoming share unlocks could offset part of this effect.
The $148 area will be the main technical reference in the short term.
*******************************************************************************************
The information provided does not constitute investment research. The material has not been prepared in accordance with the legal requirements designed to promote the independence of investment research and such should be considered a marketing communication.
All information has been prepared by ActivTrades ("AT"). The information does not contain a record of AT's prices, or an offer of or solicitation for a transaction in any financial instrument. No representation or warranty is given as to the accuracy or completeness of this information.
Any material provided does not have regard to the specific investment objective and financial situation of any person who may receive it. Past performance and forecasting are not a synonym of a reliable indicator of future performance. AT provides an execution-only service. Consequently, any person acting on the information provided does so at their own risk. Political risk is unpredictable. Central bank actions can vary. Platform tools do not guarantee success.
Simple Investing: Stop Putting All Your Money Into One Entry
One of the most common mistakes investors make is surprisingly simple:
They invest all of their planned capital at a single price.
They find a stock they like, decide that the current price looks attractive, and enter the entire position at once.
But what happens if the market moves lower?
Suddenly, there is no flexibility left.
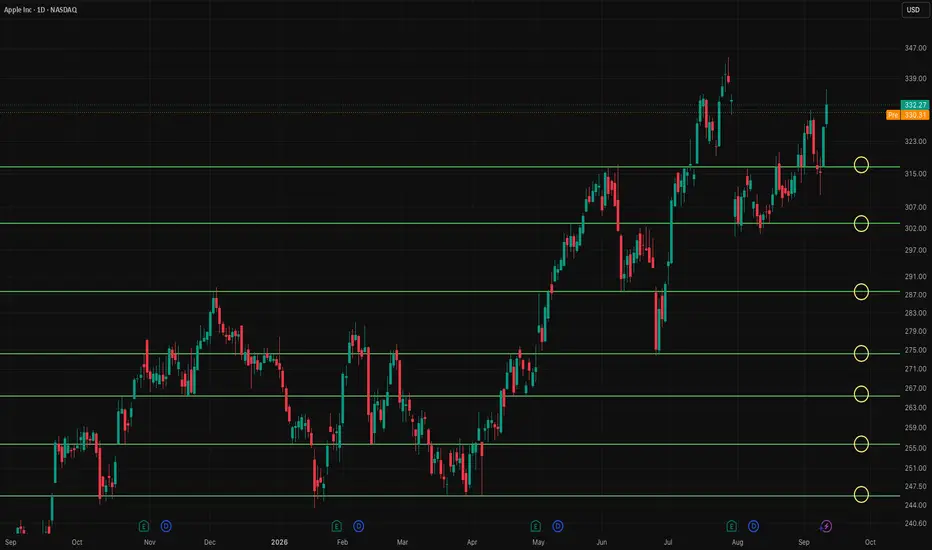
Let’s use Apple (AAPL) as a simple example.
🎯 You Don’t Need to Find the Perfect Entry
Looking at the chart, we can identify several important price zones where Apple has previously reacted.
These areas can act as potential support and resistance levels .
Instead of asking:
“What is the perfect price to buy Apple?”
A more useful question could be:
“At which price levels would I be interested in gradually building a position?”
That small change in thinking can make investing much more structured.
💰 Divide Your Capital Instead of Your Attention
Imagine you have a certain amount of capital that you have already decided to allocate to Apple.
You don’t necessarily have to deploy all of it immediately.
Instead, that capital could be divided into several portions.
On the chart, we can see potential areas around:
$316 → $303 → $288 → $275 → $266 → $256 → $246
These aren’t predictions that Apple will reach those prices.
And they aren’t automatic buy signals.
They are simply predefined areas that can help create a plan before emotions enter the equation.
If the stock continues higher, you already have exposure.
If it moves lower, you still have capital available to evaluate opportunities at lower levels.
📉 A Falling Price Doesn’t Automatically Mean a Better Investment
There is one important distinction.
Dividing capital across different levels does not mean blindly buying every time a stock falls.
Support can break.
Market conditions can change.
And the fundamental reason for owning a company can change as well.
Technical levels should therefore be viewed as part of a broader decision-making process — not as guarantees.
🧠 The Real Advantage Is Having a Plan
Investing doesn’t always need complicated indicators or dozens of signals.
Sometimes a chart, a few meaningful price levels and a predefined capital allocation plan are enough to bring structure into the process.
Instead of trying to predict the exact bottom, you prepare for multiple possibilities.
If price stays strong → you already have exposure.
If price pulls back → you know which areas you want to reassess.
If the market structure changes → you can reconsider the plan.
That’s a very different approach from putting everything into one entry and hoping the timing was perfect.
The takeaway
Don’t obsess over finding the perfect entry.
Identify meaningful areas, decide beforehand how much capital you are willing to allocate, and keep enough flexibility to react if the market gives you another opportunity.
Sometimes, investing can be much simpler than people make it.
This analysis is for educational purposes only and does not constitute financial or investment advice. The levels shown are examples based on the chart and should not be interpreted as recommendations to buy or sell Apple.  Long
Long
Schaeffler: Is the Market Still Pricing a Humanoid Robotics SuppI started looking at Schaeffler ( XETR:SHA0 ) as a traditional German automotive supplier. The deeper I went into the company’s humanoid robotics strategy, the more interesting the valuation disconnect became.
This is not a “humanoid robots will change the world, buy everything” thesis. The company still has real problems: high debt, weak free cash flow and a difficult automotive/e-mobility transformation.
But there is another business developing inside Schaeffler that appears to receive relatively little attention.
1. Humanoid robotics is already moving from R&D to contracts
Schaeffler says it is working with roughly 45 humanoid robotics developers globally and had already signed five contracts by May 2026. Management expects humanoid-related orders to reach the hundreds of millions of euros by 2030.
Its partnership with Humanoid is particularly interesting. Schaeffler became a preferred supplier for more than half of Humanoid’s joint-actuator demand, with the agreement covering at least one million actuators through 2031.
Schaeffler also plans to deploy Humanoid robots inside its own factories, effectively becoming both supplier and customer of the ecosystem.
2. The ecosystem is expanding
Schaeffler has announced humanoid partnerships with:
• Humanoid
• Hexagon Robotics
• Leju Robotics in China
• VinDynamics in Vietnam
The Hexagon agreement includes high-precision strain-wave and planetary actuators, while Schaeffler intends to deploy roughly 1,000 AEON humanoids across its manufacturing network over the coming years.
This is important because Schaeffler is not trying to pick which humanoid OEM wins. It is positioning itself as a motion-component supplier to multiple competing platforms.
3. Management has been buying shares
Several management transactions occurred around current price levels.
Astrid Fontaine, a member of the Management Board, reported acquisitions at approximately €7.30–€7.50, including one transaction of about €219k.
Jens Willem Schüler acquired approximately €659k of Schaeffler shares on Xetra in December 2025 at an average price of roughly €7.58.
Insider buying does not guarantee future returns, but I find it interesting that some management capital has been deployed around the same valuation area where the shares currently trade.
4. Why might the market be discounting it?
There are good reasons.
H1 2026 revenue was about €11.7bn and adjusted EBIT margin improved to 4.7%, but free cash flow was -€300m.
Net financial debt reached approximately €5.55bn, or about 2.4× EBITDA.
In other words, this is not a clean robotics growth stock. The legacy business and balance sheet matter.
And that may be exactly where the potential asymmetry comes from.
Today the market can reasonably view Schaeffler as a leveraged automotive/industrial supplier.
My question is:
What happens to the valuation if humanoid robotics becomes a meaningful high-growth portion of earnings over the next 3–5 years while debt and e-mobility losses decline?
The thesis does NOT require Schaeffler to become the next Nvidia or Micron.
It only requires the market to eventually assign a different multiple to a company increasingly exposed to robotics, automation and precision motion systems.
What I am watching:
• humanoid order growth
• conversion of prototypes into series-production contracts
• robotics revenue becoming visible in segment results
• EBIT margin improvement
• net debt reduction
• additional management purchases
Bear case: humanoid adoption develops slower than expected, automotive weakness continues, debt remains elevated and robotics never becomes large enough to materially move group earnings.
Bull case: Schaeffler becomes one of the major “picks and shovels” suppliers of the humanoid ecosystem while the market continues to value it primarily as an automotive supplier.
I currently own Schaeffler shares. This is my personal research and not investment advice. I am sharing the thesis because I would genuinely like to hear arguments against it.
What am I missing?  Long
Long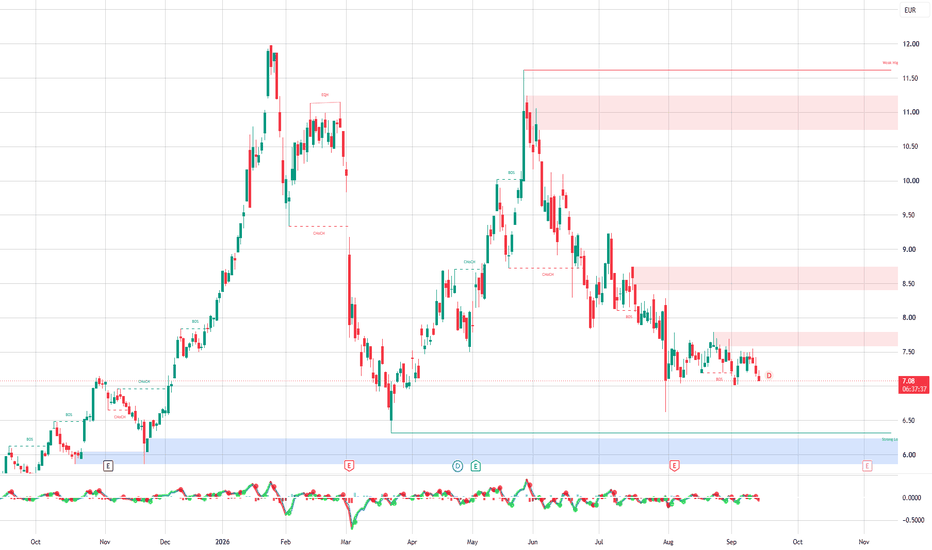
 Long
Long
What Does ASML See in Xanadu After an 80% Crash?Xanadu Quantum Technologies (XNDU) reached public markets in March 2026 through a merger with Crane Harbor Acquisition Corp, at an initial enterprise value of $3.1 billion. Shares peaked at $42.44 in April before the deep-tech valuation reset arrived. Elevated policy rates drained risk capital from pre-revenue science companies, and investors rotated toward near-term cash generation. By September 2026, the stock traded near $8.62, roughly 80% below the high, with market capitalization around $2.62 billion. Pending insider lockup expirations continue to cap any recovery in share price momentum.
The income statement explains the skepticism. Second-quarter revenue reached $1.5 million, up from $1.1 million a year earlier, sourced mainly from algorithmic research contracts and software grants. Net loss widened to $42.1 million, with research and development alone consuming $19.7 million. Liquidity, however, remains unusually strong for a company at this stage. Xanadu held $312.8 million in cash at the end of June and raised a further $67.2 million through a synthetic equity facility with Yorkville Advisors. Ottawa added CAD $195 million under Project OPTIMISM, funding a sovereign 158,000-square-foot photonic fabrication plant in Ontario.
The industrial side of the story moves in the opposite direction from the share price. ASML agreed to optimize deep-ultraviolet lithography for photonic quantum hardware, targeting smoother waveguide sidewalls and lower Rayleigh scattering. That work attacks the single metric that governs error-correction overhead, which Xanadu aims to cut from 24.1x to 1.0x by 2030. Tower Semiconductor now produces ultra-low-loss silicon nitride wafers on commercial lines, while EV Group refines wafer bonding. AMD and Xanadu launched Backline, linking quantum processors to EPYC CPUs and adaptive FPGAs inside a sub-three-microsecond feedback loop. Fifty patent families across the US and Europe protect the underlying continuous-variable architecture.
Software mindshare completes the case. PennyLane commands over 35,000 active users, 200,000 monthly downloads, and a 30.8% developer market share, which positions Xanadu as the default toolchain regardless of which hardware eventually wins. The roadmap targets 200 logical qubits by 2029 and more than 1,000 by 2031, a timetable that also drives government post-quantum cryptography planning. The equity market prices quarterly losses, while ASML, Tower, and AMD price a decade of infrastructure. Investors with long horizons face a widening gap between the tape and the technical execution.  Long
Long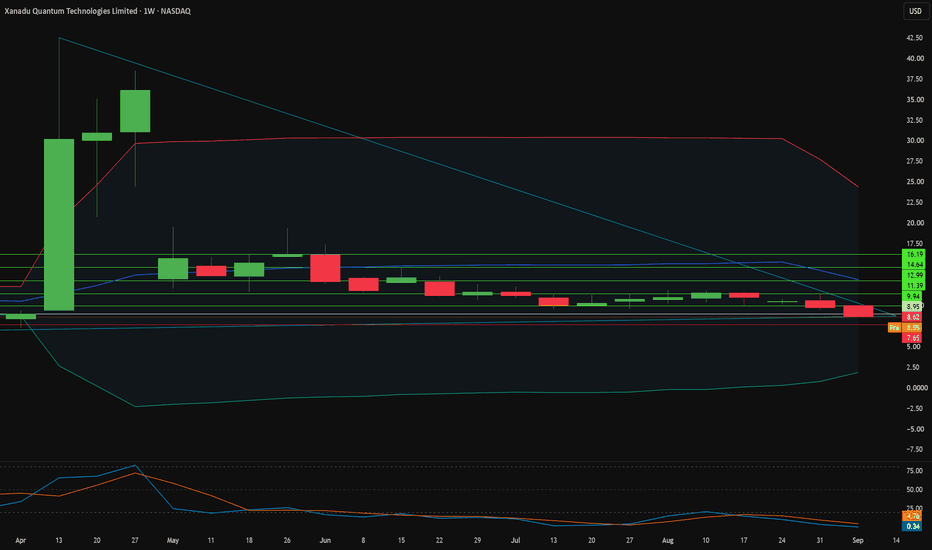
 Long
Long
 Long
Long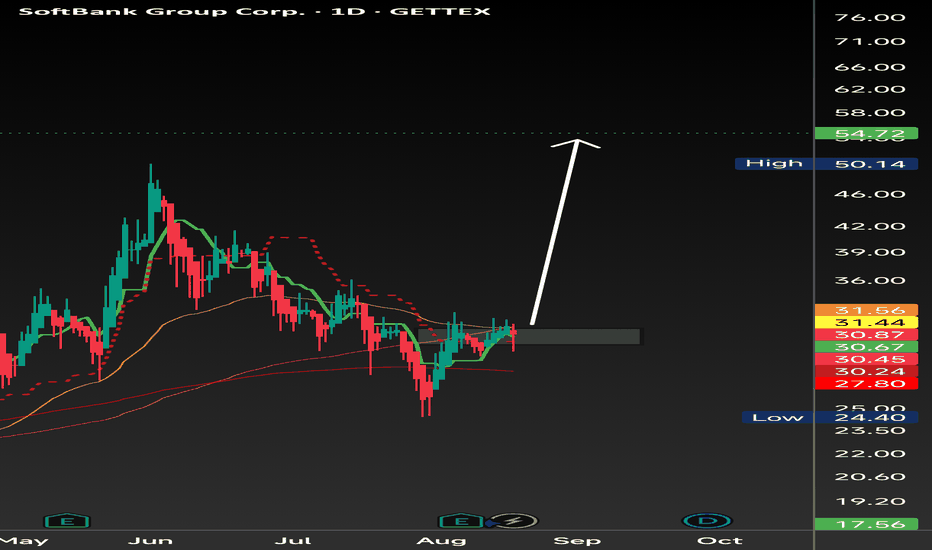
AI Over-reaction to non-infrastructure changes (SNDK)Week 9/14/26:
- Semi / AI pull back into near area support levels on 4H and daily (breaking news of AI leaders "pulling back on AI models". This does not affect infrastructure, only their public models capabilitie; appears to be an over reaction going into a highly volatile week (FOMC, AI news, Iran escalations, Russia escalations, Oil and 10year rising outside of ranges).
Expectations:
Look for price at support levels around 1475 - 1500, and expecting a bump back to the 1700s around thursday or friday after FOMC rates being unchanged. (estimated return to prior week area based; assumption that Fed rate is unchanged)
- This is a drop and rally; over reaction to a surface level change, not a fundamental infrastructure change in demand. (AI model "pullback" is not a change to the demand for Data centers, chips, memory etc. Nothing from any of these frontier models or hyperscalers said they are reducing demand or losing contracts. The downside here is that this may take more than a week to return to 1700s region)
Entry Ideas:
- Play; 1DTE or 0DTE options (Depending on price) plays based on momentum going into the first hour of the trade day. (Thurs and Fri).
--- This can be a call or put nakeds, or spreads, and ENTIRELY DEPENDS on momentum going into thursday.
-----Why thursday? because SNDK options are expensive and I dont want to burn thousands for a single option to theta. We play 1DTE and 0DTEs here because SNDK has an ATR of $50+ a day right now and makes for good momentum trading.
- Will have to wait to see how everything reacts through Wednesday and Thurs premarket. My estimates are it will pop back towards the 1700s, so biased Long.  Long
Long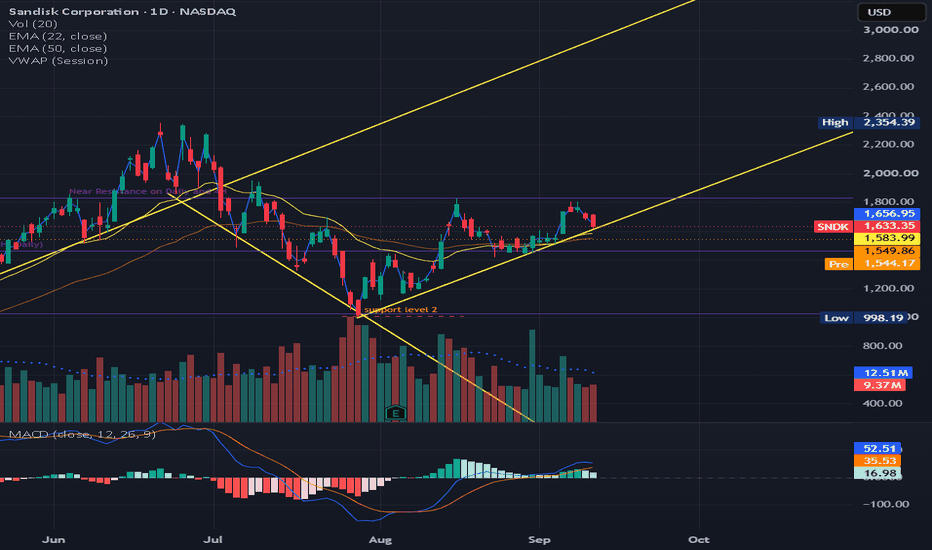
 Long
Long
 Long
Long
 Long
Long
 Long
Long
 Long
Long
What Peter Lynch Saw FirstPeter Lynch became one of the most respected investors of his generation by doing something that sounds simple but is extremely difficult: finding businesses that were worth more than the market believed. From 1977 to 1990, he managed the Fidelity Magellan Fund and generated an exceptional long-term return. His approach was not about predicting every market move or finding the next hot stock. It was about understanding businesses, identifying changes in their fundamentals, and recognizing when the market had not yet fully appreciated those changes.
1. Fannie Mae: Seeing Value Others Missed
Fannie Mae became one of Peter Lynch's most successful investments and reportedly generated hundreds of millions of dollars in profit for Magellan. What made the investment interesting was not simply that the stock eventually went higher. Lynch kept studying the company's improving fundamentals and became increasingly convinced that the market was undervaluing its earning potential. He increased his position as his thesis became stronger. The lesson is important: a rising stock is not automatically a reason to sell if the business is improving even faster. Lynch was watching the company, not just the chart.
2. Ford: Understanding the Cycle
Ford showed another side of Lynch's investment style. The automobile industry is highly cyclical, which means earnings can change dramatically as economic conditions improve or deteriorate. Lynch recognized that Ford's earnings outlook was improving and understood that the market was beginning to revalue the company. Instead of assuming that a stock had become too expensive simply because it had already risen, he looked at whether the underlying business justified the new valuation. His approach highlights an important distinction: the question isn't simply whether a stock has gone up, but whether the company's future has improved enough to support the higher price.
3. Philip Morris: Finding Opportunity in an Unpopular Business
Philip Morris was another major winner for Magellan, and it demonstrated Lynch's willingness to invest in businesses that were not necessarily popular with the public. The company had powerful consumer brands and strong cash-generating characteristics, but its reputation could easily make investors overlook the underlying economics. Lynch focused on the business rather than the emotional reaction surrounding it. This is an important investing lesson because a company does not need to be admired to be a good investment. Sometimes the greatest opportunities exist where the business is stronger than the perception surrounding it.
4. MCI: Following Structural Growth
MCI gave Lynch exposure to the rapidly changing telecommunications industry and became one of Magellan's important successful investments. The opportunity was connected to a broader structural shift in the industry, where competition and technology were changing the way telecommunications businesses operated. Lynch understood that strong growth could create significant investment opportunities when the market had not fully priced the future potential. The key wasn't simply buying a company because its industry was growing. Lynch needed to understand how that growth translated into revenue, earnings and ultimately shareholder value.
5. Volvo: Looking Beyond the Obvious
Volvo demonstrated that Lynch was not restricted to familiar American companies. The Swedish automobile manufacturer became another meaningful contributor to Magellan's performance. International investing gave Lynch access to businesses that could be overlooked by investors focused entirely on the US market. But geographical diversification alone was not the reason for the investment. Lynch still needed to understand the company's business, competitive position and earnings potential. The lesson is straightforward: “invest in what you know” does not mean investing only in companies from your own country. It means refusing to invest in something you cannot understand.
The Pattern Behind the Winners
These five investments came from completely different industries, yet they shared something important. Lynch was constantly looking for a gap between **what the business was becoming and what the market believed it was worth**. Sometimes that gap came from improving earnings, sometimes from a cyclical recovery, sometimes from structural growth and sometimes from an unpopular business being underestimated. The industry itself was not the secret. The ability to recognize a change in the underlying business was.
That is where Lynch's philosophy becomes more interesting than the usual “buy what you know” advice. Seeing a popular product or a successful company is only the beginning. The real work starts when you ask why the company is succeeding, whether that success can continue, what the market already expects, and whether the current valuation leaves room for further upside. A great company can still be a terrible investment if everyone has already priced in its success.
The Real Peter Lynch Lesson:
Lynch did not need to predict exactly where the market would go next. He needed to find situations where reality could turn out to be better than expectations. That is why his biggest winners were not simply stocks that went up. They were businesses where the fundamental story became stronger than the market initially anticipated.
The most useful lesson from Peter Lynch is therefore not to copy his old stock picks. Fannie Mae, Ford, Philip Morris, MCI and Volvo belonged to a different market and a different era. The better lesson is to ask the same question Lynch was asking decades ago:
What is changing inside this business that the market may not have fully recognized yet?
That question is still relevant today.
By @BrightRally_Research  Education