Long
Long
 Long
Long
Tesco — Downside Pressure Building Toward 430Tesco is currently displaying a fragile price structure, with the latest movement favoring the bearish side. The market is showing persistent weakness, and the prevailing setup suggests that the stock may have further room to depreciate before reaching the 430 target region.
The current price behavior indicates that upward recoveries are facing resistance, while downward moves are gaining greater traction. This imbalance keeps the selling scenario active and increases the probability of another leg lower if the present structure remains intact.
From the chart perspective, 430 stands out as the primary downside destination. The route toward this level could develop through several stages, with intermittent rebounds possible along the way. However, unless the market produces a meaningful structural reversal, such recoveries may remain limited within the broader bearish framework.
The current formation is particularly notable because sellers are dictating the rhythm of the move. Lower pricing is being accepted by the market, while attempts to regain lost territory have not yet produced sufficient strength to change the overall outlook.
External factors such as UK consumer sentiment, retail-sector conditions, inflation expectations, household spending, currency fluctuations, and company-specific developments can influence Tesco's volatility. Nevertheless, the technical configuration currently keeps attention firmly on the downside.
The projected sequence is:
Existing weakness → renewed selling activity → further price erosion → 430 objective.
📍 Market Bias: Bearish
📉 Trade Direction: Sell
⚠️ Current Condition: Weakness prevailing
🎯 Projected Level: 430
🔻 Scenario: Continued downside
The chart remains under pressure, and 430 is the key level in focus while the bearish formation continues to unfold.  Short
Short
 Long
Long
Standard Chartered — Buyers Driving Toward 2627Standard Chartered is currently presenting a favorable bullish setup, with the latest price action indicating that buyers are gaining stronger control and creating scope for a continued advance toward the 2627 target area.
The underlying structure is showing positive development, with upward pressure becoming more prominent across the recent movement. Instead of displaying sustained weakness, price is maintaining a constructive trajectory that can support another leg higher as bullish participation continues to build.
The 2627 region is the principal upside objective for this analysis. A continuation of the current market behavior could allow the stock to progress through intermediate resistance levels and gradually extend its valuation toward the projected destination.
From a technical standpoint, the developing formation favors sustained appreciation. Buyers appear increasingly comfortable at higher levels, while bearish attempts have so far lacked the strength required to change the broader direction. This creates a favorable environment for the bullish scenario to remain active.
Standard Chartered's performance can also be influenced by global banking sentiment, interest-rate expectations, credit conditions, economic growth prospects, currency fluctuations, and developments across international financial markets. These factors may introduce volatility, but the current technical roadmap remains focused on the upside.
The projected progression is:
Positive structure → stronger buyer participation → continued appreciation → 2627 target zone.
📍 Bias: Bullish
📈 Trade Direction: Buy
🚀 Momentum: Positive
🎯 Target: 2627
⚡ Structure: Upside continuation
The chart continues to favor higher ground, with 2627 remaining the key projected destination as buyers attempt to extend the current advance.  Long
Long
 Long
Long
Vodafone — Buyers Positioning for a Move Toward 131Vodafone is currently showing a constructive upside formation, with price action indicating that buyers are gradually gaining stronger influence over the market. The recent behavior suggests that the stock has room to develop another upward phase, keeping the immediate outlook tilted toward the buying side.
The 131 level stands as the primary upside objective in this setup. Current momentum provides a basis for a continued advance, with price potentially progressing through intermediate levels as bullish participation strengthens.
From a technical perspective, the market is attempting to establish a healthier upward trajectory. The developing structure indicates that downside pressure is losing its previous influence, while demand is becoming more prominent. Should this character remain intact, the next meaningful expansion could carry Vodafone toward the projected 131 region.
The broader backdrop may also be shaped by telecommunications-sector sentiment, subscriber trends, competitive conditions, regulatory developments, financing costs, and wider equity-market behavior. These elements can affect the pace of appreciation, but the present chart structure remains oriented toward higher levels.
The anticipated progression is:
Current positioning → strengthening demand → upward extension → 131 objective.
📍 Bias: Bullish
📈 Direction: Buy
🚀 Momentum: Improving upside participation
🎯 Target: 131
⚡ Structure: Bullish continuation
The chart is gradually shifting the balance toward the buyers, with 131 remaining the principal upside destination for this setup.  Long
Long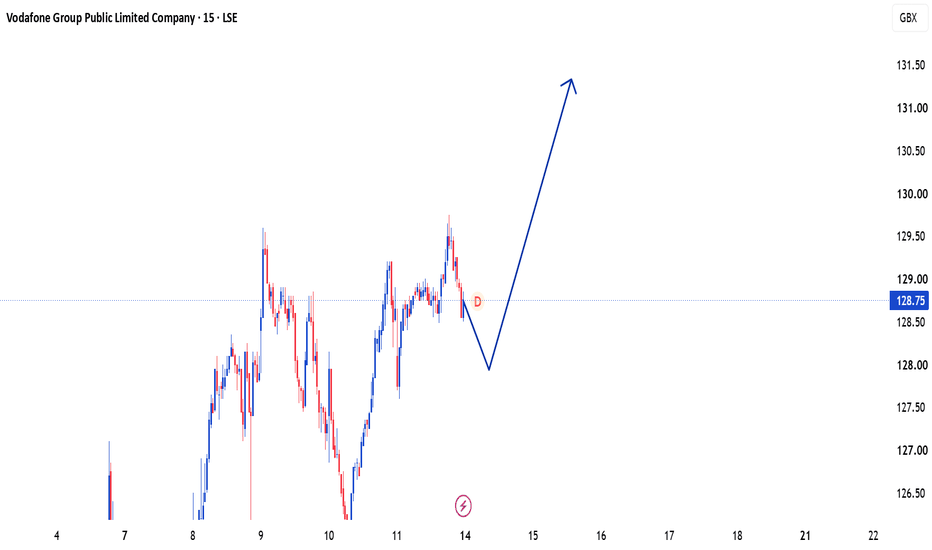
British American Tobacco — Downside Path Toward 3920British American Tobacco is currently developing a bearish setup, with the recent price behavior indicating that the stock remains vulnerable to additional weakness. The prevailing market tone is tilted toward the selling side, while upward attempts appear unable to establish a convincing reversal.
The technical picture points toward a continuation of the downward sequence, with 3920 emerging as the principal objective on the chart. As the current formation unfolds, further depreciation could take place before the market reaches this projected level.
Price action is presently reflecting a lack of sustained upside traction. The inability to regain stronger territory leaves the door open for another extension lower, particularly while bearish participation remains evident. Rather than treating the decline as a short-lived fluctuation, the structure suggests that sellers may continue pressing the valuation downward.
The broader environment can also influence British American Tobacco through consumer-sector sentiment, currency movements, regulatory developments, commodity costs, company-specific news, and changes in international equity conditions. Such factors may affect volatility and timing, while the chart continues to provide a clear downside framework.
The projected sequence is:
Current weakness → continued pressure from sellers → deeper retracement → 3920 target zone.
📍 Market Bias: Bearish
📉 Trade Direction: Selling
⚡ Price Structure: Downward
🔥 Momentum: Seller-led
🎯 Projected Objective: 3920
The market has established a vulnerable formation, and 3920 remains the key downside destination as British American Tobacco continues to face pressure from the selling side.  Short
Short
 Long
Long
Barclays — Sellers Driving the Next Leg Toward 472Barclays is currently showing a weak market structure, with the price action favoring the downside and the selling side maintaining control. The latest movement reflects increasing bearish pressure, suggesting that the stock could continue its decline toward the 472 target area.
The present formation indicates that upside attempts are struggling to generate enough strength to reverse the prevailing direction. Instead, each phase of the price action is keeping the broader trajectory tilted lower, creating the possibility of another downward extension.
From a technical standpoint, the 472 region is the key level in focus. A continuation of the existing bearish pattern could gradually push the stock through lower price levels as sellers maintain their influence. The setup therefore remains oriented toward capturing the next leg of weakness rather than anticipating an immediate recovery.
Market sentiment surrounding financial institutions, interest-rate expectations, economic conditions, credit activity, and broader equity performance can also affect Barclays' volatility. These external factors may alter the speed of the move, but the current chart formation continues to favor a negative trajectory.
The projected sequence is:
Current bearish structure → continued downside pressure → lower price development → 472 objective.
📍 Bias: Bearish
📉 Direction: Sell
🔥 Seller Control: Strong
🎯 Target: 472
⚡ Structure: Downside continuation
The chart is currently leaning decisively toward the lower side, with 472 remaining the major projected destination as Barclays continues to face selling pressure.  Short
Short
SHOP | Weekly Bullish, Daily Flip Zone DecidesBy analyzing the #SHOP (Shopify) chart, we can see a market where the weekly has already made its decision and the daily is deciding when.
1W Timeframe
Weekly chart:
The recovery from the 2022 lows was built internally — an i CHoCH , then repeated i BOS . In 2025 price broke the external swing high and printed a real CHoCH above CAD 220 . Internal breaks say a correction is progressing. An external break says the trend has changed hands.
Two protected lows frame the risk: CAD 33.26 external, CAD 99.87 internal — the working invalidation. Between them sits the weekly Order Block at CAD 123.03 – CAD 136.88 , which price returned into, reacted from, and rallied out of. That reaction is why the case is live.
Above, the resting liquidity at CAD 252.59 is the objective. Price is at CAD 178.41 — a correction inside an intact uptrend.
1D Timeframe
Daily chart:
Price ran out of the weekly block, printed a daily CHoCH , swept CAD 252.59 , and rolled over. It has now arrived at the Daily flip zone (CAD 155.69 – CAD 185.95) — resistance through July and August, support now — trading in the upper third of it.
The weekly says the direction. The daily says when.
The Bias
Bullish while price holds above CAD 99.87.
Scenario A. The flip zone holds and price continues toward CAD 252.59 . I want confirmation on the daily close first — an MSS from inside the zone, or a decisive bullish engulfing. A touch of the top edge is not a reaction.
Scenario B. Price works toward CAD 155.69 before turning. Same trade, better price.
Scenario C. A close beneath CAD 155.69 puts the weekly Order Block back in play as the deeper entry — not an invalidation.
Invalidation: a decisive close beneath CAD 99.87 .
And the rule: a break is a candle close, not a wick.
Fundamental Backdrop
Q2 2026 revenue of $3.58 billion , up 34% year over year, net income up 66%, margin expanding to 42%. AI-referred orders nearly 13x higher with conversion around 50% above organic search. Bernstein initiated at Outperform, Piper Sandler raised to $180, consensus near $171.
The counterweight: the stock fell nearly 8% in one session in early September on rotation out of high-multiple growth names — despite those earnings. P/E near 87 , down roughly 21% year to date.
A company compounding revenue in the thirties, repriced for multiple rather than performance. That is what produces a retracement this deep into structure — and why the confirmation matters more than the level.
This analysis will be updated as the market evolves.
Best Regards, BigBeluga 🐳  Long
Long
ORCL: Record $664B Backlog, Negative FCF — Wait for $138–147ORACLE (ORCL) — HOLD 54/100 · Data as of Sep 11, 2026 close ($150.28)
Record quarter, rejected by the market. Q1 FY27: RPO $664B (+$209B YoY), OCI revenue +121%, total revenue $19.3B (+30%). The stock gapped up 7.5% and reversed 10% intraday. Why: FY27 EPS guidance ($8.10) only matched consensus ($8.05), trailing free cash flow is −$23.7B, and ~$20B of stock was sold through an at-the-market program (~4.5% dilution in one quarter).
THE PLAN
• New position: don't buy today. Conditional buy zone $138–147, only with confirmation (hourly MACD turning up).
• Stop: daily close below $129.50.
• Take-profit 1: $170–184 · Take-profit 2: $200–215.
• My fair-value band: $165–200 (midpoint $182). Risk/reward from the zone: 2.65 : 1.
• Scale-in if triggered: 40% / 35% / 25%.
THREE GATES — 2 of 3 passed
✅ Valuation: forward P/E 18.6x, PEG 0.92.
✅ Thesis: backlog is real; cash conversion is not proven yet.
❌ Entry: price is 10.4% below the 200-day SMA ($167.64); hourly MACD negative.
WHAT ACTUALLY MOVED THE PRICE (12 months, $232.80 → $150.27)
Nine major events add up to −$40.6. The other −$41.9 is drift between events — only half of the decline can be tied to a headline.
Story events were all given back: RPO reveal +$59.4, new AI contracts +$36.9, second peak attempt +$41.7.
Cash events stuck: financing concerns −$24.1, Q2 revenue miss −$27.6, negative FCF revealed −$99.3 (largest single hit).
INSIDERS
• Zero open-market buys in the last 12 months — checked against raw SEC Form 4 XML (49 filings), Alpha Vantage, Massive and Dataroma.
• 30 sales, $140.2M. 14 of them ($45.2M) were NOT under 10b5-1 plans, led by the CEO.
• The last two insider buys (Jul 2025 at $233.87, Feb 2025 at $172.35) are both underwater, and neither buyer averaged down.
• Larry Ellison: the 10-Q disclosed a 10b5-1 plan (adopted Jun 22) to sell up to 50M shares (~$7.5B). On Sep 12 Oracle announced it was cancelled with no shares sold.
ANALYSTS vs PRICE
• 45 analysts: 36 Buy / 8 Hold / 1 Sell, average target $243.97.
• But the MarketBeat consensus target fell from $297 to $256 over 12 months while the stock fell 48.6% — most of the "upside" is stale targets, not new conviction.
• EPS estimates are rising: FY27 $8.04 → $8.13, 3 upward / 0 downward revisions in 30 days. The problem is trust, not earnings.
• Lowest target: CLSA $145 (Hold), below today's price.
SENTIMENT SPLIT
Retail (Stocktwits) 91/100 extremely bullish vs. Danelfin's AI model 3/10. TradingView ideas this week: 4 long / 3 short / 3 neutral.
DECISION TREE
Price reaches $147 → Is the thesis broken (another equity raise, RPO decline)?
• Yes → don't buy, wait for the Dec 9 earnings.
• No → trend check: decline continuing → wait; decline stopped and confirmed → scale in.
KEY DATE: Dec 9, 2026 — Q2 FY27 earnings (EPS guide $1.85–1.93). The next durable move up needs improving free cash flow, not another contract headline.
What would change my view: a daily close below $129.50 (bearish) · positive FCF trend or the ATM program ending (bullish).
Not financial advice. Personal analysis for educational purposes.
SBINSBIN — CONSOLIDATED MTF TRADE PLAN
Trade architecture
Entry 1: ₹991
Entry 2: ₹961
Average Entry: ₹976
SL: ₹933
Target: ₹1,164
At ₹976 average:
Risk: ₹43/share
Reward: ₹188/share
Gross RR: 4.37 : 1
Last high: ₹1,121
Target ₹1,164 requires a breakout beyond the previous high, so ₹1,121 is the first major confirmation/resistance point.
SBIN has a clear bullish alignment across HTF, MTF and ITF. The strongest technical feature is the repeated ₹940–₹961 demand zone appearing on Weekly, Daily, 240M, 180M and 60M.
Structure: HTF UP → MTF UP → ITF UP
Primary demand: ₹940–₹961
Key Gann level: ₹950
Breakout confirmation: ₹991
Invalidation: ₹933
Trade: Accumulate around ₹950–₹961, with ₹976 as the planned average entry. The ₹991 level should be treated more as confirmation than as the preferred fresh entry because risk increases above the demand zone.
From ₹976, risk to ₹933 is ₹43/share, while the primary target at ₹1,164 offers ₹188/share, giving approximately 4.37:1 price RR.
The trade should be managed in stages: ₹991 → ₹1,121 → ₹1,164. ₹1,121 is particularly important because it is the previous high; a sustained break above it strengthens the case for ₹1,164 and potentially the larger trend level at ₹1,234.
Bottom line:
₹940–₹961 = demand/accumulation zone | ₹950 = key reaction price | ₹970–₹991 = strength confirmation | ₹933 = hard invalidation | ₹1,121 = first major hurdle | ₹1,164 = primary target | ₹1,234 = extension.
The ₹940–₹961 multi-timeframe confluence is the core reason for the trade. Above ₹933, the bullish structure remains valid; below ₹933, the MTF setup should be considered invalid.  Long
Long
MARUTIMARUTI — MULTI-TIMEFRAME DEMAND & TRADE PLAN
1. MASTER DEMAND STRUCTURE
Level Timeframe Demand Zone Logic Trend
HTF-1 Yearly 9,737–13,680 Rally → Base → Rally UP
HTF-2 Half-Yearly 12,225–13,461 Rally → Base → Rally UP
HTF-3 Quarterly 10,725–13,461 BUFL / DMIP UP
MTF-1 Monthly 10,725–11,518 DMIP UP
MTF-2 Weekly 12,016–12,535 DMIP UP
MTF-3 Daily 12,201–12,424 DMIP UP
ITF 240M / 180M / 60M 12,201–12,424 DMIP UP
2. KEY CONFLUENCE
The 12,201–12,424 zone is the heart of the setup.
It is confirmed simultaneously by:
DAILY + 240M + 180M + 60M
and sits inside the Weekly demand zone of 12,016–12,535.
So the structure is:
HTF Structural Demand
↓
Weekly Demand: 12,016–12,535
↓
CORE EXECUTION DEMAND: 12,201–12,424
↓
ITF Confirmation: 240M / 180M / 60M
This is the strongest argument in favour of the trade.
3. TRADE EXECUTION
Entry 1: 12,424
Entry 2: 12,200
Average Entry: 12,312
Stop Loss: 12,201
Risk: 111 points
Target: 14,894
Reward: 2,582 points
Gross RR: 23.3 : 1
After the stated costs/interest assumptions:
Net RR: 14.72 : 1
4. PRICE ROADMAP
12,201 — SL / immediate invalidation
⬆
12,200–12,424 — 🔵 CORE DEMAND
⬆
12,312 — Average Entry
⬆
12,913–13,267 — 🟡 Gann Confluence
⬆
14,598 — Previous High
⬆
14,894 — 🎯 Trade Target
⬆
17,373 — Trend High
⬆
22,730 — Position Target
5. CAPITAL & PROFIT PLAN
Quantity: 200 shares
Total buy value: ₹24.62 lakh
MTF capital requirement: ₹8.62 lakh
Gross profit at 14,894: ₹5.16 lakh
Net profit after brokerage/taxes: ₹5.04 lakh
Interest: ~₹50,990
Final estimated net profit: ₹4.53 lakh
6. ONE-LINE INVESTMENT THESIS
MARUTI remains structurally bullish across HTF, MTF and ITF, with strong demand confluence at 12,201–12,424; an average entry near 12,312 offers tightly controlled downside versus a potential move toward 14,894 and beyond.
7. THE PPT HERO MESSAGE
MULTI-TIMEFRAME DEMAND CONFLUENCE
9,737–13,680 → Yearly
12,225–13,461 → Half-Yearly
10,725–13,461 → Quarterly
12,016–12,535 → Weekly
12,201–12,424 → DAILY + 240M + 180M + 60M
12,312 → Average Entry
12,201 → SL
14,894 → Target
BULLISH STRUCTURE | TIGHT INVALIDATION | ASYMMETRIC UPSIDE  Long
Long
HOOD - Start of the Breakout A few weeks ago, I outlined that Robinhood was nearing the start of its bull market. That idea can be found here:
Since then, price has broken out on the weekly and is currently retesting old resistance as new support. What is particularly significant from that last post is the RSI. The weekly RSI has broken above the white trendline I had outlined and is now testing it as a new level of support as well. If HOOD can show strength on the RSI this week, it would be a perfect bounce, and the true breakout would begin.
Why I'm Focusing on the 2-Day Chart
That is what this post is about. I made this idea on the 2-day timeframe, as I believe it provides a clearer view of the current situation.
Price has recently broken the resistance that had been holding it down since October 2025. Now, price has come back down and is testing that same level, where sellers previously dominated the trend, as a new level for buyers to take control. Adding to this, price has created a 2-day reversal doji, which could signal a move back to the upside. This is likely to begin the push back toward the $150 level.
Why the RSI Is the Key Metric
That said, the RSI remains the most important technical metric I am watching right now to confirm this breakout. There has been a clear downward resistance level (red arrows) where strength has repeatedly diminished, along with a clear support trendline (green arrows) where strength has repeatedly recovered.
Because of this, watch for the 2-day RSI to close above the upper white trendline. That would help build the momentum necessary to push price toward the upper target.
On the other hand, if this ends up becoming a failed breakout for whatever reason, it will be important to shift attention to the lower support trendline instead.  Long
Long
 Long
Long
 Long
Long
 Short
Short
 Long
Long
 Long
Long