• Products
  • Community
  • Markets
  • Brokers
  • More
Get started
  • Markets
  • /World stocks
  • /Ideas
$VNOM – The Permian's "Cash Flow King" Testing 2026 Breakout!⛽⛽⛽ The Business Model: Unlike traditional drillers, Viper doesn't spend a dime on rigs or fracking. They own the mineral rights to over 12,500 net royalty acres in the Permian Basin. When giants like Diamondback Energy or ExxonMobil pump oil on their land, Viper takes a cut of the revenue with zero capital expenditure. This results in industry-leading gross margins of nearly 98%. As of February 17, 2026, NASDAQ:VNOM is trading at **$44.25** and yielding a massive 5.37% - 5.77%. Because they have almost no overhead, they are a "dividend machine," with projections suggesting the distribution yield could climb as high as 7.4% later this year as new production from their 2025 "Drop-Down" acquisition goes live. The Technical Squeeze: NASDAQ:VNOM is currently consolidating in a ascending channel. After bouncing off the **$36.00 support level** in January, it has reclaimed its 200-day moving average ($38.83) and is now eyeing the channel resistance at $64.00. The Analyst Consensus: Wall Street is nearly unanimous on this one. 13 out of 15 analysts rate NASDAQ:VNOM as a "Buy," with a high-end price target of **$72.00**—representing a potential 62% upside from current levels. Why this is a "Solid" Buy at Support: Debt-Free Growth: Viper recently sold off non-core assets to slash their debt-to-capital ratio to just 12%, making them one of the most financially stable players in the entire energy sector. Intrinsic Value: While the stock trades at $44.25, Discounted Cash Flow (DCF) models estimate the "intrinsic value" of their mineral rights at closer to $101.20 per share. You're essentially buying the land at a 58% discount. The "Diamondback" Moat: About 59% of their revenue comes from wells operated by their parent company, Diamondback Energy, giving them a "front-row seat" and predictable visibility into future drilling schedules that other royalty companies lack.
NASDAQ:VNOM
by BallaJi
Updated
$INDUSTOWER: From "Debt Trap" to Growth King?🚀💎 Is NSE:INDUSTOWER a solid Double play for the next 18 months? While many have ignored it, the fundamentals have quietly shifted from "Survive" to "Thrive." Here’s why the 2x move is on the table: 1. The Vi "Resurrection" 📈Forget the old drama. Vodafone Idea (Vi) is no longer a liability—it's a growth engine.Debt Fixed: Vi’s 16-year debt freeze means they finally have cash to pay Indus. No Overdues: Management confirmed zero pending payments from Vi in Q3. New Business: Vi’s ₹45,000 Cr expansion means 15,000+ new tenancies for Indus towers. 2. 5G is Printing Money 📶In 2026, it’s not just about building towers; it’s about loading them. 35% of India’s data is now on 5G. Every extra antenna added to an existing tower is high-margin profit.Massive Scale: 256,000+ towers are already standing. The infrastructure is ready; the cash is coming. 3. The "Double" Roadmap 🗺️Metric )The "Double" GoalP/E Ratio~12x (Cheap!) 24x (Global Standard) Target ➡️ ₹800+
NSE:INDUSTOWERLong
by BallaJi
Updated
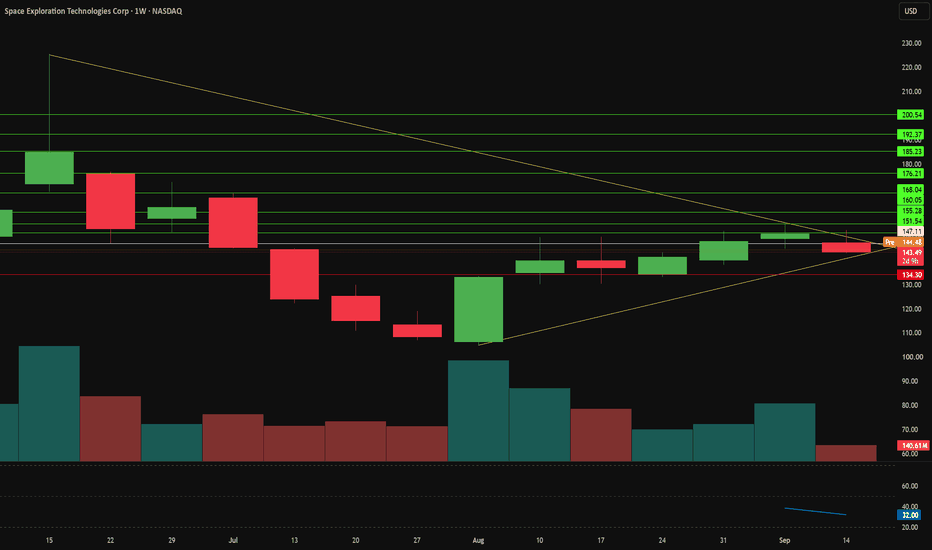
SPCX's first major reality check | great company/great stockThe Difference Between a Great Company and a Great Stock SpaceX entered public markets with extraordinary expectations. The company's IPO attracted global attention as investors sought exposure to one of the most ambitious companies in technology and space. The initial market reaction reflected that enthusiasm. Strong demand coincided with a sharp increase in the share price as investors competed for exposure to a company with significant long-term growth potential. Now, SpaceX is trading at its lowest price since listing. The move raises a question that applies to every major IPO: Does a great company always make a great investment at any price? The answer depends on valuation. A stock price does not only represent what a company is today. It represents what investors believe that company can become in the future, adjusted for risk and the price they are willing to pay. When expectations become extremely optimistic, even a strong business can experience a falling share price if investors begin reassessing whether the current valuation is justified by future growth. This is the process of price discovery. Following an IPO, the market moves beyond initial excitement and begins evaluating the company through a different lens. Investors start focusing on questions such as: Can future growth justify the current valuation? How much investment will be required to achieve that growth? Can future returns support the price investors are paying today? For SpaceX, these questions are particularly relevant because the space industry is capital intensive. Building launch systems, expanding satellite networks and developing future technologies require significant investment before long-term returns can fully materialise. That does not mean the business opportunity has disappeared. It means public markets evaluate companies differently from private markets. Investors continuously balance future potential against the price they are paying today. Another factor being monitored is the potential impact of IPO lockup expirations. These agreements temporarily restrict certain early investors and insiders from selling shares. As restrictions approach expiration, markets consider whether additional shares becoming available could affect the balance between supply and demand. However, lockups are only one part of the equation. They influence market structure, but they do not determine the value of the company. The broader question remains whether the price investors are paying reflects realistic expectations for future growth. SpaceX trading at its lowest price since listing is not simply a story about a falling stock. It is an example of how markets transition from excitement to evaluation. The company can remain innovative, ambitious and strategically important while investors adjust the price they are willing to pay based on changing expectations. SpaceX highlights one of the most important principles in financial markets: A great company and a great stock are not always the same thing. Markets do not reward businesses only for their potential. They reward the difference between expectations and reality. For traders, the lesson is to look beyond the narrative and understand what price is reflecting: growth expectations, valuation, risk and supply and demand. Key Insight The market does not ask whether a company is great. It asks whether the future investors are paying for is worth the price today. put together by : Pako Phutietsile as @currencynerd
NASDAQ:SPCXEducation
by currencynerd
$ITC: Got "Sin Taxed" - Capitulation is nearly here.The Technical Setup: Head & Shoulders Completion ITC has been a textbook example of a structural breakdown. The massive Head and Shoulders top that formed throughout 2024 and 2025 has fully triggered. The Neckline: The 390 level was the line in the sand; once that snapped, the technical "gravity" took over. The Log Target: We are currently hovering right around the 301–304 zone, which represents the logarithmic target of that massive top. This is often where "forced selling" ends and "value buying" begins. Linear Target: There is a final "scare" level at 281, but the current coiling near 300 suggests the worst of the momentum is fading. Why the "Worst is Nearly Done" (Growth Drivers): FMCG De-merger Clarity: The market hated the uncertainty of the hotel de-merger, but as ITC becomes a leaner, FMCG-focused powerhouse, the valuation multiple will eventually re-rate from "Cigarette stock" to "Consumer Staple giant." The "Value" Yield: At these levels, ITC’s dividend yield becomes irresistible to institutional funds. We are entering the "Dividend Floor" zone where the stock becomes a bond-proxy for big money. Agri-Business Resilience: While the cigarette business faces tax headwinds, ITC’s agri and paperboards divisions are quietly building a massive export footprint, diversifying the risk away from the "sin tax" narrative. The Contrarian Roadmap: The Accumulation Zone: 281 – 305. This is "generational wealth" territory. The Rebound Trigger: A weekly close back above 320. Medium Term Target: A return to the neckline at 390. Long Term Vision: 480+ (The "New Normal" once de-merger is fully digested). #ITC #Nifty50 #DividendInvesting #ValueStocks #FMCG #StockMarketIndia #Capitulation #TechnicalAnalysis #BuyTheBlood #Alpha
NSE:ITC
by BallaJi
Updated
TELSA TSLA = Bullish A few days ago, I highlighted this setup as liquidity was poised to be swept. Now, I’m actively positioned in the trade, targeting a strong swing higher. The primary risk remains potential liquidity grabs below on the 4H timeframe, but every other element of confluence is aligned — structure, momentum, and key levels all support the bullish case. Monday’s open looks promising. Let’s ride this momentum back into the green. 💚
NASDAQ:TSLA
by CoolSlavesFx
RVNL: Rail Vikas Nigam Ltd. Off the Rails and Over the Bridge!🚂🚂🚂 The Parabolic Peak: RVNL has become the poster child for "PSU Mania." The chart shows a classic "Blow-off Top" with vertical price action on massive retail volume. The Derailment Drivers: Profit Booking Gravity: The stock is prone to "News-Driven Exhaustion." Every major order announcement is now met with a "Sell the News" reaction. Margin Pressure: While the order book is huge, these are low-margin infrastructure projects. If commodity prices (Steel/Cement) stay high due to Middle East tensions, these fixed-price contracts will see significant margin erosion. The Gap-Down Risk: There are multiple "unfilled gaps" lower on the chart.
NSE:RVNLShort
by BallaJi
Updated
MSFTFriends, my approach to reading charts is very simple. Technical Note: From a technical perspective, MSFT closed below the IRL(Internal Range Liquidity)candle on the Daily timeframe, further strengthening the current bearish trend. This confirms this confluence as a key institutional supply zone. Meanwhile, the price remains above Long-term support around 34x Price range. Let the market come to your zones and show its hand. Trade safe and manage your risk! Always wait for your own confirmations before entering the market. Classic trading strategy where you lock in profits during market rallies and purchase assets at a discount when their prices pull back. The goal is to accumulate fundamentally strong assets at lower prices, anticipating they will rebound to new highs. Risk Disclaimer: This analysis is for educational purposes only and does not constitute financial advice. Always practice proper risk and position sizing. Stop Loss Must if you want to be a profitable Trader. MARKET VIEW:- Current Bias: Bearish Preferred Strategy: Sell the Rise – Wait for Confirmation
NASDAQ:MSFTShort
by askbiswanath2025
Target aims for $130Sellers exhausted? Bulls reasserting control? A sustained move above $103 could target previous resistance of around $130 Which where a W pattern formation points towards as well. Consenus by analysts is a "hold" But if consumer spending picks up under favourable economic conditions earnings could expand and catch up to peers like #WMT
NYSE:TGT
by BallaJi
Updated
33
Angel One: Breakout | Target ₹580The wait is over. Angel One (ANGELONE) has spent years building a massive technical base, and the weekly chart is now screaming "Blue Sky Breakout." Following a classic "Shakeout & Rocket" phase in early 2023, the price action has matured into a textbook Continuation Inverse Head & Shoulders pattern. We are currently witnessing a high-conviction test of the multi-year neckline at the ₹326–₹330 zone. Why the setup is prime: Confirmation Trigger: A solid weekly close above ₹330 invalidates the overhead resistance and confirms the next leg of the primary trend. Technical Targets: Utilising the depth of the consolidation base, we are looking at a Linear Target of ₹473 and a long-term Log Target of ₹580. Macro Tailwinds: With the Indian market coiling for a breakout and retail participation hitting record highs, Angel One stands as the primary beneficiary of increasing market depth and operating leverage. This isn't just a trade; it's a structural re-rating. If the weekly candle holds green above the neckline, the path of least resistance is significantly higher. #AngelOne #TechnicalAnalysis #TradingView #BreakoutStocks #PriceAction #NiftyNext50 #InvestingIndia #StockMarketIndia
NSE:ANGELONELong
by BallaJi
Updated
AMZNTechnical Note: From a technical perspective, AMZN closed below the BOS(Break of Structure) candle on the Daily timeframe, further strengthening the current bearish trend. This confirms this confluence as a key institutional supply zone. Meanwhile, the price remains above short-term support around 226-214 Price range. Let the market come to your zones and show its hand. Trade safe and manage your risk! Always wait for your own confirmations before entering the market. Classic trading strategy where you lock in profits during market rallies and purchase assets at a discount when their prices pull back. The goal is to accumulate fundamentally strong assets at lower prices, anticipating they will rebound to new highs. Risk Disclaimer: This analysis is for educational purposes only and does not constitute financial advice. Always practice proper risk and position sizing. Stop Loss Must if you want to be a profitable Trader. MARKET VIEW:- Current Bias: Bearish Preferred Strategy: Sell the Rise – Wait for Confirmation
NASDAQ:AMZNShort
by askbiswanath2025
Title: Apple (AAPL) Testing Major Resistance Apple (AAPL) has maintained a strong bullish trend after breaking out from a prolonged consolidation phase and reclaiming higher price levels above the Ichimoku Cloud. The recent impulsive rally has pushed price into a significant resistance zone around **$333–334**, where buying momentum is beginning to slow. The chart suggests that this resistance area could trigger a short-term correction or profit-taking move. A healthy retracement toward the previous breakout level near **$316.00** would allow price to retest support while remaining above the bullish market structure. As long as AAPL holds above this support zone and the Ichimoku Cloud continues to provide dynamic support, the broader uptrend remains intact. A rejection from current resistance followed by a controlled pullback could offer buyers a stronger entry before another attempt to make new highs. ### **Target:** * **Primary Pullback Target:** **$316.06** * **Resistance Zone:** **$333.00 – $334.00** * **Bullish Invalidation:** A sustained break below **$316.00** could weaken the short-term bullish outlook and open the door for a deeper correction. **Outlook:** Short-term **bearish pullback**, but the overall trend remains **bullish** while price stays above the $316 support area.
NASDAQ:AAPLShort
by PRIMEALPHA-FX
Updated
22
TANLATechnical Note: From a technical perspective, TANLA closed below the IRL(Internal Range Liquidity) candle on the Daily timeframe, further strengthening the current bearish trend. This confirms this confluence as a key institutional supply zone. Meanwhile, the price remains above short-term support around the 430-445 Price range. It could turn bullish if bounce back from the support level. If that happens, the strategy will be to buy the dip. The stop-loss will be placed below the swing low (430). The view is currently bearish. Let the market come to your zones and show its hand. Trade safe and manage your risk! Always wait for your own confirmations before entering the market. Classic trading strategy where you lock in profits during market rallies and purchase assets at a discount when their prices pull back. The goal is to accumulate fundamentally strong assets at lower prices, anticipating they will rebound to new highs. Risk Disclaimer: This analysis is for educational purposes only and does not constitute financial advice. Always practice proper risk and position sizing. Stop Loss Must if you want to be a profitable Trader. MARKET VIEW:- Current Bias: Bearish Preferred Strategy: Sell the Rise – Wait for Confirmation
NSE:TANLAShort
by askbiswanath2025
Oracle (ORCL): Oversold ConditionsOracle (ORCL): Oversold Conditions and Strong OCI Demand Point to a Tactical Rebound We expect a tactical rebound in Oracle shares over the next two months. The stock has moved into oversold territory following a sharp correction, even though demand for Oracle Cloud Infrastructure (OCI) remains strong and remaining performance obligations (RPO) have reached $638 billion. The main catalyst will be Oracle’s first-quarter fiscal 2027 earnings report, with investors focused on OCI growth, RPO trends, and capital expenditures (capex). Additional support could come from a rotation out of semiconductors and into software: the semiconductor ETF SMH is showing near-term weakness, while the software ETF IGV maintains an upward bias and continues to outperform the broader market. Ticker: ORCL Price at the time of analysis (July 16, 2026): $132.49 Current price (July 17, 2026): $123.71 Target: $158.21 Stop-loss: $115.34 Investment Thesis Oracle combines resilient database and enterprise applications businesses with the rapidly growing OCI platform. The recent correction appears to reflect concerns about funding and capital intensity rather than weakening demand. In Q4, OCI revenue increased by 93%, while RPO reached $638 billion, up $85 billion quarter over quarter. At the same time, major AI contracts worth $75 billion require customer prepayments or the use of customer-owned equipment, reducing Oracle’s funding burden. Oracle’s Q1 FY2027 earnings report, expected in mid-September, will be the key near-term catalyst. FactSet consensus estimates call for revenue of $19.1 billion, up 28%; EPS of $1.73; cloud revenue of $11.5 billion; and OCI revenue of approximately $7.1 billion. Because these estimates are close to management guidance, a modest beat may not be enough to drive a sustained re-rating. Positive signals would include RPO above $617.9 billion, capex below $19.0 billion, and evidence that backlog monetization can offset pressure from a 61.9% gross margin and negative free cash flow of $9.7 billion. Sector rotation further strengthens the thesis. SMH currently appears weaker, while IGV maintains an upward bias and continues to outperform the broader market. This suggests capital may be rotating from AI semiconductors into software. Continued OCI growth and a resilient software revenue stream could support ORCL. An RSI reading near 30, combined with the $119–132 support zone, increases the likelihood of a rebound toward $149–152. Conclusion: Buy The key conditions supporting the thesis are sustained RPO growth, capex discipline, and continued OCI momentum.
NYSE:ORCLLong
by FreedomHolding
MSTR: Don't be Saylor's ATMLooking at the chart comparing MSTR versus the SPX, you are essentially looking at the "Volatility Multiplier" of the crowd's confidence in Michael Saylor. The ratio between MSTR and the SPX is not a standard correlation; it is a leverage-adjusted signal. When MSTR outperforms the SPX (the ratio line slopes upward), it confirms that liquidity is flowing into high-beta, Bitcoin proxy-linked assets. When the ratio flattens or dips, it indicates that the market is "de-risking"—moving back into stables / broad-market indices like the SPX. During the "Accumulation" phase of the 4-year cycle, you will often see this ratio consolidate. During the "Parabolic" phase, the MSTR/SPX ratio tends to go vertical. The most critical part of this chart is where it intersects with the company's Share Issuance events. The "Saylor Effect": Historically, MSTR issuance announcements cause a localised dip in the MSTR/SPX ratio (as the market digests dilution), followed by an aggressive recovery if the market perceives the capital deployment as "accretive" (i.e., it buys enough BTC to justify the dilution). Watch the ratio right after any "ATM" (at-the-market) issuance. If the ratio recovers quickly, the Institutional Bid is strong. If the ratio stays suppressed, the market is signalling that the dilution is outpacing the value creation. The Dilution-Dividend Balancing Act: Saylor’s issuance of common shares is a tactical manoeuvre designed to fund the aggressive accumulation of BTC. However, this is constrained by their commitment to Series A preferred stock (STRC) dividends. The Constraint: Equity issuance must create "accretive value" (each new share issued must increase the total BTC owned per share). If the share price drops, issuance becomes dilutive rather than accretive, creating a "downward spiral" of BTC-per-share value. The "Last Resort" Sales (The Liquidity Tripwire): This is the risk most analysts ignore. If the share price drops to a level where issuing common stock becomes aggressively dilutive, management is forced to either stop buying or sell BTC to fund operations/debt. * The Projection: A sale of Bitcoin to fund operations would be a fundamental "trend break." It signals that the liquidity engine has stalled. Keep a close watch on the USD Cash Reserve vs. Preferred Dividend Requirement. If the cash reserve falls below the threshold required to cover dividends, the likelihood of a "forced sale" of BTC spikes, which would immediately compress the MSTR/SPX ratio.
NASDAQ:MSTRShort
by BallaJi
Updated
$LTM: Classic complex Double Bottom...with a defined neckline at 4,720 INR. The Fundamental "Why": The Next Growth Leg LTM isn't just a legacy IT provider; it is the structural beneficiary of the "Second Wave" of the AI transition. ERP to AI Integration: LTM specialiaes in the complex plumbing of enterprise data. As companies move past "chatbots" and into autonomous AI agents, LTM's role in migrating legacy ERP systems to AI-ready cloud environments becomes a non-discretionary expense. Operating Leverage: After the merger of L&T Infotech and Mindtree, the "digestion" phase is over. The current margin expansion we are seeing is the result of optimised delivery centers and cross-selling to a massive combined client base. The Valuation Gap: While global tech is trading at historic premiums, LTM has been re-testing multi-year support levels. This provides the "Value King" safety margin Buffett looks for, combined with high-beta tech upside. The Technical Roadmap The chart identifies three critical structural magnet zones: The Breakout Trigger: A clean daily close above 4,720 INR completes the base and triggers the vertical expansion phase. Linear Target (5,588 INR): The measured move of the double-bottom depth. Log Target & Gap Fill (5,779 - 5,941 INR): This is the ultimate "gravity" zone. Notice the massive volume gap from early 2026—price action loves to "sprint" through these areas once the neckline is cleared. The Macro View: LTM is the "Value Play" within the Tech Meltup. As liquidity rotates out of over-extended mega-caps, it flows into high-quality, cash-flowing IT leaders that have already spent months "paying their dues" in consolidation. #LTIMindtree #NiftyIT #ValueInvesting #DoubleBottom #TradingView #ITStocks #MacroRotation
NSE:LTMLong
by BallaJi
Updated
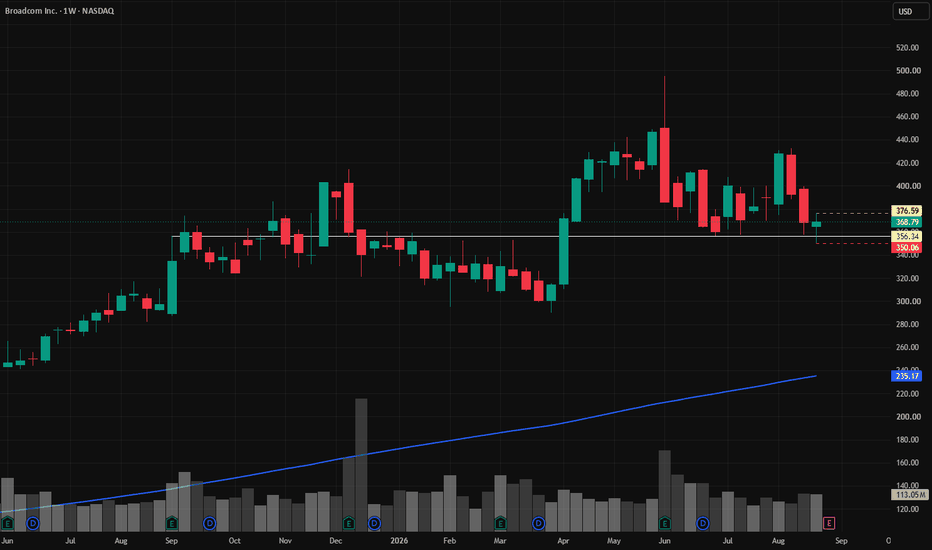
$MCHP: Wave (5) Completed — False Breakout, Triggers Pullback📉 📉 📉 The semiconductor sector has enjoyed an incredible run, but sophisticated capital tracks when the trend exhausts. If you are looking for an aggressive momentum pivot to compound capital, Microchip Technology Inc. #MCHP is presenting a textbook structural short setup. The daily chart shows a clean, completed macro 5-wave Elliott structure. Friday's aggressive breakdown volume has officially confirmed a structural bull trap. 1. The Technical Setup: False Breakout & Liquidity Sweep Looking closely at the daily structure price finished its multi-month expansion at Wave (5), briefly sweeping liquidity just above the 105.38 High. The Trap: MCHP attempted to sustain momentum above the vital 2024 high of 95.25, but completely failed to attract institutional follow-through. Instead, it formed a massive distribution cluster. The Confirmation: Friday’s -8.27% liquidation event slammed price straight down to 88.34. In a single daily session, sellers wiped out weeks of grinding price action, plunging straight back below the 95.25 structural floor on massive volume expansion. The trap has sprung. 2. The Fundamental Catalysts: Re-Rating Premium Valuations. A technical trap needs macro headwinds to sustain a downward move. Friday gave us the ultimate fundamental double-whammy: The Sector Overhang: Broadcom's recent guidance data reset expectations regarding the blistering pace of macro #hyperscaler and #AI chip spending. This removed a core growth catalyst that was keeping high-multiple semiconductor stocks afloat. The Discount Rate Shift: Friday’s stronger-than-expected US jobs report (172,000 payrolls) effectively crushed immediate hopes for interest rate cuts. Stocks trading at premium multi-year forward P/E valuations are hyper-sensitive to these macro discount rate changes. When rate cuts are delayed, high-multiple semi valuations contract rapidly. 🎯 Tactical Short Execution Plan Because the daily candle closed right at its session lows (88.34), shorting directly into the hole carries near-term execution risk if the broader index attempts a Monday morning relief bounce. We want to execute on a low-volume retest of the broken floor. The Entry Zone: Look to establish a short position on a lower-timeframe dead-cat bounce back toward the 91.50 – 93.00 cluster (retesting the breakdown value area). The Stop Loss (Invalidation): Strict stop placement on a daily close back above 95.25 (the broken 2024 high line). If the bulls manage to re-claim this level, the bearish thesis is instantly invalidated and we preserve capital. Take Profit (TP) Target 1: The pink consolidation zone between 80.00 and 83.00. This marks the peak of the previous Wave (3) cluster and serves as natural structural support. Take Profit (TP) Target 2: The blue structural liquidity pool down at 68.00 if the tech sector encounters a deeper macro ABC correction. 💬 What's Your View on Semis? Is MCHP signalling a broader tech rotation, or do you think the dip buyers step back in at the 80s support block? Drop your targets and perspectives in the comments section below! If you want to follow the compounding journey and catch updates on this short trade, make sure to hit that Follow button! (Disclaimer: Not financial advice. Manage your risk according to your own capital allocation rules. If you don't have any Rules make them before entering financial markets)
NASDAQ:MCHP
by BallaJi
Updated
$IpcaLab: Indian Pharma’s Next Big Breakout mover.💊 💊 💊 Ipca Labs is currently screaming "institutional accumulation." We are looking at a massive Hunt Volatility Funnel that has been tightening since mid-2025. The price action is getting squeezed into a very narrow range, which historically acts like a coiled spring. A breakout above the 1,561–1,600 pivot zone could trigger a massive momentum run. Why the "Alpha" is in Ipca right now (Growth Drivers): Regulatory Tailwinds: With recent manufacturing clearances and a clean bill of health for key plants, Ipca is ready to ramp up exports to lucrative regulated markets (US/EU). API Dominance: Ipca is vertically integrated. In an environment where supply chain reliability is king, their strong in-house Active Pharmaceutical Ingredient (API) business gives them a massive margin advantage over peers. Domestic Strength: Their pain management and cardiovascular portfolios continue to grow at double digits in India, providing a rock-solid "cash cow" to fund their global expansion. The Price Action Roadmap: Immediate Trigger: Breakout & close above 1,600. Target 1 (T1): 1,690 (Initial Resistance). Target 2 (T2): 1,894 (Secondary Fibonacci Expansion). The "Major" Target (T3): 2,235 (Structural Target from the Funnel depth). Stop Loss (Pattern Fail): Daily close below 1,400. #IpcaLabs #NiftyPharma #VCP #VolatilityFunnel #Breakout #TradingAlpha #InvestmentStrategy
NSE:IPCALABLong
by BallaJi
Updated
PayPal’s Biggest Moment Since the IPOPayPal may be preparing for a major deal! Stripe and private equity firm Advent International have submitted a $60.50 per share offer to acquire the company, putting PayPal’s valuation above $53 billion.. The proposal is reportedly supported by around $50 billion in committed financing However, this is not a confirmed acquisition yet.. The offer is unsolicited, PayPal has not officially responded, and all parties involved have declined to comment. Still, reports suggest PayPal has hired Goldman Sachs and Evercore to explore strategic options, including a possible sale or separating parts of the business. The company may not be actively searching for a buyer, but it appears open to understanding what the market believes it is worth 🛒 Stripe Could Gain a Massive Consumer Network The strategic appeal is clear. Stripe built its reputation by providing payment infrastructure for online businesses, becoming one of the most important players behind digital commerce. While millions of consumers use services powered by Stripe, most do not interact with the brand directly PayPal would give Stripe access to the consumer side of payments. The company brings around 439 million active accounts, roughly $1.8 trillion in annual payment volume, and Venmo, one of the strongest digital payment brands in the US A merger would allow Stripe to operate across the entire payment ecosystem, serving merchants while also building deeper relationships with consumers through PayPal, Venmo, and Stripe’s Link wallet. PayPal’s Braintree platform would strengthen Stripe’s merchant processing business, while PayPal’s stablecoin and crypto related assets could complement Stripe’s recent moves in blockchain infrastructure through acquisitions like Bridge and Privy On paper, the combination would create one of the largest payment networks in the world. But the reality could be more complicated. Stripe would also inherit older technology, overlapping products, and several businesses that PayPal has struggled to bring together effectively. Expanding into consumer payments could be valuable for Stripe, but integrating the two companies would be a significant challenge. 💵 Why Advent Sees Opportunity For Advent International, the attraction is different. The private equity firm is likely focused on PayPal’s strong cash generation rather than strategic expansion PayPal generated about $5.6 billion in reported free cash flow last year, or around $6.4 billion on an adjusted basis. A $53 billion purchase price represents roughly 8 times adjusted free cash flow, before accounting for debt, financing costs, and other expenses. That type of situation is attractive to private equity investors. PayPal is a mature company with a strong brand, significant cash flow, and potential opportunities to reduce costs. Outside the public markets, the company could make bigger changes without facing constant pressure from quarterly earnings expectations A private ownership structure could allow Stripe and Advent to restructure the business, sell certain assets, separate the consumer and merchant operations, or eventually bring the company back to the public market. 🤔 Is $60.50 Per Share Enough? The offer represents a meaningful premium compared with PayPal’s recent stock price, but some investors believe it undervalues the company’s long term potential. PayPal traded above $78 only a year ago, and rebuilding its global network of consumers and merchants would be extremely difficult and expensive Investor Michael Burry, who owns PayPal shares, has already argued that the offer is too low. His valuation may be aggressive, but the larger argument is understandable, Stripe and Advent would not be willing to spend more than $53 billion if they did not believe PayPal’s assets could eventually be worth significantly more PayPal became a takeover target because investors lost confidence in its ability to complete its turnaround. Stripe and Advent appear to believe the company’s underlying assets are worth more than the market currently recognizes. The $60.50 offer gives shareholders a possible exit after years of disappointing performance, but it may only be the starting point in a much larger negotiation.
NASDAQ:PYPLLong
by moonypto
#PATH: When two years of falling turned into a reversalNYSE:PATH On the two-week timeframe, a long-term accumulation base is forming, marking the end of a multi-year downtrend. Price has broken out of a descending wedge and successfully retested it from above, stabilizing above the key global demand zone. The main support for the asset is the strong multi-year range of 9.20–10.00 dollars, confirmed by abnormally high trading volume. Large players are systematically defending this range with limit order blocks, as confirmed by long lower wicks on higher timeframe candles. The indicators confirm the transition to an upward impulse. Price has settled above the 20-SMA (11.05 dollars) and the 50-SMA (10.97 dollars), while a break above the 200-SMA (12.95 dollars) would trigger strong acceleration. RSI (14) has moved from critically oversold to neutral territory (around 54), leaving room for growth, while the MACD histogram has formed a bullish convergence. Current levels (12.15 dollars) offer a strong entry point with a favorable risk-to-reward ratio. The nearest target is 18.44–19.48 dollars, with a medium-term target of 28.00 dollars. A stop-loss should be placed on a two-week close below the absolute low of 9.20 dollars.
NYSE:PATHLong
by TotoshkaTrades
IREN Holders : Quick UpdatePrice has returned to a major support zone that previously held in Dec 2025 and Apr 2026. Both times we tapped this level, the chart saw strong follow‑through - roughly 80–100% upside within the following month. That doesn’t guarantee the same outcome now, but the risk/reward is elevated at this area based on historical behavior. Invalidation: This idea becomes invalid below $30.00. Final Note: Never get married to a ticker. If you’ve been holding IREN since Sept 2025, you already know how brutal this market cycle has been. Manage risk, stay objective, and let the chart tell the story and ride the trend. Ley
NASDAQ:IREN
by LeyuIcx
Netflix AnalysisNetflix is gearing up for the next leg up, after a healthy re-trace we should begin our journey to new highs.
NASDAQ:NFLX
by Mrhavana001
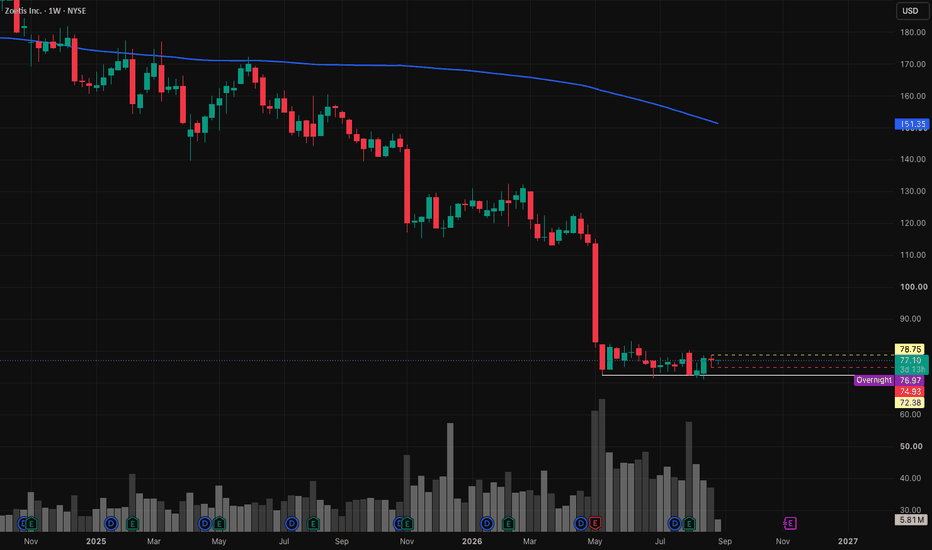
ZTS - classical elliptical wave analysis Wave C is completing with 0.786 fib at 75$. Trading at 10 PE forward against 17 of industry so it should be move now and can expect a target of 30-40% in next 2-3 years First Target -93 Second Target - 120
NYSE:ZTSLong
by schumideena
Updated
Bullish potential detected for AAPLEntry conditions: (i) retracement back to potential support areas of $314.18 and $309.56 (from the open of 3rd June and 26th May, respectively) for NASDAQ:AAPL , and (ii) observation of market reaction at these potential support areas noted above. Depending on risk tolerance, the stop loss for the trade would be: (i) below the rising 15 day EMA (currently $303.71), or (ii) below the potential support/resistance area of $300.85 (from the open of 17th June), or (iii) below the rising 50 day moving average (currently $297.77).
NASDAQ:AAPLLong
by Ivory_Wolf
Updated
112233445566778899101011111212131314141515161617171818191920202121222223232424252526262727282829293030313132323333343435353636373738383939404041414242
…999999

Made by humans

Select market data provided by ICE Data Services. Select reference data provided by FactSet. Copyright © 2026 FactSet Research Systems Inc.Copyright © 2026, American Bankers Association. CUSIP Database provided by FactSet Research Systems Inc. All rights reserved. SEC filings and other documents provided by Quartr.© 2026 TradingView, Inc.

More than a product
  • Supercharts
Screeners
  • Stocks
  • ETFs
  • Bonds
  • Crypto coins
  • CEX pairs
  • DEX pairs
  • Pine
Heatmaps
  • Stocks
  • ETFs
  • Crypto coins
Calendars
  • Economic
  • Earnings
  • Dividends
  • IPOs
More products
  • News Flow
  • Portfolios
  • Fundamental Graphs
  • Yield Curves
  • Options
  • Macro Maps
  • Pine Script®
Apps
  • Mobile
  • Desktop
Community
  • Social network
  • Wall of Love
  • Refer a friend
  • House Rules
  • Moderators
Ideas
  • Trading
  • Education
  • Editors' picks
Pine Script
  • Indicators & strategies
  • Wizards
  • Freelancers
  • Paid Spaces
Tools & subscriptions
  • Features
  • Pricing
  • Market data
  • Gift plans
Trading
  • Overview
  • Brokers
  • Brokers comparison
  • The Leap
Special offers
  • CME Group futures
  • Eurex futures
  • US stocks bundle
About company
  • Who we are
  • Space mission
  • Blog
  • Help Center
  • Careers
  • Media kit
Merch
  • TradingView store
  • Tarot cards for traders
  • The C63 TradeTime
Policies & security
  • Terms of Use
  • Disclaimer
  • Privacy Policy
  • Cookies Policy
  • Accessibility Statement
  • Security tips
  • Bug Bounty program
  • Status page
Business solutions
  • Widgets
  • Charting libraries
  • Lightweight Charts™
  • Advanced Charts
  • Trading Platform
Growth opportunities
  • Advertising
  • Brokerage integration
  • Partner program
  • Education program
Community
  • Social network
  • Wall of Love
  • Refer a friend
  • House Rules
  • Moderators
Ideas
  • Trading
  • Education
  • Editors' picks
Pine Script
  • Indicators & strategies
  • Wizards
  • Freelancers
  • Paid Spaces
Business solutions
  • Widgets
  • Charting libraries
  • Lightweight Charts™
  • Advanced Charts
  • Trading Platform
Growth opportunities
  • Advertising
  • Brokerage integration
  • Partner program
  • Education program
Look FirstLook First