Long
Long
 Long
Long
QSR vs. McDonald’s: Same Industry. Two Opposite Trends. Your PicTwo restaurant giants. One indicator. A very different message.
Put Restaurant Brands International (QSR) and McDonald’s (MCD) side by side on the weekly chart, with the 50-week EMA, and the contrast is striking.
🟢 QSR: Buyers are defending the trend
Price remains above a rising 50-week EMA, with the recent pullback testing that trend area. Buyers still have something to defend.
The next challenge? The $80–82 area , where previous advances have stalled. Holding the EMA and clearing that resistance would strengthen the bullish case. A sustained weekly break below the average would weaken it.
🔴 MCD: A big name facing a difficult chart
McDonald’s is trading below a falling 50-week EMA, with lower highs and lower lows defining the recent decline.
The $240–250 area is worth watching against previous weekly lows. But support alone does not confirm a reversal. I would want to see a base develop, a higher low, and eventually a reclaim of the weekly EMA.
My technical pick today: QSR.
Its weekly structure looks stronger. That does not make it an automatic buy: the entry price and distance to invalidation still matter.
MCD could offer a recovery opportunity, but the chart has yet to confirm that buyers have regained control.
The 50-week EMA is my trend filter, not a guarantee. Weekly closes matter more than intrawEEK moves.
🔥 If you could own only ONE for the next 12 months, which would you choose?
QSR’s stronger trend or MCD’s potential comeback?
Drop your ticker below and the ONE signal that would make you change your mind. Let’s compare the reasoning behind the picks.
Technical analysis based on the displayed weekly charts. Educational purposes only; not investment advice.
Laurent - Private Investor
✅ DL INVEST | Community Leader
NIO to $60 - April 1st, It's no joke - 2026Everyone is watching stocks get battered. The geopolitical headlines are relentless, the sentiment awful, and the retail crowd has long since given up. Good. That’s usually when the chart starts doing something interesting.
NIO Inc has corrected over 90% from its all time high. It has spent years inside a punishing downtrend channel, grinding the patience of anyone still holding. And then, quietly, when no one is looking. . resistance breakout, something that has not printed in over 5 years: A higher low. The first since 2020.
On the above 3 week chart a number of reasons now exist for a bullish outlook, they include:
The first higher low since 2020 has printed. This is not a minor development. For five years NIO made nothing but lower lows. That sequence has now been broken. In technical analysis, a change in market structure is the earliest and most reliable signal of a trend reversal. Look left, is this time really different?
Breakout from the multi-year descending channel. Price action has broken out from a descending channel that has contained the downtrend since 2021. A breakout from a channel of this duration, on this timeframe, is not noise. This is the market telling you something.
Return to legacy support and confirmation. The horizontal support level that held price in the pre-breakout era has been retested and held. Former resistance, now support. Classic, significant, textbook.
Bullish divergence. A confirmed positive divergence with price action on this timeframe is not a blip that fizzles out in a handful of weeks. It means something considerably more dramatic.
The measured move is extraordinary. The prior cycle took NIO from low single digits to over $60. The measured move from the current base, when applied to the breakout point, produces a forecast consistent with a return to all-time highs. Yes, really.
Forecasts:
1st, $12 - the first meaningful resistance zone.
2nd, $22 - mid range resistance from the descent. The point where former support becomes a serious test.
3rd, $60 - the measured move. The all-time high area, the moment the crowd arrives and declared it’s obvious. By then, the work is already done.
What about the downside?
A 3 week close back inside the descending channel invalidate the thesis. The higher low needs to hold.
The crowd
Right now, NIO is associated with a long list of grievances: competition from BYD, cash burn, Chinese regulatory risk, US tariff uncertainty, dilution, and a stock that has done nothing but disappoint for years. The sentiment is universally poor. The comments on any bullish NIO idea are merciless. (Sarcasm alert: obviously this is the perfect time to avoid it entirely.)
History does not repeat. But it rhymes. Loudly.
Conclusions
Alright, here’s the idea in plain English because the market doesn’t care about your feelings, and neither does my chart. NIO has spent five years being absolutely terrible. It has corrected over 90%, burned capital, missed targets, and provided ample opportunity for anyone who owned it to question every decision they’ve ever made. And yet here we are. A 3-week chart. A higher low. A channel breakout. The measured move pointing at $60.
The chart doesn’t know about the bad headlines. It doesn’t read Twitter. It doesn’t know that NIO is the stock everyone loves to mock at dinner parties. It just prints candles, and right now, the candles are telling a different story to the one you’ve been hearing.
Ww
===================================
Disclaimer
This is not financial advice. It is not investment advice. It is not advice of any kind. It is a person, on the internet, looking at lines on a chart and writing things down. If that sentence describes the entirety of your research process before committing real money to a position, then the chart is not your problem.
I hold no position in NIO at the time of writing. I could be completely wrong. The company could announce something catastrophic tomorrow. The chart could fail. Markets do that. They’re allowed.
Do your own research. Manage your own risk. Don’t size into anything you aren’t prepared to watch go to zero. That’s the deal. It always has been.
 Long
Long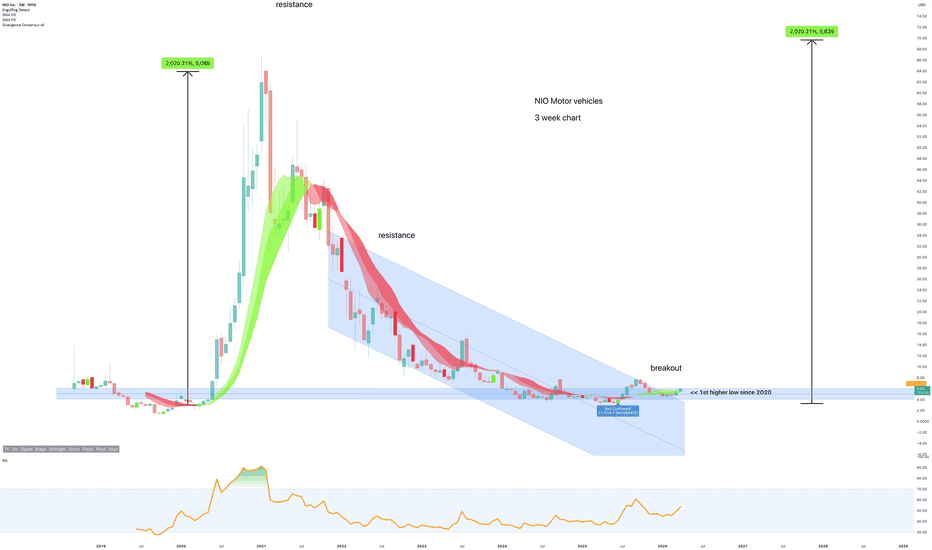
 Long
Long
COIN — Final Correction Before the Next Major Bullish WaveCOIN remains inside the long-term ascending structure that has developed from the 2022–2023 cycle lows.
The current move still looks like a large correction within that broader uptrend. After topping near the $400 area, COIN has continued to retrace toward the lower section of the long-term rising channel. Based on the current channel geometry, I expect the final stage of this correction to develop between now and roughly April–June 2027.
The key area I am watching is around $153. As long as COIN continues to respect the lower boundary of the long-term ascending structure, the larger bullish framework remains valid.
Once this correction is completed and price confirms a reversal from the lower part of the channel, I expect COIN to begin its next major bullish wave.
The first important upside area is around $440. If price successfully breaks through the previous major resistance structure, the move could then expand toward approximately $770, followed by the $980–$1,150 region.
My primary long-term target is around $984–$1,156, which corresponds to the upper section of the long-term ascending channel under the projected path shown on the chart.
The final upside level will depend heavily on the speed of the rally. If COIN rises more gradually, the upper boundary of the channel will continue moving higher over time, allowing a higher eventual target. A faster move would reach the same structural resistance earlier and therefore at a lower price.
My expected path is therefore:
current correction → major support around $153→ final bottoming process → new bullish expansion → $440 → $770 → $980–$1,150
The main condition for this thesis is that the long-term ascending channel remains intact. A sustained breakdown below that structure would invalidate the current projection.  Long
Long
Fed raises rates as SK Hynix negotiates with IntelIon Jauregui – Analyst at ActivTrades
Intel (NASDAQ: INTC) shares were up 3.2% in pre-market trading on Thursday, while SK Hynix rose 2.6%, after Reuters reported that both companies are negotiating the possibility of manufacturing memory chips in the United States for the first time. Options would include leasing part of Intel’s future Ohio plant or creating a joint venture with major cloud computing companies. Neither party has confirmed a finalized agreement.
The market was also reacting to the Federal Reserve’s decision to raise interest rates by 25 basis points, to 3.75%-4%, in its first rate hike in three years. The Nasdaq was virtually flat, in a session in which the impact of higher interest rates on technology valuations contrasted with the boost from investment related to artificial intelligence.
For Intel, an agreement with SK Hynix could help improve the utilization of its manufacturing capacity and strengthen its foundry business. The unit generated just $293 million from external customers in the latest quarter, compared with $5.77 billion in total revenue. The Ohio plant, whose investment could reach $100 billion, has remained slowed since 2025 amid lower-than-expected demand.
For SK Hynix, manufacturing in the United States would allow it to bring part of its production closer to the U.S. market at a time of political pressure to relocate advanced semiconductor manufacturing. It could also facilitate access to additional capacity for HBM memory, used in data centers that are driving demand associated with artificial intelligence. Any agreement involving advanced technology could also require authorization from South Korean authorities.
On the daily chart, Intel is trading around $100-$103, above its 20-, 50- and 200-day moving averages, located at approximately $94, $98-$99 and $75, respectively. The RSI remains between 54 and 61 points, while the MACD remains positive. Support is located at $94-$99, while resistance is at $113-$115. Confirmation of the agreement could put that resistance to the test, while a deterioration in the negotiations would shift the focus back towards the lower support level.
*******************************************************************************************
The information provided does not constitute investment research. The material has not been prepared in accordance with the legal requirements designed to promote the independence of investment research and such should be considered a marketing communication.
All information has been prepared by ActivTrades ("AT"). The information does not contain a record of AT's prices, or an offer of or solicitation for a transaction in any financial instrument. No representation or warranty is given as to the accuracy or completeness of this information.
Any material provided does not have regard to the specific investment objective and financial situation of any person who may receive it. Past performance and forecasting are not a synonym of a reliable indicator of future performance. AT provides an execution-only service. Consequently, any person acting on the information provided does so at their own risk. Political risk is unpredictable. Central bank actions can vary. Platform tools do not guarantee success.
 Long
Long
OKTA — AI Agent Security: A Sector Worth WatchingThe rise of AI agents raises a critical question: who controls what they can access and what they are allowed to do?
Identity security could become an increasingly important part of this transformation. With its dedicated AI agent security offering, Okta is positioning itself in this emerging market.
On the daily chart, the technical structure looks constructive: higher highs and higher lows, price holding above the Ichimoku cloud, and a fresh push higher following consolidation.
The 50-day EMA is a key reference to monitor. A controlled pullback followed by a bullish reaction at this moving average would strengthen the continuation scenario. Conversely, a break below it, combined with a loss of the latest consolidation low, would weaken the setup.
Following the recent advance, entry discipline matters. I would watch for either a successful retest of the breakout area or a new consolidation that establishes clear support.
A compelling theme, a constructive chart, and a stock worth keeping on the watchlist.
For informational purposes only. Not investment advice.
Laurent - Private Investor
✅ DL INVEST | Community Leader
 Long
Long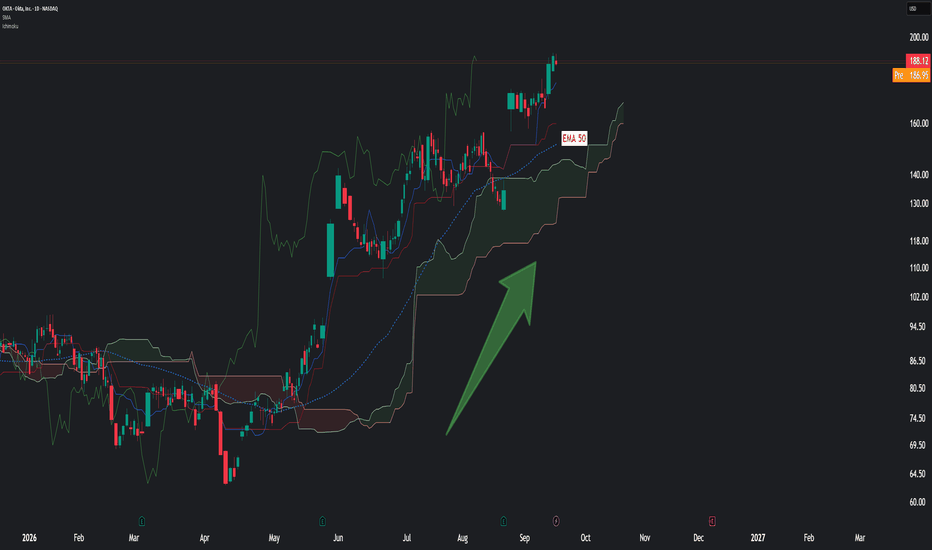
 Long
Long
LITE Surges: Why AI Investors Are Repricing Optical Networking? AI Money Is Looking for the Next Infrastructure Theme
Against a backdrop of higher rates and broad pressure on technology stocks, Lumentum (LITE) surged roughly 9.6% on September 16, making it one of the strongest performers in the S&P 500. Concerns over the sustainability of AI capital spending have recently increased, but money is not simply leaving the AI trade. Instead, investors are rotating toward infrastructure segments where orders are clearer and earnings growth is already becoming visible. Optical networking is increasingly one of those areas.
As AI data centers expand, the bottleneck is no longer just GPU supply. Larger clusters require dramatically more data to move between servers, racks and data centers, accelerating the transition from 800G to 1.6T connectivity. Bandwidth, latency and power efficiency increasingly determine the performance of AI infrastructure, raising the strategic importance of optical modules, optical components and switching technologies.
Compared with simply adding more GPUs, network upgrades are becoming a necessary part of the next phase of AI infrastructure investment. That is one reason optical networking stocks are attracting renewed attention.
Lumentum’s Growth Is Already Showing Up in the Numbers
More importantly, this story is no longer based purely on expectations. Lumentum’s latest quarterly revenue reached $1.006 billion, up 109% year over year and 24.5% sequentially. Non-GAAP gross margin rose to 50.4%, while operating margin reached 36.6%.
For the next quarter, the company expects revenue of $1.225 billion to $1.275 billion, with non-GAAP operating margin rising further to between 39.5% and 40.5%. Growth is therefore no longer coming from revenue expansion alone. Profitability is improving at the same time.
This puts Lumentum in a particularly important stage of its growth cycle. As higher-value products account for a larger share of revenue, incremental sales may not require proportional increases in operating costs. That creates operating leverage. If this trend continues, earnings could grow significantly faster than revenue, potentially changing how investors value the company.
1.6T and OCS Open Up a New Growth Runway
At the product level, 1.6T cloud modules and optical circuit switching, or OCS, are emerging as key growth drivers. 1.6T products address the higher-bandwidth requirements of next-generation AI data centers, while OCS gives Lumentum exposure to a broader upgrade in network architecture. Management has already indicated that both businesses are beginning to contribute to growth.
This also means Lumentum’s AI story is becoming broader than simply selling more optical components. If 1.6T volumes continue to rise and OCS develops into a meaningful business, the company could move further into higher-value parts of the AI data-center infrastructure stack. That could support an additional improvement in both revenue quality and margins.
After the Rally, the Market Is Pricing in High Expectations
The rapid rise in the share price, however, changes the key question. The main risk for LITE is no longer whether AI demand exists. It is how much future growth the market has already priced in.
If hyperscaler capital spending slows, order growth weakens, or the ramp in 1.6T and OCS falls short of expectations, Lumentum’s elevated valuation could amplify downside volatility.
Expectations also become harder to satisfy after a major rerating. Earlier in the cycle, evidence of stronger demand alone could support the stock. Going forward, investors are likely to focus much more closely on order growth, margin expansion and whether earnings guidance can continue to exceed expectations.
The next phase therefore depends on three variables: whether 1.6T shipments continue to accelerate, whether OCS develops into a meaningful revenue contributor, and whether margins can keep pace with current expectations.
If those indicators continue to strengthen, Lumentum’s valuation rerating will remain supported by improving fundamentals. If they do not, the high expectations already embedded in the share price could leave far less room for execution mistakes. Why I am still bearish for adobe? price action is everything ADBE remains in a clear weekly bearish market structure, characterized by a persistent sequence of Lower Highs. From 634.59 down to 294.53, every major recovery has failed below the previous swing high, demonstrating that rallies have repeatedly been sold. The current rebound from the ~190–200 area has not yet broken the most recent major Lower High at 294.53. Therefore, this recovery can technically be interpreted as a retracement within the broader downtrend rather than a confirmed trend reversal. As long as price remains below 294.53 and continues to form Lower Highs followed by Lower Lows, the bearish structure remains intact. In my opinion, this leaves room for ADBE to move lower again. A sustained break above 294.53 would be an important structural development that could invalidate or weaken this bearish thesis.
Deep technical explanation — ADBE Weekly
The most important feature on this chart is not one individual red candle; it is the market structure.
Notice the pattern:
LH → sell-off → new low → retracement → another LH → sell-off
This is the classic structure of a bearish trend.
Why Lower Highs matter
In an uptrend, buyers are able to push price above the previous swing high:
Higher High → Higher Low → Higher High
But in a downtrend, rallies repeatedly fail before reaching the previous significant high:
Lower High → Lower Low → Lower High → Lower Low
That is exactly what your ADBE weekly chart has been showing.
The important question therefore isn't:
"Can Adobe bounce?"
Of course it can.
The more important question is:
"Can Adobe break the bearish market structure?"
So far, based on this chart, that has not happened..  Short
Short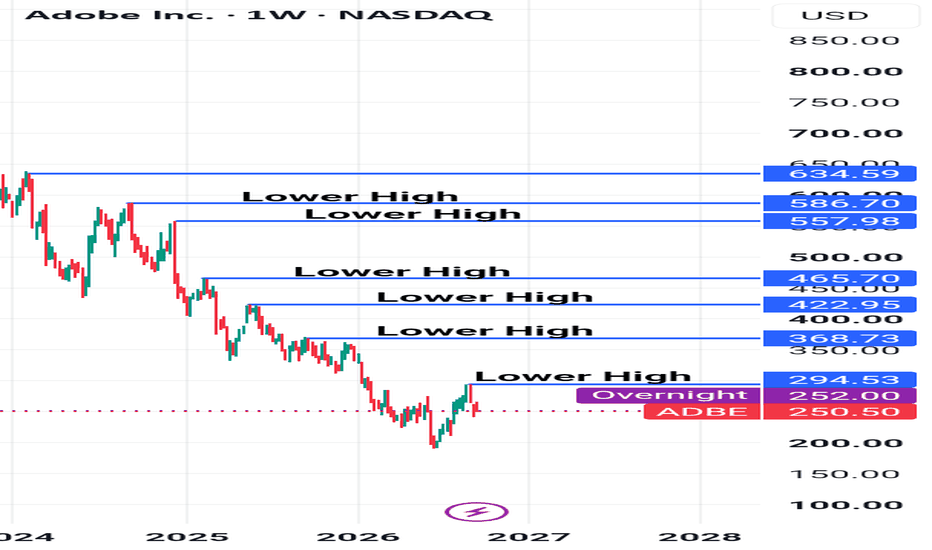
 Long
Long
Did you make any profits with META 2 years ago...........The thing about charts is it tells you more of WHAT HAD happened to the company share performance over the last 2, 5 or 10 years ......To predict WHAT WILL happen in the future requires much more skills than simple extrapolation.
If it was that simple, buy at support and sell at resistance, I would be a MULTI-MILLIONAIRE , haha.
So what now ? To buy or sell ? For me, I am not doing anything since I am vested with this company decades ago and simply ride on the trend. It has not come down that attractive that I MUST buy plus there are so many companies that I am looking at (greed, haha)
So much expenditure is ON Artificial Intelligence now with some industry players saying it is time to slow down while others like Trump said, "Whoever wins AI, wins the race !
Obviously, he is referring to China as the latter government is ramping up more efforts and money to invest in this sector !
In the mind of Trump, he has to be number 1 or USA for that matter so I don't expect much collaboration with the Chinese side in the forthcoming meeting. China likewise having been played out by him several times are also wary of his shrewd moves and will not be swayed easily by his words anymore.
Let's take a back seat and watch how the market plays out......
Does NuScale Hold the Key to Clean Energy?NuScale Power announced a significant engineering milestone on September 1, 2026. Working with nuclear materials manufacturer MillenniTEK, the company fabricated first-of-a-kind boron-oxide pellets. These components serve NuScale's passive emergency core cooling system. The achievement is a manufacturing milestone, not a deployment milestone. No pellets are installed in an operating reactor. NuScale offers a distinct value proposition for energy markets. Investors must evaluate this innovator across multiple complex dimensions.
Geopolitics and Geostrategy
Energy independence drives modern national security protocols. NuScale capitalizes on this geopolitical shift. The company supplies technology to the RoPower project in Romania.
Nuclearelectrica shareholders approved the final investment decision on February 12, 2026. The plan covers six modules totaling 462 MWe at a former coal site in Doicești.
The approval carries explicit conditions. Nuclearelectrica listed mandatory requirements that condition project feasibility. The target is operation at the beginning of the next decade. Analysts project the first module online around 2033.
This placement helps Eastern Europe reduce reliance on hostile energy suppliers. Nations globally seek safe and scalable nuclear options. NuScale provides a vital geopolitical tool for allied countries.
Macroeconomics and Economics
The broader economic landscape presents both hurdles and opportunities. High interest rates stifle capital-intensive energy projects. The Federal Reserve raised its target range to 3.75% to 4.00% on September 16, 2026. NuScale experienced cost pressure directly when its Utah project collapsed in 2023. The Carbon Free Power Project with UAMPS ended amid escalating costs.
Macroeconomic demand for clean electricity remains explosive. Data centers and grid electrification require massive power outputs.
The Tennessee Valley Authority opportunity belongs to ENTRA1, not NuScale directly. TVA signed an agreement with ENTRA1 Energy on September 2, 2025. ENTRA1 would develop and own six plants across TVA's seven-state region. It would sell output to TVA under future power purchase agreements. NuScale supplies the reactors. The memorandum is non-binding and confidential, with no disclosed timeline or financial terms.
NuScale has already incurred a $495 million milestone payment to ENTRA1 under that arrangement. The company ended Q2 2026 with $1.9 billion in cash and investments.
Industry Trends and Business Models
Traditional nuclear construction suffers from severe cost overruns. NuScale attacks this industry trend directly. The company adopts a business model based on pre-fabrication.
Management has assembled a network of more than 60 specialized partners. It has executed over 30 agreements, covering more than half that network. NuScale awarded Paragon a contract for final design development of the Highly Integrated Protection System. Doosan Enerbility has completed two years of production on heavy forgings.
Components are manufactured before construction begins. This strategy targets the on-site engineering bottlenecks that sank earlier projects. It aims to transform nuclear plants into scalable and repeatable products.
Management, Leadership, and Company Culture
Effective leadership requires adaptability and strategic foresight. NuScale management learned painful lessons from the Utah cancellation. Executives now prioritize supply chain resilience and strategic partnerships. ENTRA1 Energy serves as the exclusive global commercialization partner. This partnership model reflects a culture focused on pragmatic execution. Leaders aim to avoid repeating past on-site construction mistakes.
Science, Technology, and High-Tech
NuScale advances nuclear science through passive engineering. Traditional reactors rely on active mechanical insertion of control rods. They also use powered chemical injection pumps during nonstandard events.
NuScale engineered a passive alternative. Boron-oxide pellets sit in baskets inside the containment vessel. On ECCS actuation, vent valves release steam into containment. The steam condenses on the containment wall and runs down. Some condensate routes into the baskets and dissolves the pellets. Recirculation valves then feed the borated water back into the core.
Boron absorbs neutrons efficiently. The boron-10 isotope does almost all the work. This reduces the neutrons available to sustain the reaction. The system controls core reactivity without operator intervention. MillenniTEK achieved production yields above 95%.
Patent Analysis and Regulatory Moat
Intellectual property forms a core part of NuScale's competitive position. The NRC certified the 50 MWe US600 design in 2022. The NRC granted a Standard Design Approval for the uprated 77 MWe US460 module in May 2025. Each module produces 77 MWe and scales to 924 MWe across twelve modules.
As of Q2 2026, the company states it holds the only NRC design certification in the SMR industry. That status is a genuine head start.
Investors should note the limits. The design approval does not eliminate site-specific licensing requirements. Construction and operating permits remain outstanding for any US project. NuScale protects its designs through patent filings.
Cybersecurity Imperatives
Digital threats pose critical risks to modern power grids. Attackers target digital control systems across the energy sector.
NuScale's passive design reduces the attack surface. The boron-oxide cooling system does not require powered injection pumps. The pellets dissolve and borate the coolant without operator commands. Fewer active components mean fewer remotely exploitable pathways.
The plant still runs a protection system. NuScale contracted Paragon to complete final design development of the Highly Integrated Protection System. Passive safety narrows cyber exposure. It does not eliminate it.  Long
Long
 Long
Long
 Long
Long
 Long
Long
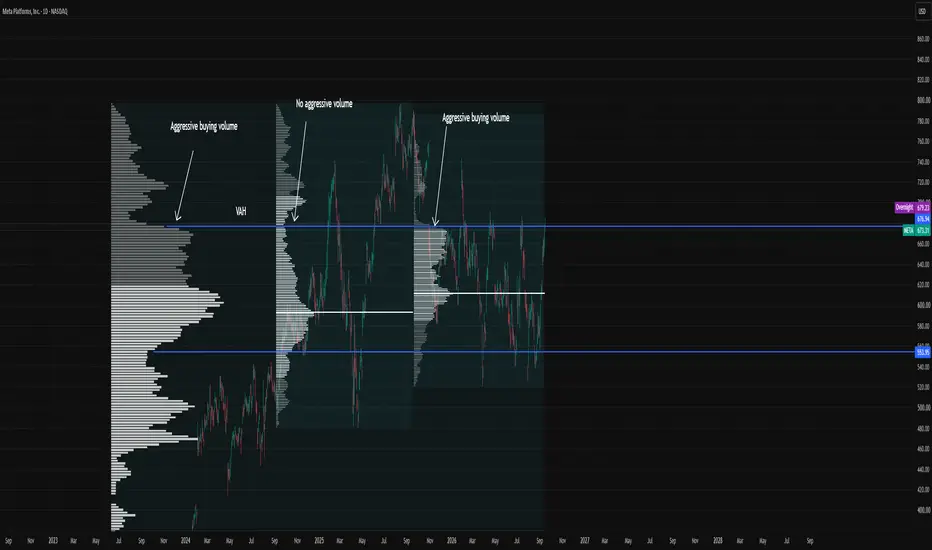
Potential short METAThe analysis shows three volume profiles:
The first profile, on the far left, covers the entire period from July 2023 to the present.
The second covers the period from July 2024 to the all-time high (ATH).
The third covers the period from the ATH to the present.
In the first and largest volume profile, we can see that the price is currently trading within a clear high-volume node. By studying the third profile, we can determine when this volume was built. Since it developed relatively recently, it suggests that aggressive sellers have been active around the current level. This increases my interest in looking for a potential short setup.
The analysis is based on the 70% rule. The price has already moved approximately 70% through the balanced area and could therefore rotate back into the balance, where the market has found acceptance since September 2025.
If I see clear absorption on a lower timeframe, such as the 10- or 15-minute chart, followed by sellers regaining control and beginning to push the price lower, I may consider entering a short position.
Could the price break above USD 676 and continue higher? Absolutely. There is never any guarantee that a level will hold simply because it has done so in the past. However, the area is becoming increasingly interesting from a risk-to-reward perspective for anyone looking for a potential short entry.  Long
Long