Long
Long
Commonwealth Bank of Australia — Bullish Setup | Target 176Commonwealth Bank of Australia is currently presenting a strong buy-side opportunity, with the market structure beginning to favour renewed upside momentum. The broader setup indicates that buyers are gaining influence, creating the potential for a continued advance toward the 176 target. 📈🔥
The bullish view is based on the overall price structure, momentum and the conditions identified through my trading methodology. Rather than reacting to individual candles or short-term fluctuations, the analysis focuses on the larger directional behaviour of the market.
Price action is showing signs that the previous selling pressure is being absorbed, while buying interest is becoming increasingly visible. This shift creates a constructive environment for a potential continuation higher, provided the underlying bullish conditions remain intact.
📊 Trade Setup
- Instrument: Commonwealth Bank of Australia
- Bias: Bullish 📈
- Direction: Buy
- Target: 176 🎯
- Focus: Upside continuation
- Market Structure: Constructive
- Momentum: Buyers gaining strength
The 176 level represents the primary upside objective for this setup. Reaching this area would complete the projected bullish move and confirm the continuation scenario identified in the analysis.
The path toward the target may naturally include short-term fluctuations, but the broader thesis remains focused on higher prices as long as the market continues to maintain its constructive structure.
🔥 Why the Setup Matters
The important factor here is the developing shift in market control.
After experiencing downside pressure, the market is showing characteristics of renewed demand, suggesting that buyers are becoming more willing to support higher prices. If this behaviour persists, the recovery could develop into a broader upward expansion.
The analysis therefore does not depend on simply assuming that price will rise. It is centred on identifying the conditions that can support a sustained move and then allowing the market structure to determine the progression.
🚀 Roadmap
The current scenario can be summarised as:
Selling pressure absorbed → Buyers step in → Bullish structure develops → Momentum expands → 176 comes into focus.
This setup is about maintaining a clear directional framework while avoiding unnecessary reactions to short-term market noise.
As long as the bullish structure remains valid, the primary objective stays firmly positioned at 176.
Buyers gaining control. Momentum turning constructive. 176 is the destination. 🎯📈🔥  Long
Long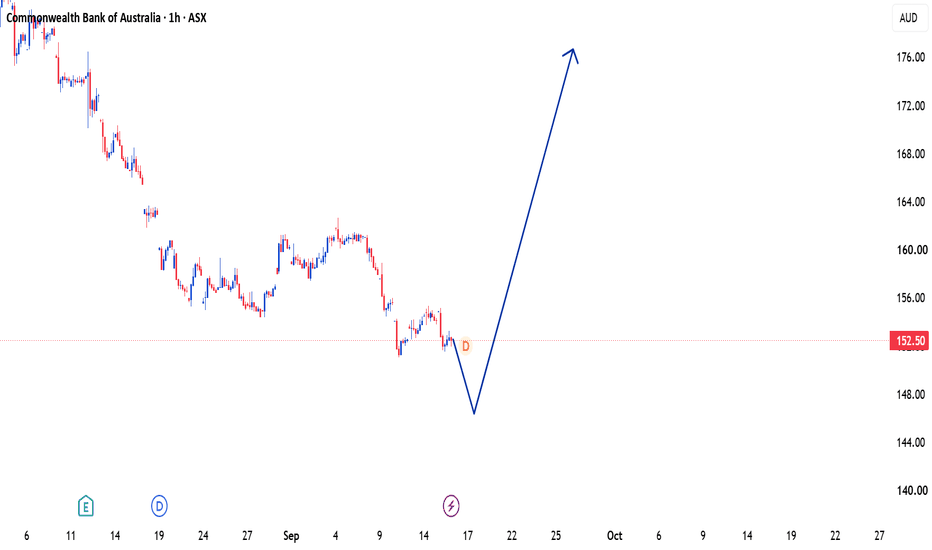
 Short
Short

 Short
Short
NVDA – Silver Reclaimed, Bronze Frontier Active | CSE Option OSDate: 2026-09-15
Type: CSE Option Decision OS Update
NVIDIA is currently another important live case inside our CSE Capital — Option Decision OS, also known as the Continuation Swing Engine.
The current NVDA dashboard gives a very clear message: the thesis is intact, the trend remains bullish, and the tactical repair has been reclaimed. At the same time, CSE still refuses to treat that as an automatic buy or aggressive add. The system keeps NVDA in HOLD / ADD WATCH, with every next step filtered through feasibility and risk.
That distinction is exactly why we built the CSE Option Decision OS.
A normal chart view might simply say: “NVDA is strong again” or “NVDA is bullish.” But for options and structured capital allocation, that is not enough. CSE separates the underlying thesis, the tactical repair, the current entry frontier, the add status, the option position, the roadmap and the risk gate.
The current CSE read for NVDA:
Manual Action: HOLD / ADD WATCH
Underlying Thesis: THESIS INTACT
Tactical Status: TACTICAL REPAIR RECLAIMED
Add Status: EVALUATE RANGE — FEASIBILITY REQUIRED
Option Position: HOLD
Signal Confidence: 72/100
Decision Price / Current Quote: 211.99
Trend: Bullish
Next Zone: 220.78
Decision Mode: Manual Only
Execution: Locked / Disabled
This is a strong but disciplined read.
The most important structural detail is that NVDA has already reclaimed the Silver Current Entry Frontier, while the current price is now trading inside the Bronze Current Entry Frontier.
The Current Entry Frontier currently shows:
Entry State: SILVER RECLAIMED
Thesis Health: INTACT
Tactical Status: SILVER RECLAIMED
Add Status: EVALUATE RANGE — FEASIBILITY REQUIRED
Gold Range: 167.39 – 174.29
Function: Retest Support
Silver Range: 186.88 – 197.66
Function: Retest Support
Bronze Range: 208.42 – 219.75
Function: BREAKOUT_ACCEPTED
That means NVDA is no longer sitting in the deeper recovery area. It has already moved through that phase. The stock reclaimed Silver, maintained thesis health, and is now trading within the Bronze breakout-accepted zone. At the current quote around 211.99, NVDA is structurally strong, but it is also approaching the next important decision area rather than sitting at a deeply discounted entry.
That is why CSE says HOLD / ADD WATCH instead of “buy blindly.”
This is the unique strength of the system.
The thesis and the entry are not treated as the same thing.
A stock can have:
- an intact thesis,
- a bullish trend,
- a reclaimed tactical structure,
- accepted higher entry frontiers,
and still not qualify as a clean automatic option entry.
That is the difference between structured decision support and emotional trading.
The Structural Authority Ladder gives the deeper framework behind the current NVDA setup:
Tactical Failure: 168.68
Tactical Repair: 173.54
Macro Survival: 136.45
Hard Thesis Invalidation: 110.41
The Macro Fib Thesis Lens confirms the broader continuation structure:
Position Archetype: Bullish Continuation
Macro Fib Status: Certified Structural Thesis — Intact
Macro Survival Support: 136.45
Tactical Repair Trigger: 173.54
Distance to Macro Support: +55.4%
Distance to Repair Trigger: +22.2%
Decision Posture: Evaluate Range — Feasibility Required
Reclaim Required: False
No Add Zone: False
Manual Only: True
Order Ready: False
That combination matters.
Reclaim Required: False.
No Add Zone: False.
Order Ready: False.
So structurally, NVDA is allowed to stay on add watch, but the system still refuses to authorize a trade automatically. That is exactly what we want CSE to do.
The roadmap now points to the next zone around 220.78. Beyond that, the broader structure includes higher roadmap layers and continuation potential, but CSE does not jump ahead emotionally. First, the stock must prove how it behaves near the active Bronze frontier and the next zone.
This is where the process becomes practical.
NVDA is bullish.
The thesis is intact.
Silver has been reclaimed.
Bronze is active.
But the next decision still requires feasibility.
That means every option idea still has to pass the Option Feasibility + Risk Gate:
premium, strike, expiry, delta, implied volatility, liquidity, bid/ask spread, time value, portfolio exposure and concentration risk.
The stock can pass the structural test while the option itself still fails the feasibility test.
That is one of the main reasons we developed CSE Capital — Option Decision OS.
Our current NVDA interpretation is therefore:
The thesis is intact.
The trend is bullish.
Tactical repair has already been reclaimed.
Silver has been reclaimed.
Price is now trading inside the Bronze Current Entry Frontier.
The next zone sits around 220.78.
Existing exposure remains HOLD.
Additional exposure remains on WATCH.
Any new option decision still requires full feasibility review and manual approval.
This is not prediction.
This is not hype.
This is not a blind buy signal.
This is structured option decision support.
Structure first.
Confirmation second.
Feasibility third.
No chase, no emotion, only process.  Long
Long
AMZN – Breakout Retest At Bronze Frontier | CSE Option Decision Date: 2026-09-15
Type: CSE Option Decision OS Update
Amazon is currently showing exactly the type of setup for which we built the CSE Capital — Option Decision OS, also known as the Continuation Swing Engine.
The broader AMZN thesis remains intact and the trend remains bullish, but the interesting part is what is happening underneath the headline trend.
CSE currently classifies Amazon as a Breakout Retest.
That distinction matters.
AMZN has already reclaimed the deeper structural levels, moved through the Silver framework, and recently traded inside our Bronze Current Entry Frontier. The latest validated completed close was around 253.56, inside the Bronze range of 249.40–257.55.
The current quote around 248.15 is now sitting just underneath the lower boundary of that Bronze range.
In other words: we are not looking at a random pullback. We are watching whether a previously accepted breakout region can now behave as a continuation / retest area.
The current CSE Executive Signal reads:
Manual Action: HOLD / ADD WATCH
Underlying Thesis: THESIS INTACT
Tactical Status: TACTICAL REPAIR RECLAIMED
Add Status: EVALUATE RANGE — FEASIBILITY REQUIRED
Option Position: HOLD
Signal Confidence: 94/100
Decision Price / Current Quote: 248.15
Trend: Bullish
Decision Mode: Manual Only
Execution: Locked / Disabled
Again, this is precisely why CSE is not designed as a simple green/red signal generator.
Amazon can have:
A bullish trend.
An intact thesis.
A reclaimed tactical structure.
A very high signal confidence.
And CSE can still refuse to say “buy now.”
Instead, the system says:
HOLD / ADD WATCH.
EVALUATE RANGE.
FEASIBILITY REQUIRED.
That is a much more useful decision state for an options trader.
The Current Entry Frontier gives us another layer of context.
Gold Range: 158.85–163.91
Function: Retest Support
Confidence: 91
Silver Range: 193.47–201.67
Function: Retest Support
Confidence: 94
Bronze Range: 249.40–257.55
Function: BREAKOUT_ACCEPTED
Confidence: 94
The important observation is that AMZN has already reclaimed Silver and has been accepted into the Bronze breakout architecture.
The current price is now testing that Bronze boundary.
This is where we stop predicting and start observing.
If AMZN can reclaim and hold the 249.40–257.55 region again, the continuation case becomes stronger. If the stock fails to stabilise there, CSE does not force an add simply because the long-term thesis remains bullish.
That separation between THESIS and ENTRY is fundamental to the CSE Option Decision OS.
A bullish thesis answers:
“Do we still believe the larger structure is alive?”
The Entry Frontier answers:
“Is this actually an intelligent place to increase exposure?”
Those are not the same question.
The Structural Authority Ladder gives us the deeper hierarchy behind the AMZN thesis:
Tactical Failure: 184.27
Tactical Repair: 189.16
Macro Survival: 151.83
Hard Thesis Invalidation: 125.61
The Macro Fib Thesis Lens currently classifies AMZN as:
Position Archetype: Bullish Continuation
Macro Fib Status: Certified Structural Thesis — Intact
Macro Survival Support: 151.83
Tactical Repair Trigger: 189.16
Distance to Macro Support: +63.4%
Distance to Repair Trigger: +31.2%
Decision Posture: Evaluate Range — Feasibility Required
Reclaim Required: False
No Add Zone: False
Order Ready: False
That last combination is important.
Reclaim Required: False.
No Add Zone: False.
But Order Ready: False.
In other words, the structural thesis allows us to evaluate additional exposure, but it still does not authorize an automatic trade.
This is exactly where our Option Feasibility + Risk Gate becomes necessary.
Before increasing an AMZN option position, we still evaluate premium, strike, expiry, delta, implied volatility, liquidity, bid/ask spread, time value, portfolio concentration and total capital at risk.
The stock can pass the structural test while the option itself fails the feasibility test.
That is one of the main reasons we developed CSE.
The roadmap also gives us predefined areas to monitor rather than inventing targets after price starts moving.
The current CSE roadmap includes higher continuation areas around 289, followed by approximately 297–302, with further structural expansion potential beyond that if the thesis continues to develop.
These are not promises or guaranteed price targets.
They are predefined decision zones.
And that difference matters.
Our current AMZN interpretation is therefore:
The thesis is intact.
The trend is bullish.
Tactical repair has already been reclaimed.
Silver has been reclaimed.
Bronze has been accepted.
Price is now retesting the Bronze frontier.
Existing exposure remains HOLD.
Additional exposure remains on WATCH.
Any new option decision still requires feasibility and manual approval.
That is exactly what we want CSE Capital — Option Decision OS to do.
Not tell us what we want to hear.
Not turn every bullish chart into a buy signal.
But continuously measure price against a predefined structural decision architecture and tell us what decision needs to be evaluated next.
Structure first.
Confirmation second.
Feasibility third.
No chase.
No emotion.
Only process.
 Long
Long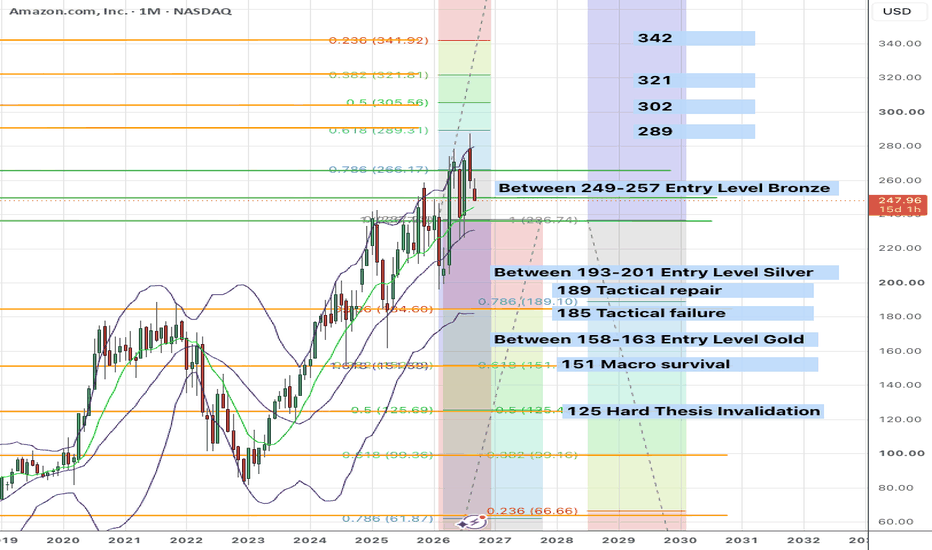
AAPL – Above Bronze Frontier, Hold/Add Watch | CSE Option DecisiDate: 2026-09-15
Type: CSE Option Decision OS Update
Apple is now another important live case inside our CSE Capital — Option Decision OS, also known as the Continuation Swing Engine.
The current AAPL dashboard gives a very clear message: the thesis is intact, the trend is bullish, and the tactical repair has been reclaimed. But CSE still does not classify this as an automatic add. The system keeps Apple in Hold / Add Watch, with the next decision filtered through feasibility and risk.
That distinction is exactly why we built the CSE Option Decision OS.
A normal chart view might simply say: “Apple is bullish” or “Apple is breaking higher.” But for options and structured portfolio exposure, that is not enough. CSE separates the thesis, the tactical repair, the entry frontiers, the option position, the add status, the risk gate and the portfolio decision.
The current CSE read for AAPL:
Manual Action: HOLD / ADD WATCH
Underlying Thesis: THESIS INTACT
Tactical Status: TACTICAL REPAIR RECLAIMED
Add Status: EVALUATE RANGE — FEASIBILITY REQUIRED
Option Position: HOLD
Signal Confidence: 82/100
Decision Price / Current Quote: 330.26
Trend: Bullish
Invalidation: 238.00
Decision Mode: Manual Only
Execution: Locked / Disabled
The Current Entry Frontier shows that Apple is now trading above the main CSE entry ranges:
Gold Current Entry Frontier: 240.44 – 248.68
Silver Current Entry Frontier: 273.02 – 283.88
Bronze Current Entry Frontier: 312.02 – 320.38
At the current quote around 330.26, AAPL is above the Bronze range. That is bullish from a structural perspective, but it also changes the risk/reward profile. Apple is no longer sitting inside the preferred entry zone. It has already moved above it.
That is why the dashboard says:
Entry Opportunity: Above Entry / Do Not Chase
Manual Overlay: HOLD / ADD WATCH
Setup: Bronze Entry Opportunity Watch
Entry Event: Hold
Order Ready: False
Auto Buy Signal: False
This is the key lesson.
AAPL can be bullish and still not be an automatic add.
The Macro Fib Thesis Lens confirms the broader structural case:
Position Archetype: Bullish Continuation
Macro Fib Status: Certified Structural Thesis — Intact
Macro Survival Support: 195.84
Tactical Repair Trigger: 249.06
Distance to Macro Support: +68.6%
Distance to Repair Trigger: +32.6%
Decision Posture: Evaluate Range — Feasibility Required
Reclaim Required: False
No Add Zone: False
Order Ready: False
That is a strong but disciplined read.
The thesis is intact.
The trend is bullish.
The tactical repair has been reclaimed.
Apple is above the Bronze Current Entry Frontier.
But CSE still requires feasibility review before any new option decision.
This is exactly the unique value of the CSE Capital — Option Decision OS. It does not just tell us whether a stock looks strong. It tells us where the stock is within the decision architecture, whether the entry zone is still attractive, whether the position should be held, whether an add can be considered, and whether the option structure is actually feasible.
For Apple, the system is not telling us to chase strength. It is telling us to respect the bullish continuation structure, manage existing exposure, and only consider new action if the full Option Feasibility + Risk Gate is passed.
That means checking premium size, liquidity, bid/ask spread, delta, expiry, time value, implied volatility, portfolio exposure, concentration risk and risk/reward before taking action.
This is the practical edge we are building.
Not prediction.
Not hype.
Not emotional trading.
A structured decision system for options and equity exposure.
AAPL remains a bullish continuation case, but the current CSE decision is disciplined: Hold / Add Watch, Evaluate Range, Feasibility Required, Do Not Chase.
Structure first.
Confirmation second.
Feasibility third.
No chase, no emotion, only process.
 Long
Long
SentinelOne: Respecting the Uptrend and Seizing Rebound Hello everyone,
Taking a look at the daily (1D) chart for **SentinelOne (NYSE: S)**, we can clearly see the structural strength of the price action and its strict adherence to a strong ascending channel. The stock is perfectly respecting both the lower and upper boundaries of this channel, confirming the continued dominance of the medium-term uptrend.
**Expected Scenario & Upcoming Price Action:**
* **Interest Rate Impact (Tactical Correction):** As indicated by the blue arrows on the chart, it is highly likely that we will see a temporary downward wave or price volatility in reaction to upcoming interest rate decisions and market anticipation. This expected dip will serve as a retest of the pivotal support zones (highlighted in green) around the **$20.50 to $22.00** levels.
* **Resuming the Uptrend (Price Strength):** Given the robust current price structure and the clear buying momentum driving higher lows, we expect these support zones to successfully absorb the negative impact. Once this correction is complete, the stock will likely use the lower boundary of the channel as a strong launchpad to resume its bullish trajectory.
**Sell Targets (Sell Zones):**
With the anticipated rebound and continued respect for the trend, we are targeting the following levels, which align with the natural extension of the ascending channel:
1. **First Target (Sell Zone 1):** Near the **$27.00 - $27.50** levels.
2. **Second Target (Sell Zone 2):** Near the **$31.00 - $31.50** levels (approaching the upper boundary of the channel).
**Conclusion:**
Respecting the trend is key here. Any pullback driven by interest rate news that remains within the channel represents an excellent opportunity for long repositioning, provided the price maintains its footing above the specified support zones and keeps the bullish structure intact.
Let me know your thoughts in the comments—do you agree with this scenario?
Happy trading everyone! 📈
Disclaimer: This analysis is strictly for educational and informational purposes only. It does not constitute financial advice, nor is it a recommendation to buy or sell any security. Trading involves risks, and you should always conduct your own research or consult a licensed financial advisor before making any investment decisions.  Long
Long
BAC – Silver Reclaimed, Share Position Opened | CSE Option DecisDate: 2026-09-15
Type: CSE Option Decision OS Update
Bank of America is now another live case inside our CSE Capital — Option Decision OS, also known as the Continuation Swing Engine.
Last Friday, we opened a small share position in BAC. The reason was not a blind buy signal, and it was not an emotional reaction to price movement. We measured the stock against the CSE dashboard and the structure was interesting enough for controlled share exposure.
The current CSE read shows a very specific picture:
Manual Action: HOLD / ADD WATCH
Underlying Thesis: THESIS INTACT
Tactical Status: TACTICAL REPAIR RECLAIMED
Add Status: EVALUATE RANGE — FEASIBILITY REQUIRED
Option Position: HOLD
Signal Confidence: 72/100
Decision Price / Current Quote: 59.67
Trend: Bullish
Next Zone: 61.95
Invalidation: 32.24
Decision Mode: Manual Only
Execution: Locked / Disabled
This is exactly why we built the CSE Option Decision OS.
A normal chart view might simply say: “BAC is bullish” or “BAC is moving higher.” But for options and structured exposure, that is not enough. CSE separates the underlying thesis, the tactical repair, the entry frontier, the add status, the option position, the risk gate and the portfolio decision.
For BAC, the dashboard shows that the thesis is intact and the trend is bullish. The tactical repair has been reclaimed, and the Current Entry Frontier shows SILVER RECLAIMED. That is important. The Silver range around 54.84–55.95 has already been reclaimed, which means BAC has moved beyond the active reclaim zone and is now approaching the next important area.
The next CSE roadmap zone is 61.95, with the Bronze range sitting around 61.40–62.51. That creates a very clear decision area. BAC is not sitting at deep support anymore. It is moving toward a higher validation zone where the market must prove whether this is real continuation or just a temporary extension.
That is why we started with shares first.
Not options.
Not aggressive leverage.
Not automatic buying.
A controlled share position gives us exposure to the thesis while keeping the decision flexible. If BAC continues toward the 61.95 area and confirms strength around the Bronze zone, the setup can become more interesting. But if price fails near that area, the position can still be managed without the same time decay pressure that comes with options.
The Structural Authority Ladder also supports the broader case:
Tactical Failure: 47.93
Tactical Repair: 49.23
Macro Survival Support: 39.25
Hard Invalidation: 32.24
The Macro Fib Thesis Lens reads:
Position Archetype: Bullish Continuation
Macro Fib Status: Certified Structural Thesis — Intact
Decision Posture: Evaluate Range — Feasibility Required
Reclaim Required: False
No Add Zone: False
Order Ready: False
That last line matters: Order Ready False.
This is the discipline inside CSE. The system can show a bullish trend, intact thesis and reclaimed structure, while still refusing to treat the setup as an automatic order. That is exactly the difference between a decision-support engine and a simple signal tool.
For BAC, the current decision is Hold / Add Watch. We already have a small share position, so the next step is not to chase. The next step is to monitor whether BAC can move into the 61.95 / Bronze validation area and hold that structure. Only then does the next decision become relevant.
For an options strategy, BAC still needs to pass the Option Feasibility + Risk Gate. That means checking premium size, liquidity, bid/ask spread, delta, expiry, time value, implied volatility, portfolio exposure, concentration risk and risk/reward before any option idea can become actionable.
The current BAC case is therefore about process.
The dashboard showed Silver Reclaimed.
The thesis remained intact.
The trend stayed bullish.
Tactical repair was reclaimed.
The next zone is clearly defined.
But CSE still requires feasibility review.
So the decision was simple: start with controlled share exposure, manage the position, keep options under review and do not chase.
This is the edge we are building with CSE Capital — Option Decision OS.
Not prediction.
Not hype.
Not emotional trading.
A structured decision system for options and equity exposure.
Structure first.
Confirmation second.
Feasibility third.
No chase, no emotion, only process.
 Long
Long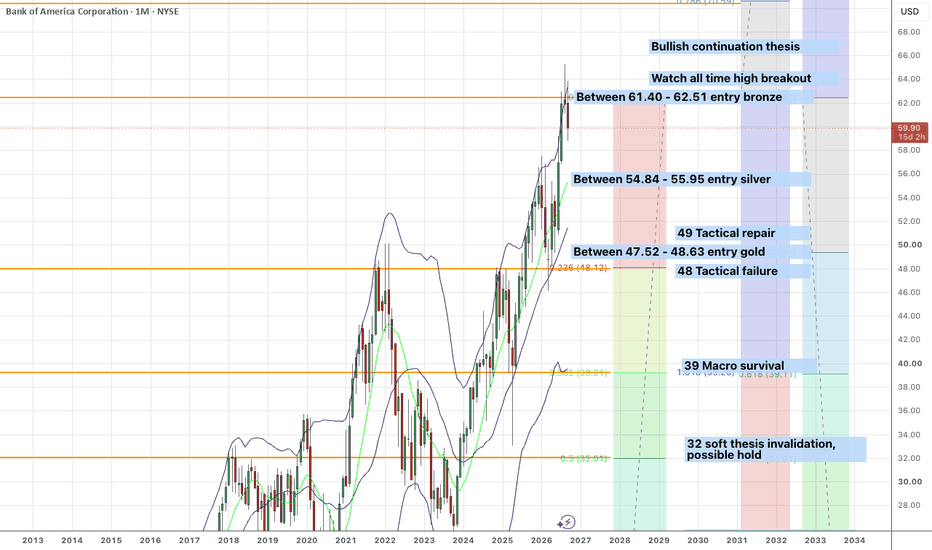
AMD – Bronze Accepted After Correction | Why CSE Chose SharesDate: 2026-09-15
Type: CSE Option Decision OS Update
AMD is currently one of the most interesting live cases inside our CSE Capital — Option Decision OS, also known as the Continuation Swing Engine.
Over the last two days, AMD gave us exactly the kind of situation where a normal trader can easily become emotional. The stock corrected sharply, volatility increased, and the question immediately became: is this weakness a warning, or is this a structured entry opportunity?
This is where our CSE decision tree becomes valuable.
Yesterday, during the correction, AMD moved into our Bronze Current Entry Frontier. The dashboard had already defined the Bronze range between 461.87 and 485.00, with the function labelled as BREAKOUT_ACCEPTED. That meant the correction was not automatically bearish. It brought AMD back into a relevant CSE decision zone.
That is why we chose to initiate a small share position first.
Not options.
Not a full aggressive add.
Not a blind buy signal.
A controlled share position.
The reason is important. AMD is structurally interesting, but CSE does not classify the current setup as fully order-ready. The system currently shows:
Manual Action: HOLD / ADD WATCH
Underlying Thesis: THESIS INTACT
Tactical Status: TACTICAL REPAIR RECLAIMED
Add Status: EVALUATE RANGE — FEASIBILITY REQUIRED
Option Position: HOLD
Signal Confidence: 75/100
Decision Price / Current Quote: 504.24
Trend: Bullish
Next Zone: 580.91
Invalidation: 291.26
Decision Mode: Manual Only
Execution: Locked / Disabled
This is exactly the distinction we want the CSE Option Decision OS to make.
The dashboard is bullish on trend and intact on thesis, but it is not saying “auto buy.” The system recognises that AMD has accepted the Bronze range, reclaimed tactical repair, and remains in a bullish continuation structure. At the same time, it keeps the decision disciplined by showing “Evaluate Range — Feasibility Required.”
That is why shares made more sense first than options.
With shares, we can participate in the thesis while keeping the position flexible. With options, the decision has to be much stricter: premium, liquidity, bid/ask spread, expiry, delta, implied volatility, concentration risk and total portfolio exposure all need to pass the CSE Option Feasibility + Risk Gate.
AMD’s Macro Fib Thesis Lens also supports the broader case:
Position Archetype: Bullish Continuation
Macro Fib Status: Certified Structural Thesis — Intact
Macro Survival Support: 359.62
Tactical Repair Trigger: 456.94
Distance to Macro Support: +40.2%
Distance to Repair Trigger: +10.4%
Decision Posture: Evaluate Range — Feasibility Required
Reclaim Required: False
No Add Zone: False
Order Ready: False
That combination is powerful, but also nuanced.
The thesis is intact.
The trend is bullish.
The tactical repair has been reclaimed.
The Bronze range has been accepted.
But the setup still requires feasibility review before any option decision.
This is exactly how we want to use CSE Capital — Option Decision OS. It is not built to generate random buy and sell signals. It is built to create a structured decision framework around Fibonacci architecture, tactical repair, entry frontiers, thesis health, option feasibility and portfolio impact.
The current AMD roadmap now points to 580.91 as the next major CSE target zone, with higher structural zones at 738.48 and 938.92. These are not guarantees or predictions. They are roadmap levels inside the model. The purpose is not to claim certainty, but to know where the next decision areas are before price gets there.
The most important part of this AMD case is the process.
Yesterday’s correction did not make us panic.
It made us measure AMD against the dashboard.
The dashboard showed Bronze Accepted.
The thesis remained intact.
The trend stayed bullish.
The tactical repair remained reclaimed.
But CSE still required feasibility review.
So the decision was: start with shares as controlled exposure, keep options under review, and do not chase.
That is the edge we are trying to build.
Not prediction.
Not hype.
Not emotional trading.
A structured decision system for options and equity exposure.
Structure first.
Confirmation second.
Feasibility third.
No chase, no emotion, only process.
 Long
Long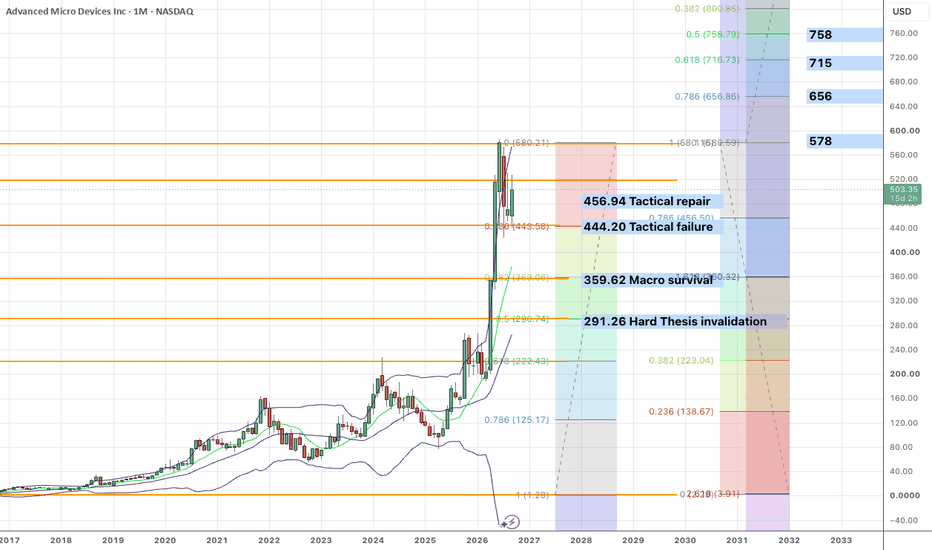
 Long
Long
Diamondback Energy Has Been CoilingDiamondback Energy has consolidated as crude oil rallies, and some traders may see potential for a breakout.
The first pattern on today’s chart is the July 2024 high of $214.50. FANG broke the old peak last month before pulling back. Is another push coming?
Second, the oil-and-gas driller made higher lows above its rising 50-day simple moving average after testing the old resistance. That could reflect bullish intermediate-term price action.
Third, Bollinger Bandwidth has narrowed as the stock forms the tighter range. That volatility squeeze may create potential for prices to expand.
Finally, the 8-day exponential moving average (EMA) has mostly stayed above the 21-day EMA since early July. That could be consistent with growing bullishness in the short term.
TradeStation has, for decades, advanced the trading industry, providing access to stocks, options and futures. If you're born to trade, we could be for you. Learn more here about TradingView’s Broker of the Year!
Past performance, whether actual or indicated by historical tests of strategies, is no guarantee of future performance or success. There is a possibility that you may sustain a loss equal to or greater than your entire investment regardless of which asset class you trade (equities, options or futures); therefore, you should not invest or risk money that you cannot afford to lose. Online trading is not suitable for all investors. View the document titled Characteristics and Risks of Standardized Options at www.TradeStation.com . Before trading any asset class, customers must read the relevant risk disclosure statements on www.TradeStation.com . System access and trade placement and execution may be delayed or fail due to market volatility and volume, quote delays, system and software errors, Internet traffic, outages and other factors.
Securities and futures trading is offered to self-directed customers by TradeStation Securities, Inc., a broker-dealer registered with the Securities and Exchange Commission and a futures commission merchant licensed with the Commodity Futures Trading Commission). TradeStation Securities is a member of the Financial Industry Regulatory Authority, the National Futures Association, and a number of exchanges.
TradeStation Securities, Inc. and TradeStation Technologies, Inc. are each wholly owned subsidiaries of TradeStation Group, Inc., both operating, and providing products and services, under the TradeStation brand and trademark. When applying for, or purchasing, accounts, subscriptions, products and services, it is important that you know which company you will be dealing with. Visit www.TradeStation.com for further important information explaining what this means.
 Short
Short
 Short
Short
Short