Long
Long
 Long
Long
 Long
Long
 Long
Long
 Long
Long
 Long
Long
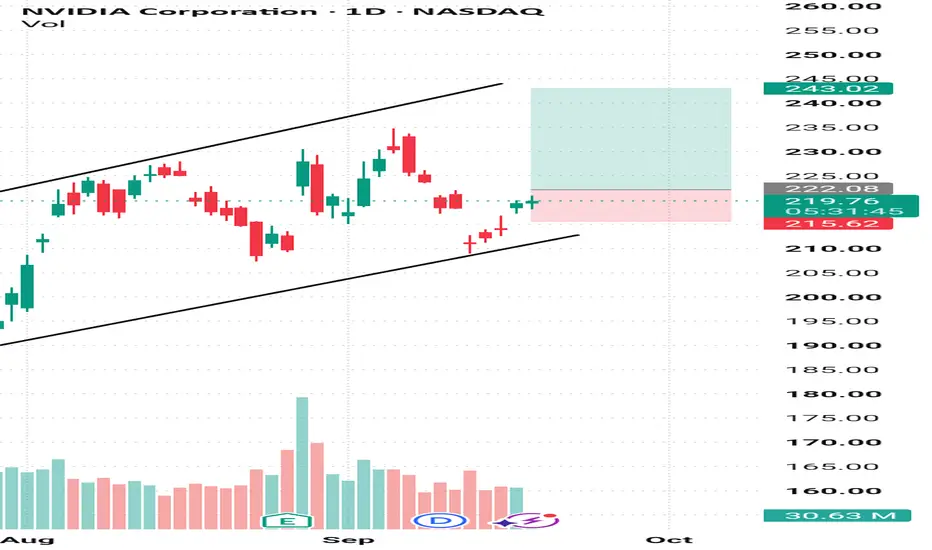
NVDA Is Back at $220 — But Can It Break the Next Wall?The FOMC reaction created a sharp pullback in NVDA, but buyers stepped back in quickly. Now price is back around $220, and this is where I think the next move starts to become interesting.
📊 My setup
On the daily chart, NVDA is trading around $220.42 inside an upward channel.
The first level I’m watching is $222.08. A clean break and hold above that level would give me more confidence that buyers are ready to push the stock higher.
If that happens, my next area of interest is around $243, which lines up with the upper part of the channel.
I’m not interested in buying just because price is moving up. I want confirmation first.
⚠️ What would change my view?
The level I’m watching on the downside is $215.62. If NVDA loses that area and starts trading below the lower part of the channel, I’d step back and reassess the setup instead of forcing a trade.
The FOMC decision also reminds me why these levels matter. The Fed raised rates by 25bps to 3.75%–4.00% on Sept. 16, and the following session saw a broad tech-led rebound.
💡 Why I’d trade this on Bitget
For an event-driven setup like NVDA, I want flexibility. Bitget gives me access to NVDAUSDT stock perps 24/7, so I’m not limited to the traditional U.S. stock market hours. Bitget also supports both long and short positions, which gives me a way to trade either direction when the setup changes.
Another thing I like is having Stocks, CFDs and Crypto on the same platform instead of moving between different exchanges when the market changes. Bitget’s stock perps are USDT-margined, so I can manage the position from the same trading environment I already use for crypto.
Liquidity matters too, especially around major U.S. market events. The campaign’s comparison highlights Bitget’s U.S. stock perp liquidity against Binance, OKX, Bybit and Hyperliquid. For me, that matters because a good setup is only useful if I can execute it properly.
🎯 My plan
Above $222.08 → watch for continuation toward $243.
Below $215.62 → bullish setup needs to be reassessed.
For now, I’m waiting for price to show me which level it wants to break rather than predicting the move.
Not financial advice  Long
Long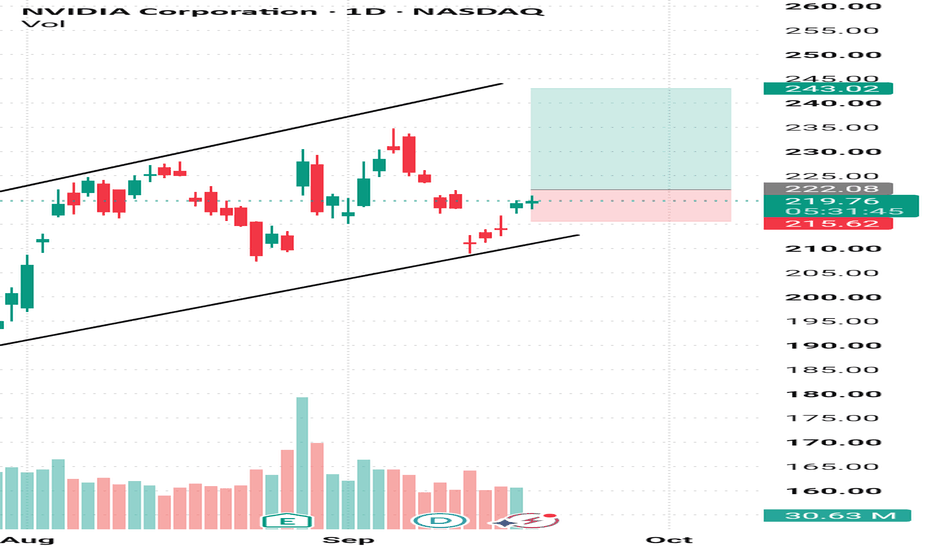
 Long
Long
NFLX: Completion of Massive Head-Shoulder, Target Zones!Hello Community,
welcome to my new analysis of NFLX on the weekly timeframe perspective. In this stock, I have detected crucial signs of completion of the massive bearish head-and-shoulders formation. Now I have identified all the factors that will be highly necessary to consider next.
When looking at my chart, we can see how NFLX formed the breakdown below the neckline of this gigantic head-and-shoulders formation. Now, it is confirming this breakdown, with the bearish continuation formation ready to form the next bearish wave towards the downside.
With the breakdown, NFLX has already activated the bearish target zones. With the current bearish momentum, it is highly likely that these targets will be reached in the upcoming times. Once the final targets have been reached, I am going to update on the bearish momentum and consider whether NFLX continues the bearish trend or not.
In this manner, thank you a lot for watching!
The support is highly appreciated.
VP
 Long
Long
 Short
Short
 Long
Long
Could Alphabet Start Moving Again?Alphabet has drifted for months, but some traders may think it’s ready to start moving again.
The first pattern on today’s chart is the long pullback since mid-May, which has seen the Internet giant bounce twice at its rising 200-day simple moving average (SMA). That may confirm a longer-term uptrend is in place.
Second, GOOGL is pushing above its 50-day SMA. That could suggest the intermediate-term trend is getting bullish again.
Third, MACD is rising and the 8-day exponential moving average (EMA) crossed above the 21-day EMA. That may indicate its short-term trend is also turning positive.
Next, Bollinger Band Width has narrowed as prices converge. Could that narrowing price action give way to expansion?
Finally, GOOGL is an active underlier in the options market. (Its average daily volume of 367,500 contracts ranks 11th in the S&P 500, according to TradeStation data.) That could help traders take positions with calls and puts.
TradeStation has, for decades, advanced the trading industry, providing access to stocks, options and futures. If you're born to trade, we could be for you. Learn more here about TradingView’s Broker of the Year!
Past performance, whether actual or indicated by historical tests of strategies, is no guarantee of future performance or success. There is a possibility that you may sustain a loss equal to or greater than your entire investment regardless of which asset class you trade (equities, options or futures); therefore, you should not invest or risk money that you cannot afford to lose. Online trading is not suitable for all investors. View the document titled Characteristics and Risks of Standardized Options at www.TradeStation.com . Before trading any asset class, customers must read the relevant risk disclosure statements on www.TradeStation.com . System access and trade placement and execution may be delayed or fail due to market volatility and volume, quote delays, system and software errors, Internet traffic, outages and other factors.
Securities and futures trading is offered to self-directed customers by TradeStation Securities, Inc., a broker-dealer registered with the Securities and Exchange Commission and a futures commission merchant licensed with the Commodity Futures Trading Commission). TradeStation Securities is a member of the Financial Industry Regulatory Authority, the National Futures Association, and a number of exchanges.
Options trading is not suitable for all investors. Your TradeStation Securities’ account application to trade options will be considered and approved or disapproved based on all relevant factors, including your trading experience. See www.TradeStation.com . Visit www.TradeStation.com for full details on the costs and fees associated with options.
Margin trading involves risks, and it is important that you fully understand those risks before trading on margin. The Margin Disclosure Statement outlines many of those risks, including that you can lose more funds than you deposit in your margin account; your brokerage firm can force the sale of securities in your account; your brokerage firm can sell your securities without contacting you; and you are not entitled to an extension of time on a margin call. Review the Margin Disclosure Statement at www.TradeStation.com .
TradeStation Securities, Inc. and TradeStation Technologies, Inc. are each wholly owned subsidiaries of TradeStation Group, Inc., both operating, and providing products and services, under the TradeStation brand and trademark. When applying for, or purchasing, accounts, subscriptions, products and services, it is important that you know which company you will be dealing with. Visit www.TradeStation.com for further important information explaining what this means. Chart Structure & Price Action JINDALSTELTrend Flip & Re-Test: Following a multi-month decline from the top (~1,300–1,400 zone) down toward the low near 980–1,020, the price bounced back to reclaim the Supertrend indicator (green shaded support area at 1,049.0). The price action shows a breakout above initial resistance followed by a downward pull to re-test the trend line before attempting a higher-high move.
Momentum Oscillator: The lower pane shows Williams %R (26) breaking above its lower downtrend line with an annotated "Early-stage bullish momentum" signal sitting near -60.18, suggesting that oversold conditions have cleared and bullish momentum is recovering.
Key Levels Annotated:
Current Price: ~1,126.0
Buy Level: Above 1,153.2 – 1,164.5
Stop Loss: 1,118.0 (Conservative) / 1,084.1 / 1,049.0 (Weekly low / Supertrend level)
Target 1: 1,164.5 / 1,196.4
Target 2: 1,196.4
Target 3: 1,244.1
Confirmation Needed: Entry is contingent on price sustaining above the 1,153.2–1,164.5 region to confirm that the trend re-test holds.
Risk Management: A breach below 1,084.1 invalids the bullish swing bias, sending price back into the Supertrend support zone at 1,049.0.
Disclaimer: aliceblueonline.com Chart Structure & Price Action JINDALSTELTrend Flip & Re-Test: Following a multi-month decline from the top (~1,300–1,400 zone) down toward the low near 980–1,020, the price bounced back to reclaim the Supertrend indicator (green shaded support area at 1,049.0). The price action shows a breakout above initial resistance followed by a downward pull to re-test the trend line before attempting a higher-high move.
Momentum Oscillator: The lower pane shows Williams %R (26) breaking above its lower downtrend line with an annotated "Early-stage bullish momentum" signal sitting near -60.18, suggesting that oversold conditions have cleared and bullish momentum is recovering.
Key Levels Annotated:
Current Price: ~1,126.0
Buy Level: Above 1,153.2 – 1,164.5
Stop Loss: 1,118.0 (Conservative) / 1,084.1 / 1,049.0 (Weekly low / Supertrend level)
Target 1: 1,164.5 / 1,196.4
Target 2: 1,196.4
Target 3: 1,244.1
Confirmation Needed: Entry is contingent on price sustaining above the 1,153.2–1,164.5 region to confirm that the trend re-test holds.
Risk Management: A breach below 1,084.1 invalids the bullish swing bias, sending price back into the Supertrend support zone at 1,049.0.
Disclaimer: aliceblueonline.com  Long
Long
 Long
Long
 Long
Long
 Long
Long
JSW Infra: Fundamentals Meet a Breakout SetupJSW Infrastructure continues to build a strong long-term growth profile through expansion of its port, cargo-handling and logistics operations. The company has also been strengthening its balance sheet to support its expansion plans, while institutional participation has increased significantly.
Fundamental Analysis
JSW Infrastructure operates in an asset-intensive industry with high entry barriers, and its financial profile reflects the benefits of scale. The company currently maintains an operating profit margin of around 48% and a net profit margin of approximately 27%. ROE stands around 14%, while ROCE is approximately 12.7%, indicating that the business continues to generate reasonable returns on the capital employed.
The long-term growth record is notable. The company's five-year net profit growth is above 400%, while operating cash flow has also increased substantially over the same period. Revenue growth remains healthy, supported by increasing cargo volumes and capacity expansion.
The latest operating numbers remain constructive. Q1 FY27 cargo volume increased to approximately 31 MT from 29.4 MT YoY, while revenue from operations increased to around ₹1,208 crore from ₹1,086 crore in the corresponding period. Operating EBITDA increased to approximately ₹601 crore, although the EBITDA margin moderated to around 49.8%.
The recent earnings picture is therefore mixed: operational growth remains intact, but PAT growth has temporarily lagged revenue and operating-profit growth.
Balance Sheet
JSW Infrastructure's leverage remains manageable. Total debt-to-equity is around 0.59x, while long-term debt-to-equity is approximately 0.55x. Interest coverage is around 7.7x, providing a reasonable cushion against interest costs.
The company's FY26 net debt-to-equity was approximately 0.27x, while net debt to operating EBITDA was around 1.19x. These levels indicate that the company has taken on additional debt for expansion, but leverage remains within a manageable range.
The company also raised approximately ₹6,555 crore through a QIP in June 2026, providing additional capital for future expansion.
Institutional Holding
One of the most notable developments in the fundamental story is the sharp increase in institutional ownership.
Institutional holding increased from approximately 9.4% in March 2026 to 20.4% in June 2026.
Within this:
FII holding: 6.9% → 11.2%
Mutual Fund holding: 2.1% → 8.7%
DII holding: approximately 2.5% → 9.2%
This represents a substantial increase in institutional participation.
Promoter holding declined from approximately 83.6% to 73.9% during the same period. However, this change needs to be viewed alongside the June 2026 QIP and the resulting increase in the company's equity base rather than being interpreted simply as promoter selling.
Valuation
The major fundamental consideration is valuation.
JSW Infrastructure trades at approximately 51x trailing earnings, around 6.7x book value, with EV/EBITDA in the high-teens. These ratios indicate that the market is assigning a significant premium to the company's future growth prospects.
Therefore, the fundamental equation is clear:
Strong business growth + improving institutional participation + manageable leverage
versus
Premium valuation + recent moderation in PAT growth.
For the valuation to remain supported over the longer term, continued revenue growth, improving earnings, disciplined capital allocation and healthy returns on incremental capital will be important
Technical Analysis
The long-term daily chart presents an interesting Cup & Handle formation.
The stock recovered from the ₹220–₹250 region and gradually moved back toward the ₹350–₹360 area, forming the cup. The subsequent consolidation around the ₹310–₹360 region represents the handle portion of the pattern.
The stock closed around ₹348.25 on September 18, 2026, after trading as high as approximately ₹356.25, with volume of around 25.41 million shares.
The price is therefore approaching an important long-term resistance zone.
Key Technical Levels
The chart identifies ₹350–₹367 as the major yearly resistance region.
Resistance
₹367 — Major breakout level
A sustained daily close above ₹367 would represent a breakout from the major resistance zone and would provide technical confirmation of the Cup & Handle structure.
The next chart-based resistance levels are:
₹396 → ₹420 → ₹465
These represent the successive upside levels marked on the chart.
Support / Reversal Zone
The ₹310–₹330 region is the key reversal and support zone.
This area becomes important because it represents the lower boundary of the recent handle/consolidation structure.
A sustained breakdown below this zone would weaken the present Cup & Handle setup and indicate that the breakout structure requires reassessment.
Cup & Handle Structure
The technical structure can therefore be visualised as:
₹310–₹330 → Reversal / Support Zone
₹350–₹367 → Major Resistance / Breakout Zone
₹367 → Breakout Confirmation
₹396 → First Major Resistance
₹420 → Next Resistance
₹465 → Higher Resistance
The most important technical confirmation would come from a sustained close above ₹367 accompanied by strong volume and improving momentum indicators.
Conclusion
JSW Infrastructure presents an interesting techno-fundamental setup. Fundamentally, the company has strong operating margins, substantial long-term earnings growth, manageable leverage and a significant increase in institutional participation. The QIP has also strengthened the capital base for future expansion.
At the same time, the valuation remains demanding, while recent PAT growth has moderated. Therefore, future earnings growth will be important in validating the current valuation.
Technically, the stock has developed a large Cup & Handle structure and is approaching the crucial ₹350–₹367 yearly resistance zone. Momentum indicators such as RSI, MACD and ADX should be monitored alongside volume for confirmation.
The key technical trigger remains ₹367. A sustained breakout above this level would place ₹396, ₹420 and ₹465 as the next chart-based resistance levels, while ₹310–₹330 remains the major structural support/reversal zone.
Disclaimer: aliceblueonline.com