Boston Scientific: Accumulation Developing?Good Afternoon,
Hope all is well. Here is my TA on Boston Scientific.
What I’m Seeing
Looking at Boston Scientific on the weekly chart, the dominant trend is still bearish. Price has fallen from roughly $105–$110 to $44, remains below a declining weekly trend/average, and has yet to establish a convincing sequence of higher highs and higher lows.
But the behavior of the decline is changing.
I've marked three significant selling events. Earlier in the decline, heavy volume produced substantial downside movement. More recently, additional selling has produced progressively less downside, while volume itself has begun to contract.
At the same time, my daily momentum has turned positive for the first time since November 2025, and the weekly negative directional component has weakened relative to the broader trend-strength measure.
To me, this potentially represents:
aggressive markdown → diminishing selling pressure → stabilization → potential accumulation.
The bottom isn't confirmed, but I think the $40–$45 region deserves attention.
The Volume Progression Is the Most Interesting Part
The first high-volume event occurred around $73–$75.
That didn't stop the decline. Sellers remained in control and price continued significantly lower.
The next major event occurred around $55–$58, again with increasing participation.
Then another occurred around $45–$48.
But look at the difference in price response.
The earlier selling generated large declines.
The later selling generated less additional downside.
That's exactly the relationship I'm interested in near the end of a prolonged markdown.
I'm essentially seeing:
large selling effort → progressively smaller bearish result.
That can indicate seller exhaustion or absorption.
It doesn't prove institutional accumulation—high volume can represent aggressive two-way trading—but if subsequent price action begins producing higher lows, the absorption thesis becomes much stronger.
The $40–$45 Area Is My Decision Zone
This is the most important area on the chart.
Price has spent several months around the low-to-mid $40s and, despite repeated selling pressure, has so far struggled to establish itself materially below this region.
That's a meaningful change from earlier in the decline.
Previously, support levels were temporary.
Price would stabilize, bounce slightly and then continue lower.
Now I'm starting to see time being spent at the lows.
That's potentially how a bottom begins.
So I wouldn't automatically call $40–$45 a buy zone.
I'd call it my observation / potential accumulation zone.
Daily Momentum Turning Positive Matters
Your annotation that daily momentum has turned positive for the first time since November 2025 is particularly interesting.
During most of this decline, momentum and price were aligned:
price ↓ + momentum ↓ = bearish confirmation.
Now that relationship is beginning to separate.
Price remains near its lows, but momentum is starting to improve.
That means I may be seeing a form of momentum divergence developing underneath the price action.
Again, divergence doesn't guarantee reversal.
But when I combine:
declining selling volume + reduced downside progress + improving momentum
I start becoming much more interested in the possibility that the downtrend is maturing.
The Weekly Signal Is Improving Too
Your weekly directional indicator observation strengthens that argument.
The negative directional component crossing underneath the weekly average directional index suggests, according to the way you're using the indicator, that bearish directional pressure is no longer behaving as strongly as it was earlier in the decline.
That's an important distinction.
It doesn't necessarily mean buyers have taken control.
It means sellers may be losing control.
Those are two different stages.
The transition I'm looking for is:
seller exhaustion → equilibrium → buyer control.
I think BSX may be somewhere between the first two.
The August Rally Was Useful Information
The rally from approximately $43 to $51–$52 was important even though it failed.
It showed that buyers can move price when selling pressure temporarily disappears.
But price couldn't sustain itself above $50 and subsequently returned toward the base.
That tells me the reversal isn't mature yet.
What happens on this retest matters much more than the original rally.
If price now holds approximately $42–$44 and subsequently creates another push toward $50, I may have the beginnings of:
low → rally → higher low → breakout.
That's the structural sequence I'm waiting for.
$50–$52 Is My First Major Confirmation
The immediate resistance area is approximately $49–$52.
That's where the August recovery failed.
So I don't become significantly more bullish simply because BSX moves from $44 to $47.
I want the market to prove it can remove the previous swing high.
Ideally:
$40–$45 base → $50–$52 breakout → controlled pullback → $46–$48 holds → continuation.
That would be the first meaningful change from the persistent lower-high structure.
$55–$60 Would Change the Character of the Chart
Above $52, I think $55–$60 becomes the next important area.
That's where one of your previous high-volume selling events occurred and where price accelerated downward.
If BSX can reclaim that region, I'd start viewing the chart very differently.
Instead of simply having a potential bottom, we'd potentially have:
base → higher low → higher high → trend recovery.
After that, the declining weekly average around the low/mid-$60s becomes the major longer-term test.
So my technical roadmap is approximately:
$40–$45 → $50–$52 → $55–$60 → $63–$67 weekly trend.
I want each level reclaimed before assuming the next.
Fundamentals — This Is Not a Broken Business
This is where BSX becomes particularly interesting.
Boston Scientific's Q2 2026 revenue was $5.44 billion, up 7.5% reported and 7.0% organically. GAAP EPS increased to $0.61 from $0.53, while adjusted EPS increased to $0.86 from $0.75. Cardiovascular organic sales grew 7.8%, while MedSurg grew 5.4%.
So unlike some of the distressed charts we've looked at, I'm not dealing with collapsing revenue.
The company is still growing.
That creates an interesting disconnect:
business growing → earnings growing → stock down roughly 60% from its highs.
That doesn't automatically make the stock cheap—the previous valuation may simply have been too high—but it does make me much more interested in what price is doing around these lows.
There Are Real Reasons for the Selloff
I wouldn't dismiss the bearish case, though.
Management lowered its full-year outlook after Q2. Adjusted EPS guidance fell from $3.34–$3.41 to $3.28–$3.32, while organic sales-growth guidance was reduced to 5–6%.
A major reason has been weaker-than-expected demand for the Watchman heart implant, along with increased competition in the U.S. electrophysiology market. Management indicated some of the Watchman pressure could continue into 2027.
So the market isn't repricing BSX for no reason.
Growth expectations have come down.
The question is whether the stock decline has now gone far beyond the deterioration in the underlying business.
And There's a New Short-Term Risk: The Cyberattack
This is important because it happened after the Q2 report.
On September 8, Boston Scientific said a cybersecurity incident discovered August 25 had disrupted global operations, including manufacturing and order processing.
The company said it is now unlikely to meet its previously issued Q3 and full-year 2026 sales and adjusted-profit guidance because of the disruption. Major manufacturing and distribution operations were recovering, but management couldn't yet quantify the full financial impact.
That's a significant near-term uncertainty.
And it may help explain why price has returned toward the lows even after the August rally.
The next major fundamental catalyst is therefore the October 28 Q3 report, when management expects to provide an updated outlook.
Why the Cyber Event Matters to My Technical Thesis
This is actually where price behavior becomes particularly useful.
BSX has just received another piece of legitimately negative news.
Yet price is still sitting around $44 rather than immediately collapsing through the previous lows.
I'm watching that closely.
If a stock receives increasingly negative headlines but stops making meaningful new lows, that's potentially evidence that the market has already discounted substantial bad news.
I wouldn't call that proof yet.
But if the cyberattack's financial consequences become clearer and BSX still holds the $40–$45 area, the support becomes much more meaningful to me.
The Product Pipeline Still Matters
The longer-term business hasn't stopped innovating either.
Boston Scientific's FARAPULSE pulsed-field ablation franchise remains an important cardiovascular growth platform. In Q2, its AVANT GUARD study met its safety and effectiveness endpoints and showed superiority over anti-arrhythmic drugs for the studied persistent atrial-fibrillation population. The company has also begun the pivotal FARADIGM trial for its FARAFLEX mapping and ablation catheter.
That matters because the long-term bull case isn't simply:
"the stock fell a lot."
It's:
the stock experienced severe multiple compression while the company continues growing and investing in important medical-device franchises.
If growth stabilizes after the current operational disruptions, that could eventually provide fundamental support for the technical bottom.
Why This Setup Interests Me
The technical and fundamental pictures are beginning to line up in an interesting way.
Technically:
heavy selling → lower lows → additional selling → less downside progress → declining volume → improving momentum → potential base.
Fundamentally:
continued revenue growth + EPS growth + strong product franchises
but also:
lower guidance + Watchman weakness + EP competition + cyber disruption.
That tells me this isn't a simple story.
The business remains healthy enough that I don't need to bet on corporate survival.
I mainly need to determine whether expectations have finally been reset low enough for price to stabilize.
My Bullish Scenario
My preferred sequence would be:
$40–$45 holds → selling volume continues declining → daily momentum remains constructive → $50–$52 reclaimed → higher low → $55–$60 breakout.
If that happens, the declining weekly trend around roughly $63–$67 becomes the major test.
A successful reclaim of that weekly trend would be the point where I'd start taking a larger reversal much more seriously.
Beyond there, I'd eventually watch the prior breakdown areas around $70–$75 and then $78–$80.
I don't need to predict a return to $100 today.
I want the market to build the staircase first.
My Bearish Scenario
The bearish scenario is straightforward.
If BSX loses approximately $40–$42, particularly with expanding volume and renewed negative momentum, my accumulation thesis weakens considerably.
I'd be especially cautious if that happened alongside a materially worse-than-expected cyberattack impact or another deterioration in underlying growth expectations.
That combination would tell me:
this isn't absorption yet—the market is still repricing the business.
I'd rather wait for another base than guess where the next low will occur.
My Bias
I'm cautiously constructive around $40–$45, but I don't think the weekly reversal has been confirmed yet.
What gets my attention is the combination of:
Repeated selling events producing progressively less downside
Volume beginning to contract near the lows
Daily momentum turning positive
Weekly bearish directional pressure weakening
Price spending more time around $40–$45 rather than immediately breaking lower
An underlying business that still generated 7% organic growth in Q2
Adjusted EPS that increased from $0.75 to $0.86 year over year
But I also have to respect the cyberattack, weaker Watchman trends and reduced growth expectations.
So for me:
$40–$45 = potential accumulation / decision zone.
$50–$52 = first structural confirmation.
$55–$60 = meaningful trend improvement.
$63–$67 = major weekly reversal test.
The key thing I'm watching now is effort versus result.
If sellers continue attacking the $40–$45 area but price refuses to move materially lower, while momentum continues improving, I'll become increasingly interested.
If buyers then push BSX through $50–$52 with stronger participation, I'll have much better evidence that what currently looks like seller exhaustion is actually beginning to transition into accumulation and a new recovery cycle.
Trade Safely
Enjoy!  Long
Long
 Long
Long
ADBE bullish viewHi everyone,
Following my discussion with ExpertTrader21, I wanted to share my bullish trend continuation thesis as an alternative perspective to his bearish outlook. As I mentioned under his trade idea, I see ADBE (Adobe) as both a short-term and a long-term bullish play.
1. Short-Term Trade Setup:Risk-to-Reward (RR): I've set up a short-term 3:1 RR ratio from the current price, targeting the previous swing high.Fib Extension Target: An even higher RR can be achieved by using the Fibonacci extension to project a potential Higher High at 324.7
2. High Timeframe (HTF) Framework:Pitchfork Analysis: Some of the lines on my chart belong to a high timeframe Pitchfork. You can clearly see how the price bounced perfectly off the lower boundary of the Pitchfork and has started its mean reversion process toward the median line.HTF AVWAP: I have anchored a second AVWAP on the higher timeframe (the red line). This serves as my macro target for a long-term position in Adobe at around $400, which nicely aligns with the Pitchfork's median line.
3. Daily Chart Confluences:Market Structure: The daily chart shows a clear Market Structure Shift, now forming Higher Highs and Higher Lows.Divergences & Support: My analysis is backed by multiple volume and RSI divergences at the bottom, alongside dynamic support from the anchored VWAP where the potential new bullish vector started.Volume Profile (VPVR): The Anchored Volume Profile on the right indicates we are testing a High Volume Node, acting as strong support. If this area holds, an intermediate target before the macro move would be around $350.
From a fundamental perspective, Adobe is a highly healthy company. The combination of strong business fundamentals, historically high free cash flow (FCF), and a record-low P/E ratio adds significant weight to my mean reversion thesis, signaling that the asset is deeply undervalued at current levels.
Any feedback is highly appreciated! Good luck, traders!  Long
Long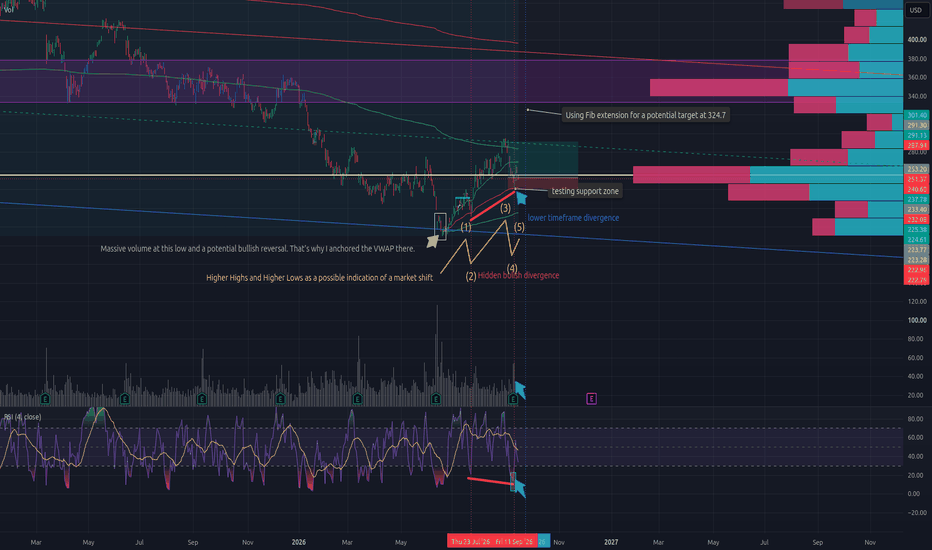
 Long
Long
The Sport Trading Resembles MostThe US Open just finished and I spent a fair amount of time in front of it over the two weeks. Somewhere in the middle of that, an old question came back to me: if trading is like a sport, which one?
Boxing gets a lot of votes. You take damage, you keep standing, nobody can help you. Chess for the pattern recognition. Golf for the internal monologue. Motorsport for the risk management.
I'm going with tennis. Partly because I started playing at five and it's the sport I understand from the inside. But mostly because of something tennis does with its scoring, which I think is the more useful comparison.
Tennis
Tennis is an individual, performance-based sport. No defender to blame, no teammate to carry you, no substitution at half time. You and the scoreboard, for hours. Trading has the same structure and the same loneliness.
Same with the toolset. A player needs a serve, a backhand, a volley, movement, something to fall back on when the main weapon isn't working — and a trader assembles a comparable set of tools for trend, levels, ranges and volatility.
Both of those are real. Both are also shared with boxing and golf, so neither is what makes tennis the closest fit. That comes from the scoring.
Fifty-four percent
Roger Federer once told a graduating class that "In tennis, perfection is impossible," and then gave them the number behind it: across his career he won almost 80% of his matches, and only 54% of the points he played.
That speech got used heavily, usually for the mindset lesson — don't dwell on the last shot, move to the next one. Fair enough. What tends to get skipped is that the number isn't personal to Federer.
Nadal and Djokovic sit in the same place. More than 60 majors between the three of them, career win rates around four matches in five, and point-win rates all hovering a shade above half. Nobody in the recorded era has meaningfully exceeded it.
Three of the greatest careers the sport has produced, built on losing nearly every second point.
And it goes further than that. Roughly one ATP match in twenty is won by the player who won fewer total points. Not a rounding error — it happens throughout every season, including the 2019 Wimbledon final, where Djokovic beat Federer having won fewer points, 204 to 218, and fewer games, 32 to 36.
Tennis makes points unequal
That gap between 54% of points and 80% of matches isn't luck. It's architecture.
Tennis doesn't add points up. It bundles them. Four points make a game, six games make a set, two or three sets make a match — win by two at each level — and every bundle resets to zero when it closes. Win a set 7-6 and you carry nothing forward. Win it 6-0 and you carry exactly the same nothing forward.
Which means the same physical point is worth wildly different amounts depending on where it sits. A point at 40-0 on your own serve is nearly free. A point at 30-40 on your opponent's serve, second set, 4-5 down, is the match. Identical shot, identical effort, completely different consequence.
The scoring could have been built on total points won — simpler, and the better player would win more often. Whatever the origins of the system tennis actually uses, the effect is that when you perform matters more than how much.
One difference is worth naming before going further. A tennis player can see break point on the scoreboard — 30-40, second set, the stakes printed right there in front of them.
Traders get no such display. Every setup looks roughly like the others going in, and which one mattered only becomes clear afterwards. Same structure, with the useful information removed.
Which is exactly why it becomes a mental game
Djokovic put it plainly after a French Open semi-final years ago: at that level everyone is developed, committed and disciplined, and in the end it's mental determination that decides who wins.
At the top of the sport the physical gap between players is small. Everyone has the shots. What separates them is the handful of points where the scoring system has quietly raised the stakes.
There's an old line in tennis that you're always playing two opponents — the one across the net, and yourself. The scoring structure is what gives the second one its openings. Nothing much is at stake in a routine service game. It's 30-40 in the second set where the second opponent shows up.
Watch a professional at 40-0 and then watch the same player facing break point. The intensity isn't the same, and it isn't supposed to be. The serve goes to the pattern they trust most rather than the one that might win the point outright — the charting data shows players reaching for their most reliable delivery roughly twice as often on break points. The low-percentage winner attempt disappears. Some players visibly grow in those moments and some visibly shrink, and that difference has produced more careers and ended more of them than technique ever has.
Conceding a set
There's a tactic in tennis I don't think has an obvious equivalent anywhere else.
Watch a player at 0-5 down in a set. They stop chasing it. Risk goes up on the returns because there's nothing left to protect, the shots get looser, and the mind has already moved to the next set. A shirt change, a slow walk, a bathroom break. The set is treated as spent.
From the outside it looks like giving up. It isn't. It's a calculation about energy — the set is gone, and whatever gets spent fighting for it won't be available twenty minutes later when the score is level again.
The trading version is closing before the stop is hit, because the reason for the trade stopped existing. Not every exit has to be forced by the market.
And here's why conceding is available as a tactic at all: losing a set 0-6 costs exactly one set. Losing 6-7 after two hours of tennis also costs exactly one set. You cannot lose more of a set than one set, no matter how badly it goes.
The scoring system is a stop loss written into the rules of the game. That's why a player can be dismantled in the first set and still win in four — and why a 54% point-win rate produces three of the greatest careers ever instead of a wipeout.
A tennis player only needs to protect the sets. A trader, unable to tell which position was the important one, has to protect all of them.
What does carry over
I'd be overstating it if I said the damage stays inside the set. It doesn't.
Get taken apart 6-1 and something travels into the next one. The doubt. The sense that your opponent has your number. A small hesitation on a shot you'd normally hit without thinking. The scoreboard resets automatically. The head doesn't.
That's the second opponent doing its work. The one across the net gets a rest between sets. The one in your head doesn't.
Traders know this from the far side of a losing streak. The account is down by a defined, survivable amount, exactly as planned. The person sitting in front of the screen is in worse shape than that number suggests, and starts reading the next setup through it.
And here trading is arguably harder than tennis, because the second opponent is the only one you have. The market isn't trying to beat you. It doesn't know you're there.
Where the comparison breaks
Two places, and both are worth stating.
Tennis caps the upside. Winning a set 6-0 earns exactly what winning 7-6 earns — all that extra dominance converts to nothing. Trading doesn't work that way. A trade allowed to run can return several times what a stopped-out trade cost, and that asymmetry simply isn't available to a tennis player.
The second one is bigger. Tennis has no mechanism for ruin. Lose a match and you lose a match. There is no version of the sport where one bad afternoon empties the bank account.
For that, you need a different sport. Years ago I put some hours (maybe too many) into a WRC rally game, and one run has stayed with me. Mexico. Fifteen stages driven cleanly, in contention for the win, everything managed. Then stage sixteen felt like the moment to press the pedal to the floor and go for the win — and the car went off a cliff. Fifteen stages of discipline erased in about four seconds.
So, which sport?
Tennis, for the structure. Unequal points, contained losses, a second opponent the scoring keeps inviting in, and a system honest enough to admit that winning more points and winning the match are two different things.
Rally for the warning about what the tennis analogy leaves out.
Thanks for reading 😊
Which sport would you pick — and what does it get right that tennis doesn't?  Education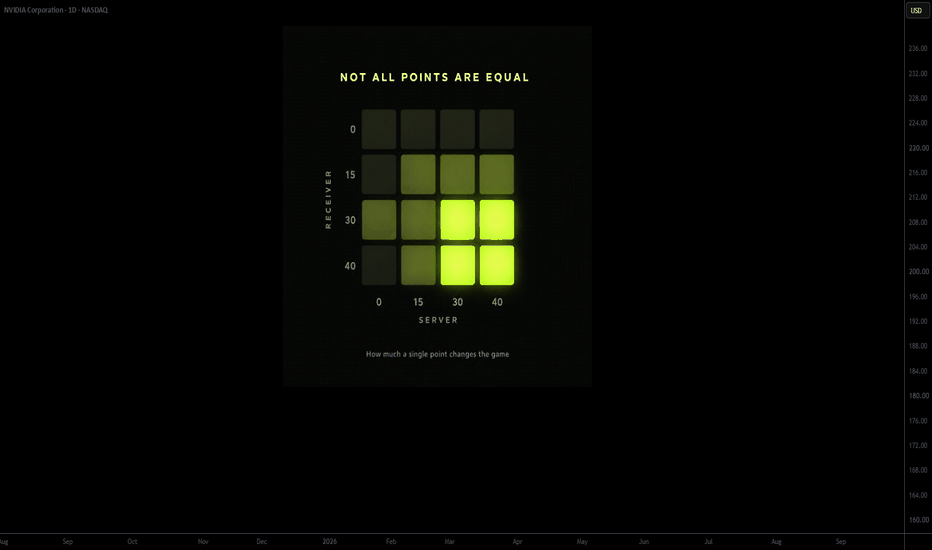
Oracle’s $664B Backlog: The AI Re-Rating Toward $250+Oracle has quietly become one of the most leveraged public-market bets on the AI infrastructure boom. Fiscal 2026 revenue reached a record $67.4 billion, with cloud infrastructure (IaaS) growing 77% to $18.1 billion; the first quarter of fiscal 2027 then accelerated further, with total revenue up 30% to $19.3 billion and IaaS more than doubling at +121% to $7.4 billion. Remaining performance obligations now sit at $664 billion—nearly ten times trailing annual revenue—after another $30-plus billion of AI contracts were booked in the latest quarter. Management guided fiscal 2027 revenue to at least $90 billion (roughly 34% growth) and non-GAAP EPS to $8.10, giving unusual visibility for a company of this size.
The core of the upside case is conversion of that backlog into recognized, high-utilization revenue as new megawatts come online. Oracle delivered 850 MW of capacity in Q1 alone and is targeting $90–95 billion of capex this year, yet a growing share of the hardware is prepaid or customer-supplied, which reduces the cash drain relative to earlier fears. GPU utilization is running near 98% with renewals occurring at premium pricing, and the OpenAI/Stargate-related commitment (on the order of $300 billion over roughly five years) is only the largest of several large-scale AI training and inference deals. If even a conservative portion of the contracted capacity ramps as planned, cloud infrastructure can become the majority of the company and support a multi-year revenue CAGR in the high-20s to low-30s, with operating leverage appearing once the current build-out cycle matures.
Risks remain real: heavy debt and equity issuance to fund data centers, customer concentration, and the possibility that AI spending growth slows or that power/grid constraints delay sites. Those concerns have already compressed the multiple and produced a large drawdown from the prior highs. Still, the combination of contracted revenue visibility, accelerating IaaS growth, and improving (if still negative) free-cash-flow optics versus earlier expectations is why longer-term models from some analysts point toward $200 billion-plus in revenue by the early 2030s and meaningful EPS compounding if margins on OCI settle in the 30–40% range once utilization and scale are achieved.
Technically, the 8-hour chart shows price sitting near the five-month point of control around current levels after a multi-month range, with a well-defined prior swing high near $250 and a higher target zone in the mid-to-high $200s if the stock can reclaim the $176 area and resume the prior uptrend. The financial trajectory—backlog conversion plus continued triple-digit IaaS growth—is what would most plausibly fuel that kind of re-rating; the chart simply maps the path price would need to travel if the fundamental story continues to deliver.  Long
Long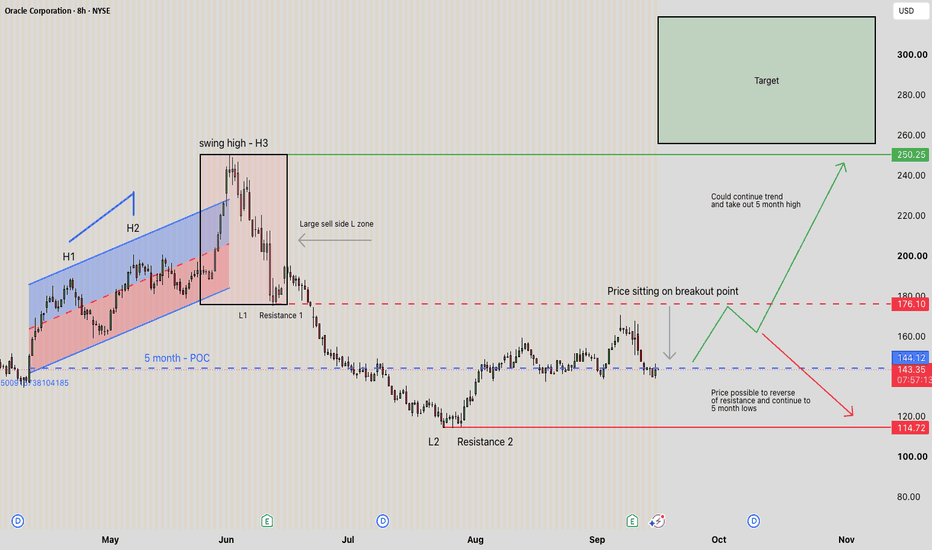
 Long
Long
 Long
Long
 Long
Long
 Long
Long
 Long
Long
Waste Management: Headed for our Target ZoneAs recently as Friday, Waste Management dipped to $213, but has since edged slightly higher. Overall, the stock remains on track and continues to target our green Target Zone on the downside ($205.67–$194.11). Primarily, we expect further near-term declines, which should ultimately bottom out within our green Target Zone. After that, we anticipate a resumption of the larger corrective advance, which should push WM up toward resistance at $262.75. Following this move, we expect another major sell-off phase. On the other hand, if resistance at $262.75 is broken in the near term, our alternative scenario could come into play. In this case, the larger wave count would already be further along, and the stock would be entering the final stage of the broader upward cycle (probability: 36%). ASX:ALD AMPOL — Strong Trend, Historical Extension, Limited UpsiAMPOL — Strong Trend, Historical Extension, Limited Upside
If the crisis is restricting oil supply or shipping routes, where does Ampol get the crude to refine?
Good for Ampol: fuel/product shortages can push refining margins much higher.
Bad for Ampol: crude can become more expensive, freight costs can rise, suitable barrels can become harder to source, and physical supply itself can become the bottleneck.
So the key point is:
A fuel shortage can help Ampol only if it can reliably source crude/feedstock and the refining margin widens faster than its crude and freight costs rise. A crude-supply crisis is not automatically bullish for a refinery.
43.25 → 36.5 → 30.6 → bounce ~34.4 → reassess
The important part is the route and the reaction points along the way — not expecting price to move in one straight line.
As price changes, the map adapts to the evidence. Check the updates for any changes to the route.
No narrative needed. No crystal ball — just the map.
I’m not trying to predict the unknown.
I’m trying to chart it.
I’m trying to be a Chart Navigator.
— Cay7mon
Likes and comments are always welcome 😄
About this map:
This forecast map isn’t trying to predict the exact price. It maps the probable direction, route and reaction points so there’s a game plan ahead of time.  Short
Short
Is Eli Lilly Pulling Back Into a Possible Area of Value?Weekly Support Back in Play
After reaching a fresh all-time high at $1,292.65, Eli Lilly has pulled back into the important weekly support zone around $1,100. This is an area we highlighted back in July as one to watch on any meaningful pullback.
Primary Trend Remains Strong
Price remains comfortably above the bullishly crossed 100/50-week EMAs. Both averages have supported the broader rise since 2018, keeping the primary trend firmly to the upside.
Selling Volume Is Decreasing
Volume has been falling as price pulls back towards support. For now, that suggests sellers are not becoming increasingly aggressive as LLY moves lower.
Bearish Divergence Still a Warning
There is bearish RSI divergence on both the weekly and daily timeframes. RSI does remain above 50, but the divergence means bulls should not completely dismiss the possibility of further weakness.
Momentum Is Oversold
StochRSI has now dropped into oversold territory. With price simultaneously testing weekly support, this is an interesting area to see whether buyers begin stepping back in.
What Bulls Need Next
A break above the end-of-August high at $1,188.33 would strengthen the case that the current pullback is ending. That would bring the recent highs and potentially the $1,292.65 all-time high back into focus.
In Summary
Eli Lilly has pulled back into the $1,100 weekly support zone after reaching a fresh all-time high, potentially offering an interesting area of value within the broader uptrend. The bullishly crossed 100/50-week EMAs remain supportive and selling volume is decreasing, although bearish RSI divergence still warrants some caution. If buyers step back in, a break above $1,188.33 would strengthen the case for the pullback ending and put the highs back in focus. 9/16/26 - $crwd - Best short in mkt rn9/16/26 :: VROCKSTAR :: NASDAQ:CRWD
Best short in mkt rn
- pretty funny to see roxanne (a director) decide to sell 2/3 of her shares worth... $12M y day
- and just for lolz i looked again
- another director gerhard looking to dump more than 2x that of his colleague
- they might be believers in the company (who isn't tbh)
- but they sure are happy for the liquidity
- remember the flows are what are wagging this thing, not any sort of fundamental investors - they don't exist anymore (i'm sure of this)
- if you can't articulate why 1000x cash earnings for the N12M is a good investment here, then you are gambling, which is fine
- i'm prepared to size this up on the fed announcement today - i really don't care which way it goes, i have some ST OTM stuff to put on the size, but really am hoping for a one or two day rally toward the $250 line and then i'm going to take this to a max size short (which for me is usually ~30% and will decide on the leverage, but typically i budget for between 5-10x to put that on)
- just for comparison and forgive me for making the crime of comparing across geos (fx), industries etc. etc.
- but NYSE:NU is here w/ v similar net margins growing just as fast and trades 10x cheaper on an effective basis (and that's on cash earning btw, ignoring the fact that >50% of crwd eps is non-cash SBC)
- wow
- nobody left in this market. which means if you have even a crumb of critical thinking skills PLUS patience, you'll do very well
- but no, NASDAQ:CRWD isn' a good long here lol
V  Short
Short
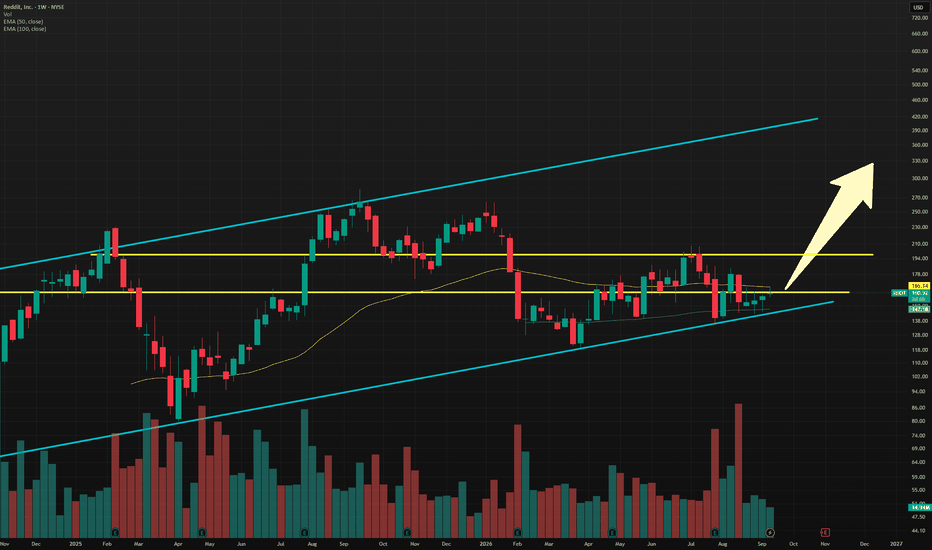
RDDT is Ready for Take Off! Heading to $400+NYSE:RDDT Reddit has been my favorite stock to own and trade since its IPO in March 2024. I have held shares, sold options around the position, and watched the stock repeatedly respect the same broad ascending channel. With RDDT once again approaching the lower portion of that channel, I believe the chart is setting up for a potentially important move. The bullish case is there, but the breakout still needs confirmation.
## The Long-Term Structure
I am looking at RDDT on the weekly logarithmic chart. Reddit does not have decades of price history to study, but we now have enough data to identify a meaningful structure. Since the IPO, the stock has formed a rising channel with several clear reactions along its lower boundary. Buyers have repeatedly stepped in near that trendline, while the upper boundary has marked major areas of resistance. That includes a prior peak above $230 and the current all-time high of $282.95.
The 50-week and 100-week exponential moving averages are also on my chart. Price has spent considerable time trading around these averages, which adds to the importance of the current area.
## The Level That Matters Now
RDDT is sitting near a price zone that has repeatedly changed roles between support and resistance. This level first acted as resistance in November 2024. After the stock broke through it, the area became support. RDDT later fell back below it, formed a small cup-and-handle pattern, and has continued interacting with the same zone ever since.
That behavior is typical of RDDT. The market has struggled to consistently price the business, creating sharp moves in both directions. For long-term shareholders and options sellers, that volatility can create opportunity, but it also means that confirmation matters.
## What Would Confirm the Bullish Setup?
The first step is a decisive break above the nearby resistance zone. Beyond that sits a larger, longer-term resistance level that has capped the stock multiple times over roughly the past year. If RDDT can reclaim both levels and hold above them, I believe the probability of a move to new all-time highs increases significantly. From there, the upper boundary of the ascending channel projects toward approximately $420.
That does not mean the stock will travel there in a straight line. Reddit tends to move violently in both directions, and failed breakouts are always possible. I want to see price break resistance, hold the breakout, and turn the former ceiling into support.
## My Position and Trade Plan
I am long approximately 1,000 shares of RDDT. I also own RDTL, the GraniteShares 2x Long RDDT Daily ETF. RDTL is not something I would recommend for most investors. It targets two times the daily move in RDDT, which means volatility is amplified and performance over longer periods can be affected by daily compounding and decay. It requires active monitoring and a very high tolerance for risk.
If RDDT reaches the upper portion of the channel near $420, I will likely sell or meaningfully reduce my position. At that point, I would expect the possibility of a backtest before the next phase of the longer-term trend. My longer-term price target remains $500, so trimming near the top of the channel would be a tactical decision rather than a loss of conviction in the business.
## What Would Weaken the Thesis?
The bullish setup would weaken if RDDT fails to reclaim resistance and then loses the lower boundary of the ascending channel. A sustained breakdown below that trendline and the major weekly moving averages would force me to reassess the structure.
For now, the setup is straightforward:
RDDT is near the lower portion of its long-term ascending channel.
A historically important support and resistance zone is being tested.
A confirmed breakout could open the door to new all-time highs.
The upper channel target is approximately $420.
My longer-term target remains $500.
The opportunity is attractive, but the chart has not fully confirmed the move yet. I am bullish, positioned for upside, and watching the next breakout attempt closely.
*This is my personal analysis and trade plan, not financial advice. Leveraged ETFs in particular carry substantial risk and may not be appropriate for long-term holding.*
 Long
Long