• Products
  • Community
  • Markets
  • Brokers
  • More
Get started
  • Markets
  • /World stocks
  • /Ideas
#TIMETECHNO breakout on chartTrendlyne Breakout on chart ready for upmove add till 190 for 227(short term) /next ress level 250 after that will review again stoploss below 173 for st traders
NSE:TIMETECHNO
by asheshbajpai
22
Concor strong breakout with strong volumeToday concor has witnessed a volume and price breakout, price was consolidating between 442 and 480 zone now the level has breached and structure is good, atleast it is above change of character in 1 H chart, for tomorrow 15th july or whenever it breaks 495 and closes a 15 minute candle above it than buy with sl 486 for target 505 508 514 in intraday , postional can go long till 528 536 Now, in 1H chart still break of structure is not there but still change of character is there which signifies bullishness, rest wait for level and keep strict sl while trade, for positional sl will be 480 scenario 2: it goes gapdown than enter near 480 484 zone with sl 477
NSE:CONCORLong
by casualtrader_ct
Updated
Breakout from 2yr old resistance!!!HFCL gave breakout from its 2 year of resistance. Moreover, volume accumulation is high in recent times and during breakout. Expect to give good upside. Wait for retest and confirmation.
NSE:HSCLLong
by Naveenpothiraj
33
Adani Power cmp 231.50 Daily ChartAdani Power cmp 231.50 Daily Chart - Support Zone 205 to 225 Price Band - Resistance Zone 240 to ATH 254.20 Price Band - Expecting a New ATH soon enough by current trend
NSE:ADANIPOWER
by PIYUSHCHAVDA
Updated
66
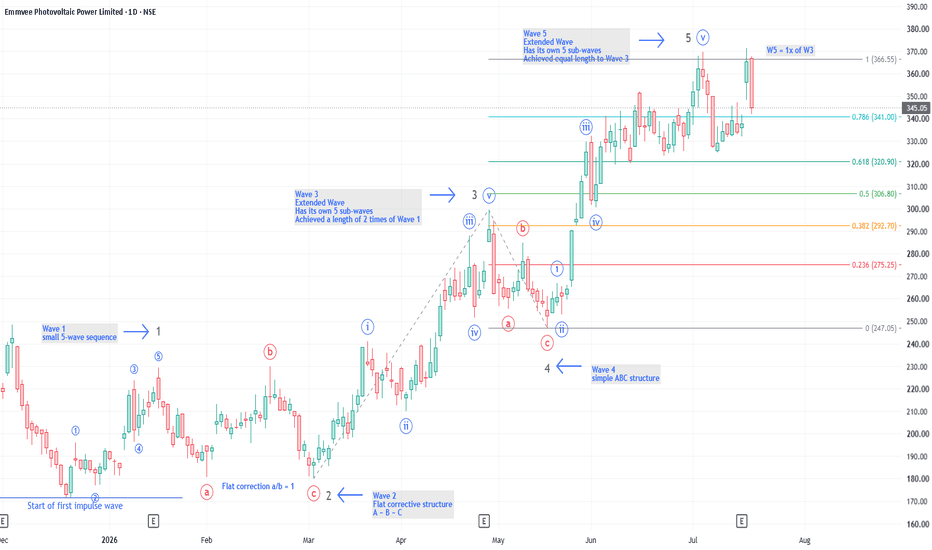
Elliott Wave Principle: Understanding Wave ExtensionsFollowing my last week post on the Complete Elliott Wave Market Cycle, here is another important concept for beginners: Wave Extensions. Ever wondered why some trends suddenly accelerate far beyond expectations? In Elliott Wave Principle, the answer is often a Wave Extension. In a standard impulse, the market advances through five waves; out of the five, three are actionary waves which move in the direction of the larger trend . Wave 1 – Actionary Wave 2 – Corrective Wave 3 – Actionary Wave 4 – Corrective Wave 5 – Actionary What Is a Wave Extension? An extension is an elongated impulse wave with exaggerated internal subdivisions . In most impulse structures, only one of the three actionary waves is typically extended. The extended wave develops its own visible five-wave subdivision , allowing it to travel significantly farther than the other actionary waves. This is the reason why suddenly a trend accelerates. Depending on which wave extends, the structure is referred to as, Wave 1 Extension, Wave 3 Extension or Wave 5 Extension. Why Extensions Matter Extensions provide a useful clue about the likely behavior of future waves. For example: If Wave 1 and Wave 3 are of similar length, there is an increased probability that Wave 5 may become the extended wave. This relationship helps traders anticipate where additional momentum may emerge. What the Chart Shows In this example, both Wave 3 and Wave 5 display extended characteristics: Wave 3 : Extended. Developed its own 5-wave subdivision, achieved a length of ~2× Wave 1 Wave 5 : Extended. Developed its own 5-wave subdivision. Achieved an equal length of Wave 3, known as equality. Additional Learning from the Same Chart Wave 2 formed a Flat correction , one of the three primary corrective structures. This appears to be a Regular Flat , where: A ≈ B ≈ C. The internal symmetry of the correction is clearly visible on the chart. What to Watch Next The decline following the completion of Wave 5 is beginning to resemble another Flat corrective structure . At this stage, it is still developing, so the final classification will become clearer only as additional waves unfold. The Key Takeaway Extensions often explain why a trend accelerates unexpectedly and can provide valuable clues about the structure of the remaining move. Educational purpose only — not a buy or sell recommendation.
NSE:EMMVEEEducation
by ChartTheWave
22
BUY TODAY SELL TOMORROW for 5%DON’T HAVE TIME TO MANAGE YOUR TRADES? - Take BTST trades at 3:25 pm every day - Try to exit by taking 4-7% profit of each trade - SL can also be maintained as closing below the low of the breakout candle Now, why do I prefer BTST over swing trades? The primary reason is that I have observed that 90% of the stocks give most of the movement in just 1-2 days and the rest of the time they either consolidate or fall Cup and handle breakout in AIIL BUY TODAY SELL TOMORROW for 5%
NSE:AIIL
by Kapil-Mittal
22
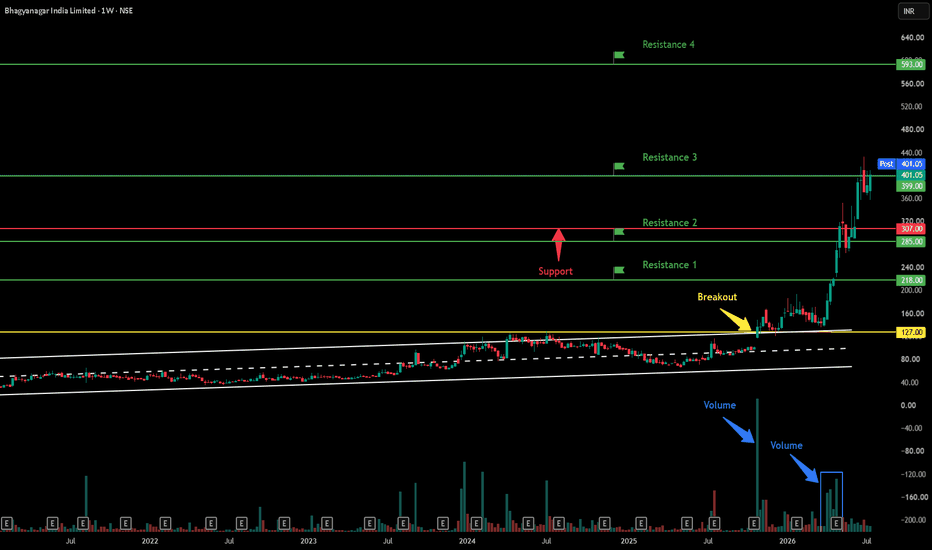
Bhagyanagar India Ltd - Breakout Setup, Move is ON...#BHAGYANGR trading above Resistance of 399 Next Resistance is at 593 Support is at 307 Here are previous charts: Chart is self explanatory. Levels of breakout, possible up-moves (where stock may find resistances) and support (close below which, setup will be invalidated) are clearly defined. Disclaimer: This is for demonstration and educational purpose only. This is not buying or selling recommendations. I am not SEBI registered. Please consult your financial advisor before taking any trade.
NSE:BHAGYANGRLong
by MandeepSinghKohli
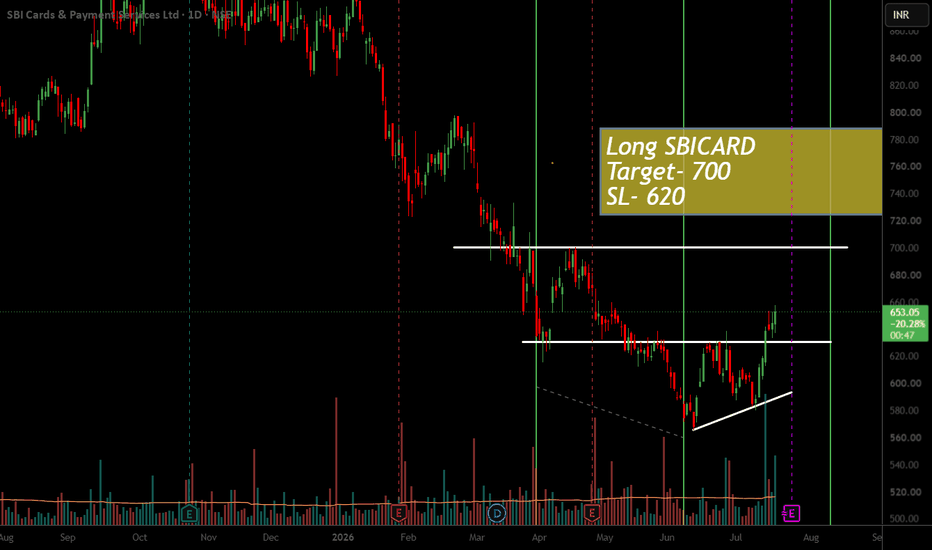
Long SBICARDSBICARD is looking good in lower zone it should reach in 700 as first target with SL 620 Traingle breakout with higher high formation started Pattern looks good with good volume
NSE:SBICARDLong
by bullsbearsclub
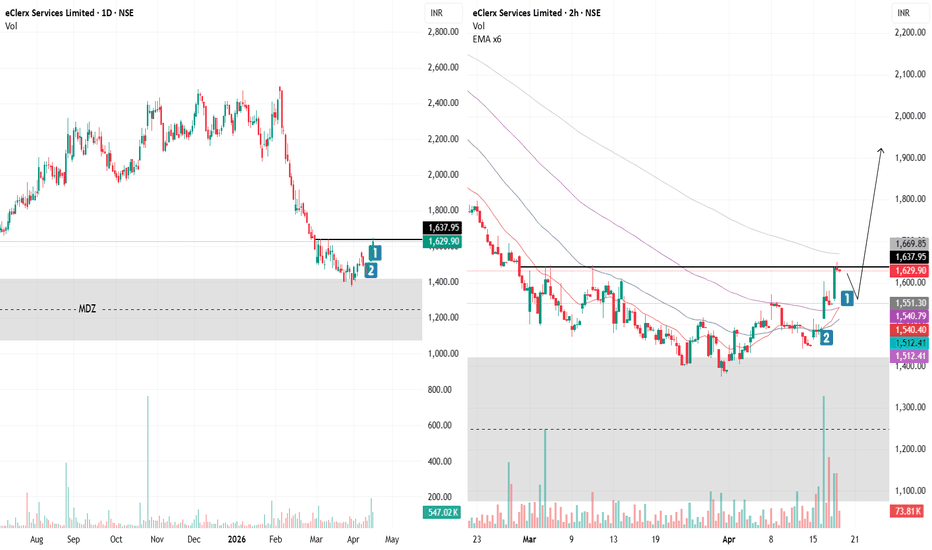
ECLERX - A long term viewNSE:ECLERX Observation on Daily chart: Price had took support from Monthly demand area After hitting MDZ, price show little strength revealing that selling pressure no more exists On Daily, short term EMA20 is holding price Still may little struggle as rest EMA/s are above the price Trend is still can not be consider up properly On 2hr chart: While on Daily consolidation, this intraday chart reveal some more depth. Price from bottom, rising up with healthy volume indicates some massive trading is going on Today price tried to escape upper marked line but showing failed attempt Price may take little pullback till marked area with numbers That smaller pullback with volume dry-up will be good to buy at bottom area Trend on 2hr chart can be consider up on small time frame chart as an early decision Strategy: Small Bottom Buy and rest quantity should be added as pyramiding with long term target of approx. 2500 as a long term view Warning: Trading without knowledge depth, experience and proper risk management may be harmful. I am not a registered analyst, here I am only sharing my view to trading communities, this is not any buy or sell recommendation. Do consult your financial advisor prior any trade.
NSE:ECLERXLong
by KingDoxa_trades
Updated
Manappuram Preparing Fresh ExpansionManappuram Finance Ltd. | Daily Timeframe Price has finally reclaimed a major multi-month resistance zone after spending a long period in rounded accumulation. The structure reflects gradual strength development, where every corrective phase continued to print higher lows, a sign of sustained buying interest on the higher timeframe. The recent pullback near resistance also appears constructive rather than weak, forming a smaller continuation structure just beneath the breakout area. This type of compression often precedes expansion if buyers maintain control above the key level. The projected upside target is derived from the previous corrective swing measurement, which has now been mirrored toward the upside following the breakout attempt. As long as price sustains above the resistance reclaim zone, the bullish continuation scenario remains active. Key Levels-: Breakout Resistance: ₹320 Confirmation Zone: Sustained acceptance above ₹320 Projected Upside Target: ₹348–350 The overall structure currently favors trend continuation over reversal while price remains above the breakout base. Educational analysis only, not financial advice. Regards- Amit.
NSE:MANAPPURAMLong
by AMIT-RAJAN
Updated
1010
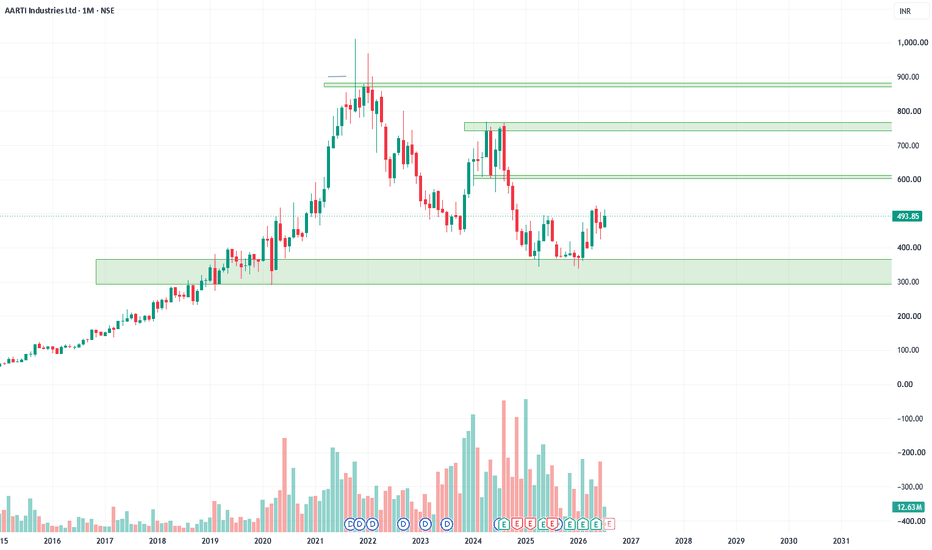
AARTI INDUSTRIES,1M, Investment ideaAarti industries have taken support on 400 levels. Looks good for further upside. Accumulate in dips for the target of 600,750
NSE:AARTIINDLong
by VinitaNaiduAndra
11
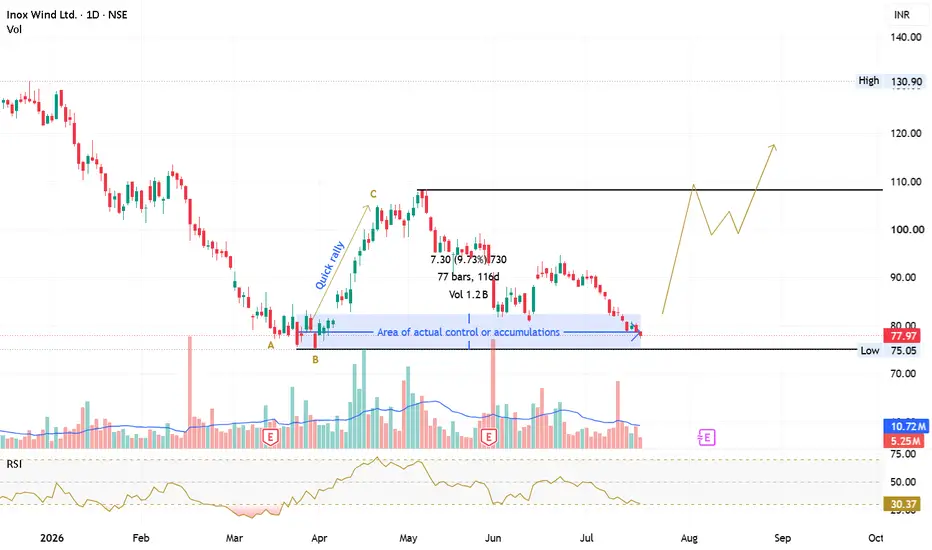
INOXWIND : Developing an Observational PerspectiveNSE:INOXWIND Inox Wind Ltd. is one of India's leading wind energy solutions providers, engaged in manufacturing wind turbine generators while offering end-to-end services including project development, EPC, commissioning, operations, and maintenance. Backed by the INOXGFL Group, the company continues to benefit from India's growing renewable energy transition, supported by an improving order pipeline and execution capabilities. ------------------------------------------------------------------------------------------------------------------- Key Technical Observations: • A clear downtrend remained intact until 17 March 2026 (Point A). • Between 17 and 30 March 2026, price entered a consolidation phase (Point B). • On 8 April 2026, price showed its first meaningful sign of strength accompanied by above-average volume. • The move from Point B to Point C (7 May 2026) developed into a sharp upside rally with strong volume participation. • After the rally, price corrected on comparatively lower participation and later reacted near the previous demand area. ------------------------------------------------------------------------------------------------------------------- Understanding the Price Story: • Point A represents the first visible attempt to slow the prevailing selling pressure. • The region between Point A and Point B appears to be an area where sell-side supply was gradually absorbed. • The impulsive rally from Point B to Point C suggests the possibility of a temporary sell-side liquidity vacuum, allowing price to advance rapidly. • Based on current price behaviour, the 75–83 zone can be treated as a working hypothesis for a potential accumulation area rather than a confirmed fact. • The recent decline may indicate reduced buying activity, while the latest reaction near this zone suggests buyers are still willing to defend it. ------------------------------------------------------------------------------------------------------------------- What Needs Further Confirmation? Before developing a bullish bias, I would prefer to observe: • A Hammer, Bullish Engulfing, or Strong Bullish Marubozu forming within the ₹75–83 zone. • A high-volume bullish session followed by narrow-range candles, indicating sustained demand rather than a one-day spike. • Daily RSI reclaiming and sustaining above the 50 level. • Price closing back above ₹83 on a daily basis. • Price closing below ₹74 on a daily basis, invalidates the hypothesis . ------------------------------------------------------------------------------------------------------------------- Educational Takeaway: This analysis is purely observational and demonstrates how market participants can build a hypothesis by combining price structure, volume behaviour, and market context. The objective is not to predict the future but to continuously validate or invalidate the hypothesis as new price data becomes available. ------------------------------------------------------------------------------------------------------------------- This is for educational purposes only and should not be considered investment advice.
NSE:INOXWIND
by KingDoxa_trades
BHEL Surges to Record Highs on Earnings RevivalHighlights * BHEL has witnessed a strong breakout following its Q1FY27 earnings announcement, with the stock hitting a fresh 52-week high as investors cheered its return to profitability and robust revenue growth. The stock continues to outperform the broader PSU and capital goods space. * The **₹440–₹445** zone remains the immediate resistance area. A decisive close above this range could confirm the continuation of the ongoing rally and open the door for an advance towards **₹470–₹490** in the near term. * On the downside, the **₹415–₹420** range serves as immediate support, while the **₹390–₹400** zone remains a strong medium-term demand area. Holding above these levels would keep the bullish structure intact. * Momentum indicators remain firmly positive, with RSI trading in bullish territory and MACD continuing to signal strengthening upward momentum. The stock is also trading comfortably above its 20-day, 50-day, 100-day, and 200-day moving averages, highlighting the strength of the prevailing uptrend. * The stock has formed a strong higher-high and higher-low pattern on the daily chart, accompanied by above-average trading volumes, suggesting sustained institutional participation rather than a short-term speculative move. * Strong execution in the power and infrastructure segments, improving order inflows, government-led capex spending, and increasing opportunities in thermal, nuclear, and defence-related projects continue to provide a favorable fundamental backdrop for BHEL's medium-term growth prospects. Takeaway BHEL is displaying one of the strongest technical setups within the PSU space after delivering a decisive earnings-led breakout. A sustained move above **₹445** could accelerate buying momentum and push the stock towards the **₹470–₹490** zone in the coming weeks. As long as BHEL holds above the **₹415–₹420** support range, the technical bias remains firmly positive, making short-term pullbacks potential accumulation opportunities rather than indications of a trend reversal.
NSE:BHEL
by yogeshwar
Tanla Platforms cmp 581.50 Weekly ChartTanla Platforms cmp 581.50 Weekly Chart - Support Zone 440 to 550 Price Band - Resistance Zone 600 to 715 Price Band - Double Bottom Support formed at 400 to 410 - Bullish Cup & Handle by Resistance Zone neckline - Breakout attempted of Falling Resistance Trendline - Price seems shouldering on Rising Support Trendline - Volumes getting in close sync with avg traded quantity
NSE:TANLA
by PIYUSHCHAVDA
55
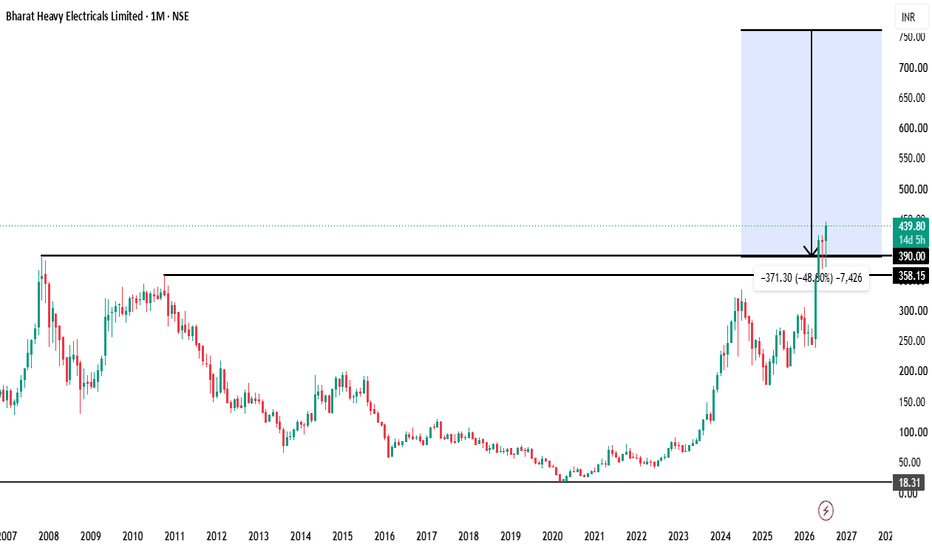
BHEL | Multi-Year Monthly Breakout BHEL | Multi-Year Monthly Breakout Could Mark the Beginning of a New Bull Cycle After spending several years below a major resistance zone, BHEL has finally broken above an important long-term supply area around ₹390. Technical Observations • Multi-year resistance breakout • Monthly closing above resistance • Higher highs and higher lows • Long-term accumulation appears complete • Strong momentum returning If buyers continue defending the breakout zone, the stock could attempt a move toward the next major resistance near ₹750 over the longer term. Key Levels 📍 Breakout Zone: ₹390 📍 Support: ₹390–400 📍 Current Price: ₹438 📍 Long-Term Resistance: ₹750 Trading Plan ✔ Watch for monthly closes above ₹390. ✔ Pullbacks toward the breakout zone may offer better risk-reward opportunities. ✔ A decisive breakdown below the breakout zone would weaken the bullish structure. This analysis is for educational purposes only and should not be considered financial advice.
NSE:BHELLong
by RShivashankar
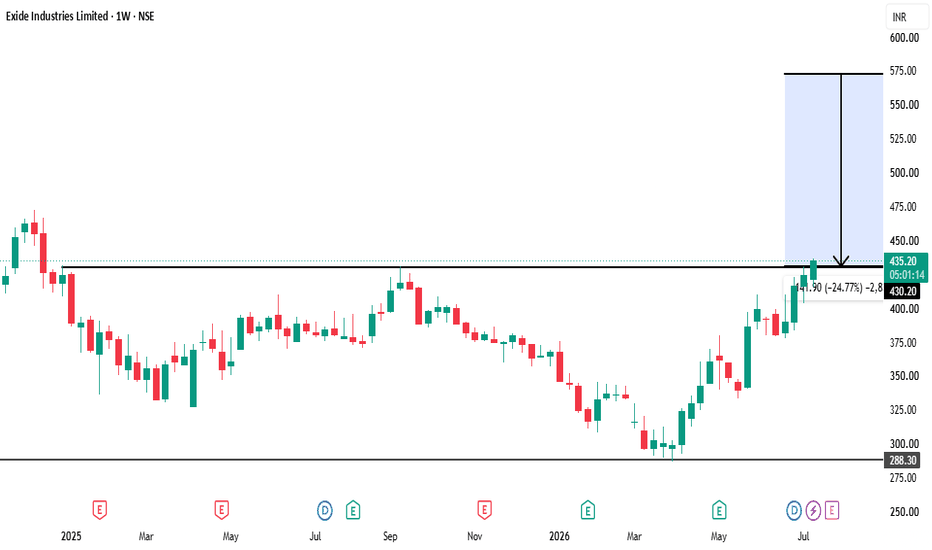
Exide Industries Ltd. (NSE: EXIDEIND)🏆 #4 Stock Setup of the Day | Exide Industries Ltd. (NSE: EXIDEIND) 📈 Timeframe: Weekly Chart 🚀 Strong Breakout Above Key Resistance Signals Bullish Momentum Exide Industries has completed a strong recovery from its 2026 lows and has now broken above the important ₹430 resistance zone. The breakout is backed by improving price structure, suggesting buyers remain firmly in control. 🔹 Current Price: ₹436.15 🔹 Breakout Level: ₹430 🔹 Major Target Zone: ₹570–₹575 🔹 Potential Upside: ~25% 📊 Technical View ✅ Fresh weekly breakout above a long-term resistance zone ✅ Higher Highs & Higher Lows indicate a strengthening uptrend ✅ Strong recovery after a prolonged consolidation phase ✅ Price is trading above key support levels, maintaining bullish momentum 👀 Key Levels to Watch 🟢 Support Zone: ₹420–₹430 🔵 Breakout Confirmation: Sustained weekly close above ₹430 🎯 Projected Target: ₹570–₹575 💡 Trading Perspective A successful retest of the ₹430 breakout zone could provide additional confirmation of trend strength. As long as the stock sustains above this level, the probability of a continuation toward the projected target remains favorable. 📈 Trend Bias: Bullish ⚠️ Disclaimer: This chart is shared purely for educational purposes and technical analysis. It is not a buy or sell recommendation. Please conduct your own research and follow appropriate risk management before making any investment decisions. 🔥 Follow for daily high-probability breakout setups, swing trading opportunities, and in-depth technical analysis.
NSE:EXIDEINDLong
by RShivashankar
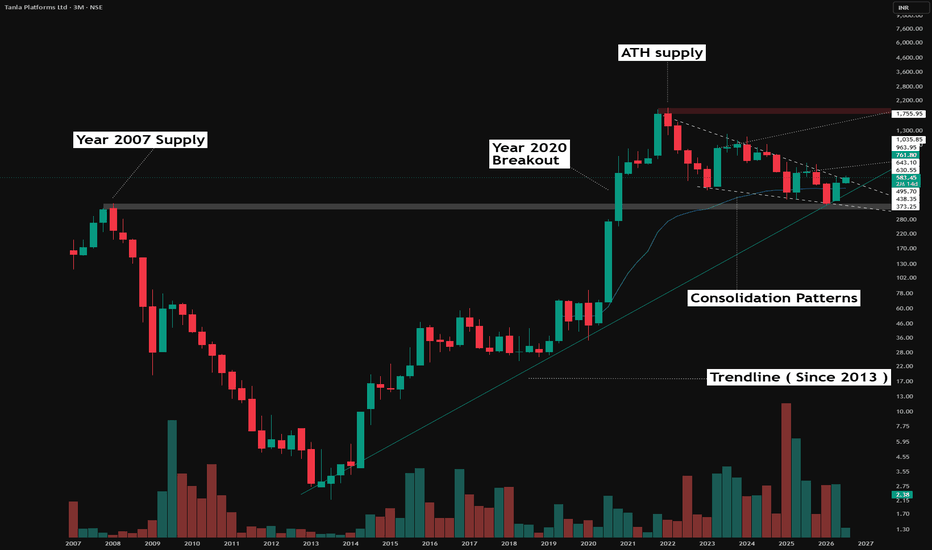
Thirteen Years Later, The Chart RememberedThe Timeframe Each candle on this chart represents three months of price action. On this scale, what unfolds is not weeks or even years of behavior but multi decade structure. 2007: The Supply That Held for Thirteen Years In 2007, this stock reached a high that would go on to define its ceiling for the next thirteen years. Every attempt to move above that level failed. 2020: The Breakout After Thirteen Years In 2020, the stock finally broke through that same 2007 supply zone. This was not a minor technical event. Breaking a level that held for thirteen straight years carries real structural significance. Following the breakout, price sustained above the zone and went on to create a fresh all time high. Consolidation Above the Breakout Above this newly flipped zone, the chart shows a consolidation pattern. This refers to a series of candles moving in a relatively sideways manner following a strong rally, as the market pauses to hold and absorb the gains The Trendline from 2013 A trendline drawn from 2013 has continued upward and is still relevant on the chart today. A trendline is simply a line connecting a series of highs or lows that reflects the underlying direction and structure of price over time Disclaimer: This post is purely educational and observational in nature based on historical price action on a three month timeframe. It does not constitute financial advice, a forecast, or a recommendation to buy, sell, or hold any security
NSE:TANLALong
by Averoy_Apoorv_Analysis
33
BSE Ltd — Pulling Back Hard, Watching the 0.618 Fib + Wedge ZoneOverview BSE has had a strong run since April, but today it's seeing a sharp fall (currently down 2.11%, trading around 3,607). This drop has brought price right into an important zone — where an old Fibonacci level and a wedge pattern are meeting. Let's break down what we're watching. What's Happening Price rallied hard from 3,031 all the way to a high of 4,446 in just a couple of months. That's a big move, so some pullback is normal. Since then, price has been falling in a wedge shape (marked in red), and today's fall has pushed it right down to the 0.618 Fib level around 3,572. Right now, price is trading between its two EMAs — below the 50 EMA (3,800) but still above the 200 EMA (3,209). This tells us the bigger uptrend isn't broken, but the stock is definitely cooling off hard after its big run. Key Levels to Watch Zone to Watch: 3,570–3,610 (0.618 Fib + wedge support meeting here) If this zone breaks: next level is 0.786 Fib at 3,334 If price bounces from here: first hurdle above is 0.5 Fib at 3,739, then 0.382 Fib at 3,906 Bigger picture support: 200 EMA around 3,209 Since the Market Is Still Open Today This is based on where price is trading right now, not a closed candle. Since we're mid-session, wait for the close today (or even a session or two more) before treating this zone as confirmed support or a broken level. Two Ways This Can Go If the zone holds: A bounce from here, especially with a strong green candle, would be a good sign buyers are stepping back in. Watch for price to reclaim 3,739 next. If the zone breaks: A close well below 3,570 today or tomorrow would mean sellers are still in control, and 3,334 becomes the next zone to watch. Beginner's Lesson When a stock falls sharply after a big rally, it's easy to panic or get excited too early. The smart move is to mark the zone where multiple signals line up (like we did here with the Fib level and wedge), and then simply wait. Let price show you what it wants to do, rather than guessing in the middle of a sharp move. Conclusion BSE is testing an important zone today after a strong rally. As always, we prefer to wait for confirmation rather than jumping in mid-fall. We'll keep watching and post an update once this plays out. For educational purposes only. Not financial advice. Always manage your risk.
NSE:BSE
by Hkd88
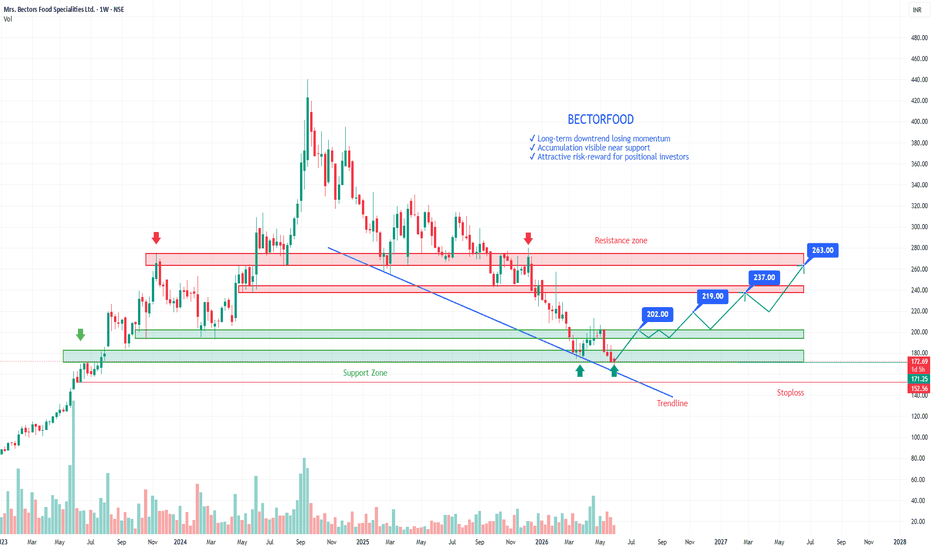
BECTORFOOD: Demand Zone Reversal | Positional Upside Towards 263BECTORFOOD is showing signs of a strong reversal after a prolonged correction, with price currently trading near a key multi-year demand zone. Entry Zone: 170–173 Why I'm Bullish: ✔ Strong demand zone at ₹175–₹200 with multiple successful retests ✔ Price finding support near long-term trendline confluence ✔ Higher-low structure indicating weakening selling pressure ✔ Signs of accumulation near the lows ✔ Favorable risk-reward for positional investors Targets: 🎯 ₹202 → ₹219 → ₹237 → ₹263 Invalidation: ❌ Weekly close below ₹152.50 As long as the demand zone remains intact, the stock has the potential to gradually move toward higher resistance zones over the coming months. Educational purpose only. Not financial advice.
NSE:BECTORFOODLong
by ThePrimeTraderTV
Updated
22
Market Structure Shift: ACEMarket Structure Shift => After MSS, wait for price to pullback => Look for Bullish Order Block/ FVG Zone from where CHoCH was made => Wait for price to Retest from Latest Bearish OB, which is just below the CHoCH candle => This Zone work for Support in future => See reaction if price come back to this Zone DOWNTREND/STOP LOSS => Original downtrend Swing Low will Invalide if price fall below Swing Low, it is confirmation of Bearish Trend. => Exit when price fall below Swing Low OR when it come to retest this level. HOW TO EXIT WITH MINIMUM LOSS => Look for Bid Spread => If it is wide-- exit on Limit Order => If Narrow-Exit on Market Order Not an investment advice. Investment subject to market risk. Enter at your peril and consquences.
NSE:ACE
by trade_vocate
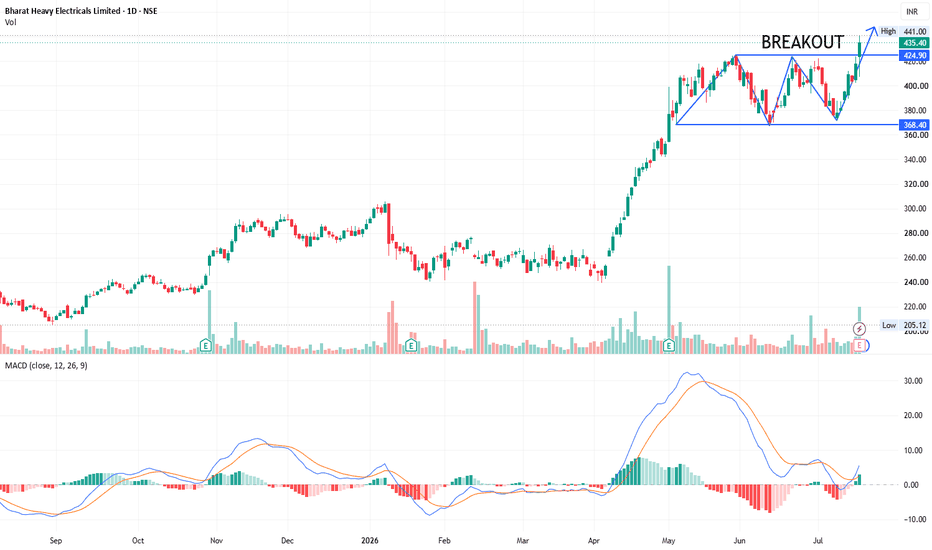
Double Bottom Breakout - BHEL📊 Script: BHEL 📊 Sector: Capital Goods 📊 Industry: Heavy Electrical Equipment Key highlights: 💡⚡ 📈 Stock is giving double bottom breakout on daily chart. 📈 Script is trading at upper band of BB. 📈 MACD is giving crossover . 📈 Double Moving Averages will give crossover. 📈 Right now RSI is around 66. 📈 Its a PSU stock might move slower as compare to other stocks. 📈 Stock is giving dividend to so it might effect price too. 📈 One can go for Swing Trade. ⏱️ C.M.P 📑💰- 435 🟢 Target 🎯🏆 - 462 ⚠️ Stoploss ☠️🚫 - 424 ⚠️ Important: Always maintain your Risk & Reward Ratio. ✅Like and follow to never miss a new idea!✅ Disclaimer: I am not SEBI Registered Advisor. My posts are purely for training and educational purposes. Eat🍜 Sleep😴 TradingView📈 Repeat 🔁 Happy learning with trading. Cheers!🥂
NSE:BHELLong
by radha_23
11
AARTIIND: Coiled for a Breakout | Ascending Triangle (4H)The stock has been forming a clear Ascending Triangle pattern since the last few months, which is a strong bullish continuation setup. the price action has compressed beautifully, setting up a prime opportunity for a momentum trade. Key Technical Observations: The Resistance : There is a rigid supply zone right at the 504 - 505 level. The price has tested this area multiple times since early May and is currently pressing hard against it. Dynamic Support: Buyers are aggressively stepping in at higher prices, as seen by the clear ascending trendline from the mid-April lows. This indicates strong accumulation. Volume Contraction: As the price gets squeezed into the apex of the triangle, volume has normalized. We are waiting for a significant volume expansion to confirm the next directional move. The Trade Plan: The 4-hour chart provides the broader structure, but the actual execution relies on catching the momentum on the lower timeframes (5m/15m). Long Scenario (Breakout): Wait for a decisive candle close above 505 on strong volume. If it breaks out and sustains, we can look to ride the intraday momentum upward. Rejection Scenario: If the price prints a strong bearish reversal candle at the 504-505 zone, we might see a quick scalp opportunity back down toward the ascending trendline support. Levels to Watch: Entry Alert: Break & sustain above 504.50 - 505.00 Immediate Support: Ascending trendline Invalidation: A 4H close below the ascending trendline invalidates this bullish setup. Disclaimer: This is for educational purposes only. Always manage your risk and wait for proper volume confirmation before entering.
NSE:AARTIINDLong
by Silent_Kitty
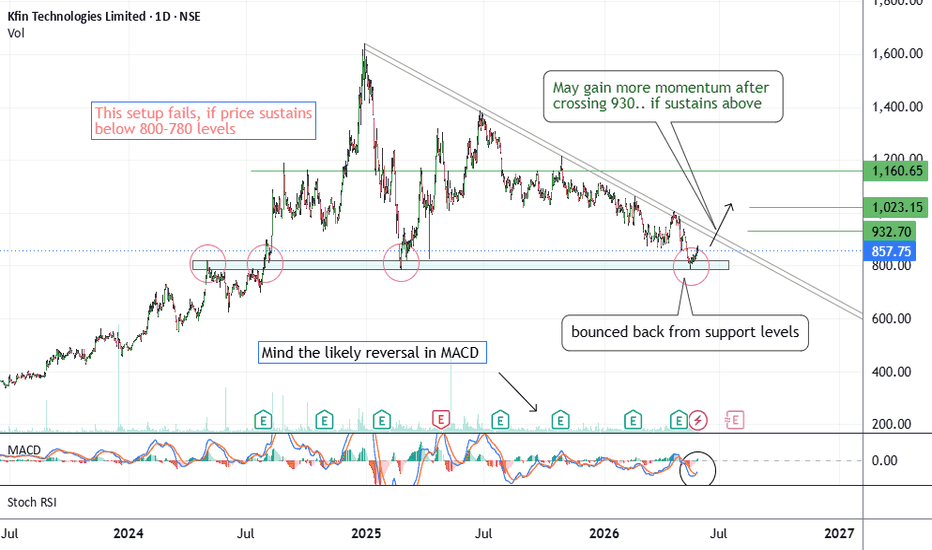
Kfintech - Showing ReversalCMP 857.75 on 30.05.26 It is observed on the daily chart that the price has taken support on the previous support levels around 800. And shown a bounce back too. MACD movement should also be considered. If it sustains above the support levels and gains momentum (depending on the market conditions), may go 930/1030 or more. The setup fails if sustains below 780 on daily basis. Position size and risk management should be wisely calculated everytime. All this illustration is only for learning and educational purpose. It is not a buy or sell advice. Please consult your financial advisor. All the best.
NSE:KFINTECHLong
by anandlive
Updated
112233445566778899101011111212131314141515161617171818191920202121222223232424252526262727282829293030313132323333343435353636373738383939404041414242
…999999

Made by humans

Select market data provided by ICE Data Services. Select reference data provided by FactSet. Copyright © 2026 FactSet Research Systems Inc.Copyright © 2026, American Bankers Association. CUSIP Database provided by FactSet Research Systems Inc. All rights reserved. SEC filings and other documents provided by Quartr.© 2026 TradingView, Inc.

More than a product
  • Supercharts
Screeners
  • Stocks
  • ETFs
  • Bonds
  • Crypto coins
  • CEX pairs
  • DEX pairs
  • Pine
Heatmaps
  • Stocks
  • ETFs
  • Crypto coins
Calendars
  • Economic
  • Earnings
  • Dividends
  • IPOs
More products
  • News Flow
  • Portfolios
  • Fundamental Graphs
  • Yield Curves
  • Options
  • Macro Maps
  • Pine Script®
Apps
  • Mobile
  • Desktop
Community
  • Social network
  • Wall of Love
  • Refer a friend
  • House Rules
  • Moderators
Ideas
  • Trading
  • Education
  • Editors' picks
Pine Script
  • Indicators & strategies
  • Wizards
  • Freelancers
  • Paid Spaces
Tools & subscriptions
  • Features
  • Pricing
  • Market data
  • Gift plans
Trading
  • Overview
  • Brokers
  • Brokers comparison
  • The Leap
Special offers
  • CME Group futures
  • Eurex futures
  • US stocks bundle
About company
  • Who we are
  • Space mission
  • Blog
  • Help Center
  • Careers
  • Media kit
Merch
  • TradingView store
  • Tarot cards for traders
  • The C63 TradeTime
Policies & security
  • Terms of Use
  • Disclaimer
  • Privacy Policy
  • Cookies Policy
  • Accessibility Statement
  • Security tips
  • Bug Bounty program
  • Status page
Business solutions
  • Widgets
  • Charting libraries
  • Lightweight Charts™
  • Advanced Charts
  • Trading Platform
Growth opportunities
  • Advertising
  • Brokerage integration
  • Partner program
  • Education program
Community
  • Social network
  • Wall of Love
  • Refer a friend
  • House Rules
  • Moderators
Ideas
  • Trading
  • Education
  • Editors' picks
Pine Script
  • Indicators & strategies
  • Wizards
  • Freelancers
  • Paid Spaces
Business solutions
  • Widgets
  • Charting libraries
  • Lightweight Charts™
  • Advanced Charts
  • Trading Platform
Growth opportunities
  • Advertising
  • Brokerage integration
  • Partner program
  • Education program
Look FirstLook First