Jubilant Pharmova Limited Breakout StructureCurrent Price Action
Last Traded Price (LTP): ₹1,011.40 (Up by +3.79% or +₹36.95)
Daily Range: Open ₹979.30 | High ₹1,013.90 | Low ₹976.25
Indicators
9 SMA: Currently at ₹976.94
Supertrend (7, 2): Currently at ₹943.08 (indicating a bullish trend)
Chart Patterns & Structure
Consolidation Channel: The stock spent May, June, and early July consolidative within a defined horizontal rectangular range.
Breakout: The current daily candle shows a clear breakout above the Upper Breakout Weekly level (marked around ₹1,019.90).
Annotation Note: The chart explicitly notes a "Daily 9 SMA and Super trend break out", indicating strong upward momentum supported by these moving averages.
Key Support & Resistance Levels
Resistance / Targets
Stop Loss: 978
Primary Target: ₹1,118.50
Secondary Target: ₹1,184.80
Full Target: ₹1,248.00
Support / Breakout Levels
Upper Breakout Weekly: ₹1,019.90 (Immediate pivot zone being tested)
Lower Break Down Weekly: ₹931.05 (Bottom of the consolidation range)
Disclaimer: aliceblueonline.com  Long
Long
 Long
Long
 Long
Long
TIPSMUSIC | Bullish Setup | Price Action AnalysisTechnical View
TIPSMUSIC has transitioned from a prolonged downtrend into a strong impulsive recovery. After establishing a higher low around ₹490, the stock rallied sharply and is now consolidating just below a key resistance zone near ₹710.
The current consolidation appears constructive rather than weak. Price is moving sideways after a strong advance, suggesting that sellers have not been able to push the stock meaningfully lower. This type of price action often represents absorption of supply before the next directional move.
A Bear Trap has also been identified by the NG Trap Detector near the lower end of the consolidation. The subsequent recovery indicates that sellers were trapped below support and buyers quickly regained control, reinforcing the bullish undertone.
Bullish Scenario
Sustained trade above ₹680–690 keeps the short-term structure positive.
A decisive breakout and close above ₹710–720 may trigger fresh momentum.
If confirmed, the stock could enter a fresh markup phase with higher highs.
Bearish Scenario
Failure to hold the consolidation range followed by a close below ₹650–620 would weaken the current structure.
Such a move would indicate that the breakout attempt has failed and may lead to a deeper retracement.
Technical Summary
Pattern: Bullish Flag / Ascending Consolidation
Primary Trend: Bullish
Current Structure: Healthy consolidation after a strong rally
Support Zone: ₹650–620
Immediate Resistance: ₹710–720
Bias: Bullish while above support
What stands out
The most encouraging aspect of this chart is not the breakout itself, but the character of the consolidation. Price has spent several weeks moving sideways immediately below resistance instead of giving back the previous gains. This generally reflects strength, institutional accumulation, and reduced selling pressure. A convincing breakout above ₹710 could mark the beginning of the next leg higher.
Disclosure: This technical view is based on price action and chart analysis and reflects the prevailing market structure at the time of publication. Market conditions may change without notice, and there are no guaranteed returns in the stock market. Investors should conduct their own due diligence, assess their financial objectives and risk profile, and use appropriate risk management before making any investment decisions. The Research Analyst and/or clients may have existing or future positions in the security discussed. Any such holdings do not influence the objectivity of this technical analysis.
Additional Disclosure : This security was recommended to the Research Analyst's clients around the ₹510 price zone. The Research Analyst and/or clients may continue to hold positions in the security. This disclosure is made in the interest of transparency and should not be construed as a guarantee of future performance.  Long
Long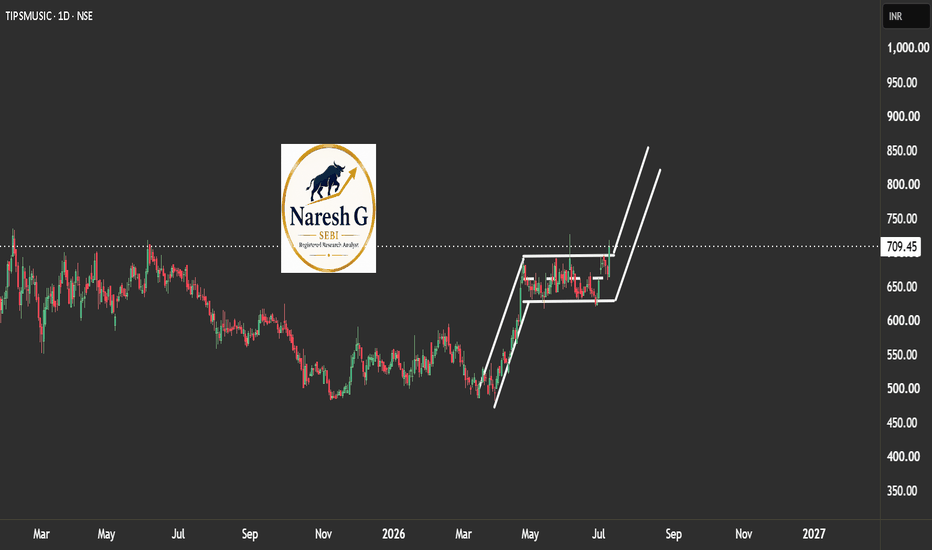
 Long
Long
 Long
Long
 Long
Long
Flute RSI: A Potential Wave 2 Completion Signal Before Wave 3Introduction
One of the challenges of Elliott Wave analysis is identifying when a corrective Wave 2 has truly ended and when a new impulsive Wave 3 is about to begin.
Over the past several months, I have been studying a recurring relationship between price structure and RSI behavior that appears repeatedly before many significant bullish advances.
I call this pattern Flute RSI.
This article presents the concept, its market psychology, and several examples. The research is ongoing, and I welcome feedback from traders, technicians, and Elliott Wave practitioners.
The Core Observation
In many corrective structures:
Price continues making lower highs.
RSI also makes lower highs.
RSI breaks its downward trendline before price does.
RSI then pulls back and successfully retests the broken trendline.
Price subsequently completes its correction and begins a strong advance.
The key insight is that momentum appears to improve before price confirms the change.
Why " Flute RSI "?
The name comes from the appearance of the chart.
Price and RSI often form parallel downward trendlines during the correction, resembling the body of a flute.
When RSI breaks the trendline and later returns to test it, the move resembles a musician covering a flute hole before producing the next note.
After this "tap" occurs, the market frequently enters a powerful advance phase.
Pattern Definition
Stage 1 – The Correction
Price forms a series of lower highs.
RSI forms a matching series of lower highs.
Trendlines can be drawn on both price and RSI.
At this stage price and momentum are moving in harmony.
Stage 2 – The RSI Breakout
The first structural change appears in RSI.
Before price can break resistance, RSI breaks above its own descending trendline.
This suggests momentum is improving beneath the surface even though price has not yet confirmed.
Stage 3 – The Pullback
Price remains weak and may even fall further.
Many traders assume the bearish trend remains intact.
However, RSI holds above its broken trendline and begins forming support.
This is the critical phase of the setup.
Stage 4 – The Retest
RSI returns to the breakout area and successfully tests it as support.
What was previously resistance now becomes support.
This transition is what I consider the defining characteristic of the pattern.
Without a successful retest, I do not consider the setup complete.
Stage 5 – The Expansion
After RSI support is confirmed:
Price often forms its final corrective low.
Selling pressure diminishes.
A strong upward move begins.
Price eventually breaks its primary resistance trendline.
Many of the examples studied subsequently produced rapid advances.
Elliott Wave Connection
My working hypothesis is that Flute RSI frequently appears near the completion of a corrective Wave 2.
By the time price is still finishing its correction, RSI has already communicated a change in momentum structure.
When viewed through an Elliott Wave lens:
Wave 2 is completing.
Momentum begins improving.
Wave 3 emerges shortly afterward.
This remains a hypothesis and is one of the areas of ongoing research.
Market Psychology
The psychology behind the pattern may be straightforward.
During the correction:
Most traders focus on price.
Momentum starts improving first.
Early accumulation occurs.
RSI reflects the change before price does.
As price remains weak, many traders continue expecting downside.
Once the correction is complete, the market advances rapidly, leaving late sellers trapped.
Examples Studied
Some of the charts currently documented include:
Deepak Nitrate
TCI Express
Medicamen Biotech
Max Healthcare
Nifty Realty Index
docs.google.com
In each case, RSI demonstrated an earlier structural improvement than price.
Further testing across broader datasets is underway.
Limitations
This research is still in development.
The following work remains in progress:
Statistical win-rate analysis
Failure-case documentation
Risk/reward evaluation
Objective screening criteria
Cross-market validation
Multi-timeframe testing
At this stage, Flute RSI should be considered a research observation rather than a validated trading system.
Questions for the Community
I would appreciate feedback from traders and analysts:
Have you observed a similar RSI behavior before major advances?
Have you found examples where the pattern failed?
Does the setup appear on markets outside equities?
Have you observed a similar relationship with other momentum indicators?
Constructive criticism and counterexamples are especially welcome.
Conclusion
The Flute RSI concept is built on one simple idea:
Momentum may reveal a change in market structure before price confirms it.
Whether this observation ultimately proves statistically robust remains to be determined. However, the pattern has appeared often enough in my research to warrant further investigation.
I look forward to refining the concept with feedback from the TradingView community.
Author's Note: This is ongoing independent research and not investment advice. Future work includes large-scale testing, win-rate calculation, and identification of failure scenarios. Aegis Logistics Weekly BreakoutSubject: Aegis Logistics Weekly Breakout 🚀 | Entering a New Bullish Zone
Chart View: Weekly (NSE: AEGISLOG)
Aegis Logistics has delivered a strong breakout above the key resistance zone around ₹1,040–₹1,050 after a long consolidation phase. The stock has shown aggressive bullish momentum with a strong price expansion, indicating fresh buying interest.
📈 Trade Setup (Swing / Positional)
Entry Zone: ₹1,050–₹1,080 (or on a retest near ₹1,040)
Target 1: ₹1,200
Target 2: ₹1,350
Target 3: ₹1,500 (major breakout projection)
Stop Loss: ₹980 (Weekly closing basis)
My View:
In my analysis, AEGISLOG has entered a fresh bullish phase after a clean breakout from a long consolidation range. The recent rally has been sharp, so short-term consolidation is possible. I remain positive as long as the stock holds above the ₹1,040 breakout level.  Long
Long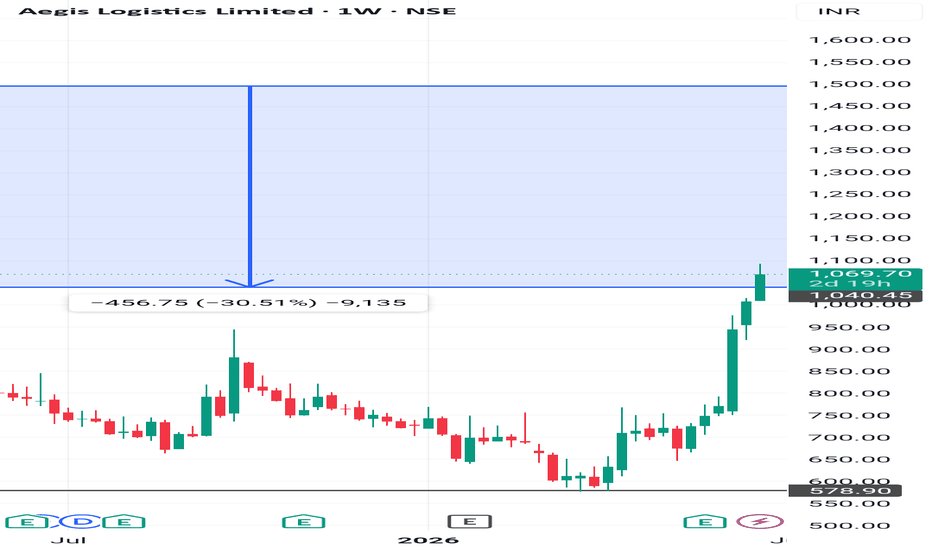
 Long
Long
 Long
Long
 Long
Long
 Long
Long
Gujarat Fluorochemicals Ltd. (NSE: FLUOROCHEM)🏆 Stock Setup of the Day | Gujarat Fluorochemicals Ltd. (NSE: FLUOROCHEM)
📈 Timeframe: Weekly Chart
🚀 Fresh Breakout Into a Major Resistance Zone
Gujarat Fluorochemicals has staged an impressive recovery from the February 2026 lows and has now broken above a key resistance level around ₹4,000, indicating renewed bullish momentum.
🔹 Current Price: ₹4,082
🔹 Breakout Level: ₹4,000
🔹 Major Target Zone: ₹5,250
🔹 Potential Upside: ~22%
📊 Technical View
✅ Strong weekly breakout with bullish price structure
✅ Higher Highs & Higher Lows confirm an uptrend
✅ Price has reclaimed an important resistance after a prolonged consolidation
✅ Momentum remains positive while price sustains above the breakout zone
👀 Key Levels to Watch
🟢 Support: ₹4,000–₹3,950
🎯 Target Zone: ₹5,200–₹5,250
📌 A sustained move above ₹4,000 could keep the medium-term trend firmly bullish. Watching for follow-through buying in the coming weeks.
⚠️ Disclaimer: This is purely a technical chart analysis for educational purposes and should not be considered as investment or trading advice. Please do your own research and follow proper risk management.
🔥 Follow the channel for daily high-probability breakout setups and technical analysis.  Long
Long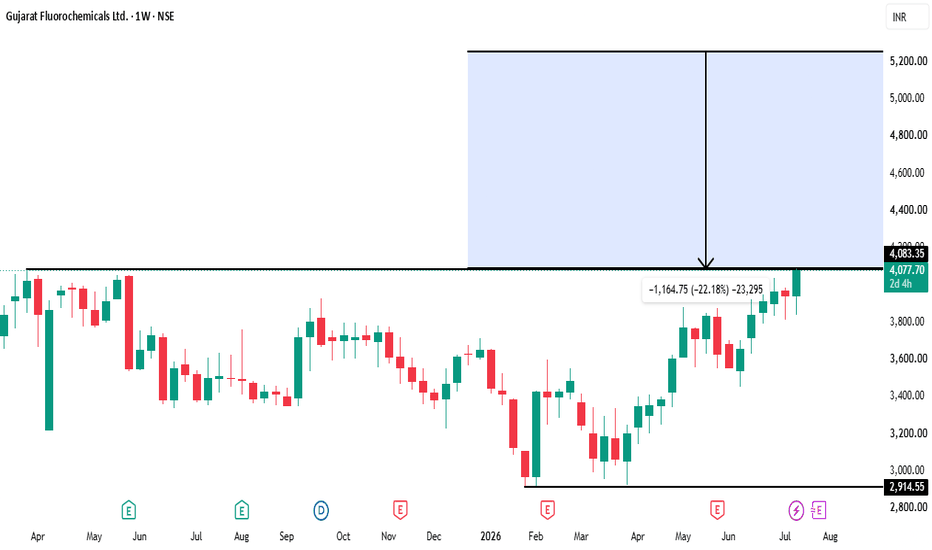
 Long
Long
 Long
Long