Buy Today, Sell Tomorrow for 3-5% - Daily Breakout SetupHEXT โ BTST BREAKOUT SETUP
Entry, Stop Loss & Targets Are Clearly Defined โ Helping You Plan Your Trade With Confidence.
๐ Stock Strength: 62/100
(Note: Higher score indicates stronger stock conditions, not guaranteed returns.)
A bullish breakout has appeared on the 1D timeframe with positive price action and strong volume expansion.
๐ Trade Type: BTST
โโโโโโโโโโโโโโโโโโโโ
๐ฏ TRADE LEVELS
ENTRY: โน605
๐ STOP LOSS
ATR SL: โน574
๐ฏ TARGETS
3โ5%
โโโโโโโโโโโโโโโโโโโโ
๐ VOLUME
20D Volume: 136%
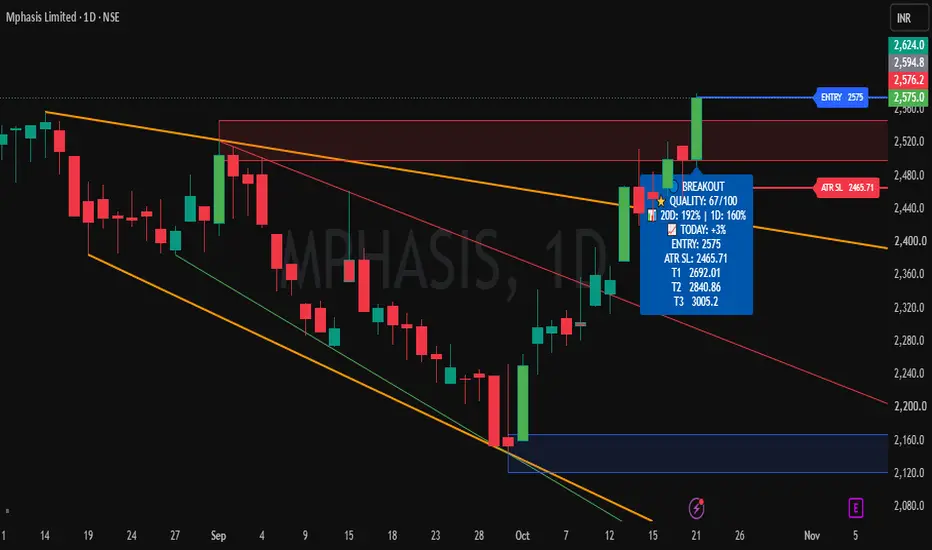
Buy Today, Sell Tomorrow for 3-5% - Daily Breakout SetupMPHASIS โ BTST BREAKOUT SETUP
Entry, Stop Loss & Targets Are Clearly Defined โ Helping You Plan Your Trade With Confidence.
๐ Stock Strength: 67/100
(Note: Higher score indicates stronger stock conditions, not guaranteed returns.)
A bullish breakout has appeared on the 1D timeframe with positive price action and strong volume expansion.
๐ Trade Type: BTST
โโโโโโโโโโโโโโโโโโโโ
๐ฏ TRADE LEVELS
ENTRY: โน2575
๐ STOP LOSS
ATR SL: โน2466
๐ฏ TARGETS
3โ5%
โโโโโโโโโโโโโโโโโโโโ
๐ VOLUME
20D Volume:
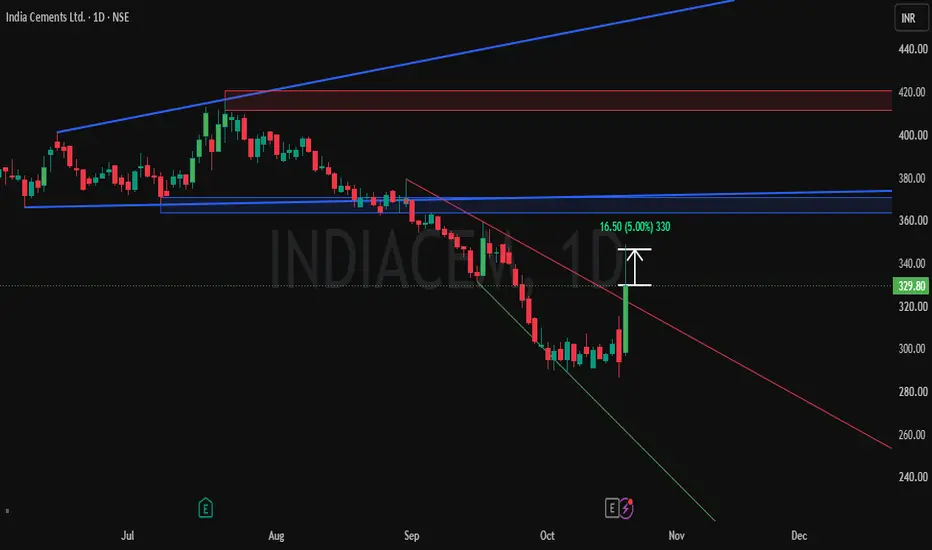
Buy Today, Sell Tomorrow for 3-5% - Daily Breakout SetupINDIACEM โ BTST BREAKOUT SETUP
Entry, Stop Loss & Targets Are Clearly Defined โ Helping You Plan Your Trade With Confidence.
A bullish breakout has appeared on the 1D timeframe with positive price action.
๐ Trade Type: BTST
โโโโโโโโโโโโโโโโโโโโ
๐ฏ TRADE LEVELS
ENTRY: โน330
๐ STOP LOSS
Swing Low: โน294
๐ฏ TARGETS
3โ5%
โโโโโโโโโโโโโโโโโโโโ
โฑ Timeframe: 1 Day
๐ Trade Entry: Take the trade only after 3:15 PM.
The position can be held for the next trading session if the trend remains strong.
Buy Today, Sell Tomorrow for 3-5% - Daily Breakout SetupFRACTAL โ BTST BREAKOUT SETUP
Entry, Stop Loss & Targets Are Clearly Defined โ Helping You Plan Your Trade With Confidence.
๐ Stock Strength: 69/100
(Note: Higher score indicates stronger stock conditions, not guaranteed returns.)
A bullish breakout has appeared on the 1D timeframe with positive price action and strong volume expansion.
๐ Trade Type: BTST
โโโโโโโโโโโโโโโโโโโโ
๐ฏ TRADE LEVELS
ENTRY: โน786
๐ STOP LOSS
ATR SL: โน742
๐ฏ TARGETS
3โ5%
โโโโโโโโโโโโโโโโโโโโ
๐ VOLUME
20D Volume: 1
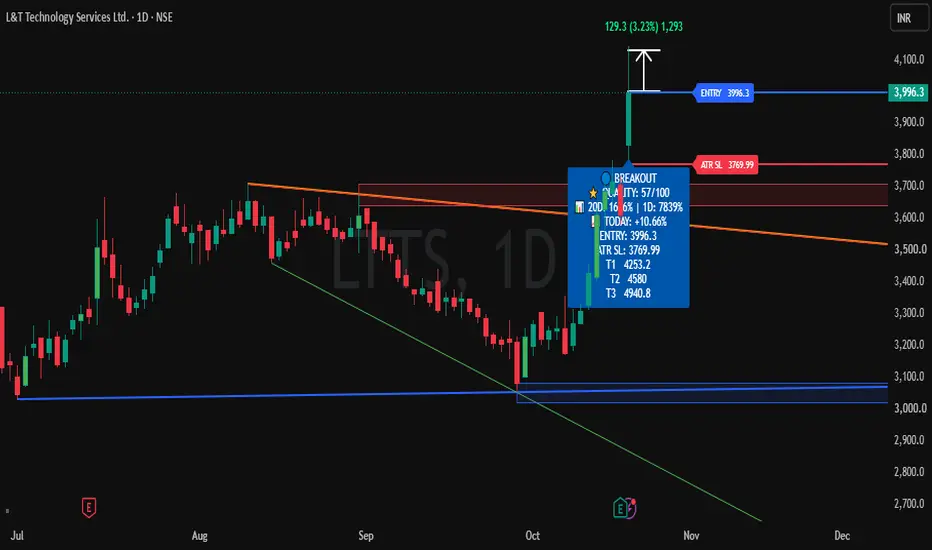
Buy Today, Sell Tomorrow for 3-5% - Daily Breakout SetupLTTS โ BTST BREAKOUT SETUP
Entry, Stop Loss & Targets Are Clearly Defined โ Helping You Plan Your Trade With Confidence.
๐ Stock Strength: 57/100
(Note: Higher score indicates stronger stock conditions, not guaranteed returns.)
A bullish breakout has appeared on the 1D timeframe with positive price action and strong volume expansion.
๐ Trade Type: BTST
โโโโโโโโโโโโโโโโโโโโ
๐ฏ TRADE LEVELS
ENTRY: โน3,995
๐ STOP LOSS
ATR SL: โน3,770
๐ฏ TARGETS
3โ5%
โโโโโโโโโโโโโโโโโโโโ
๐ VOLUME
20D Volume:
Institution Option Trading Part-3PCR means Put Call Ratio
It tells us how many Put options and Call options people are buying or trading.
Why it matters for institution trading
Big players mostly use options. So PCR helps us understand what big money may be thinking.
If PCR is high
More puts than calls.
Means traders are scared or taking protection.
Sometimes big players expect weakness.
If PCR is low
More calls than puts.
Means confidence in upside.
Sometimes market is bullish.
RailTel: Weekly Technical Setup & Key LevelsRailTel โ Technical Observation
The next weekly candle will be important to assess the strength of the current setup. Volume is currently weak, so stronger volume confirmation would add conviction to the move.
Key levels:
โน245 โ Key support zone
โน300 โ Resistance zone
โน350 โ Next potential resistance zone
Iโm watching price action and volume confirmation before drawing further conclusions.
Educational/technical analysis only. Not a recommendation to buy, sell or hold any security.
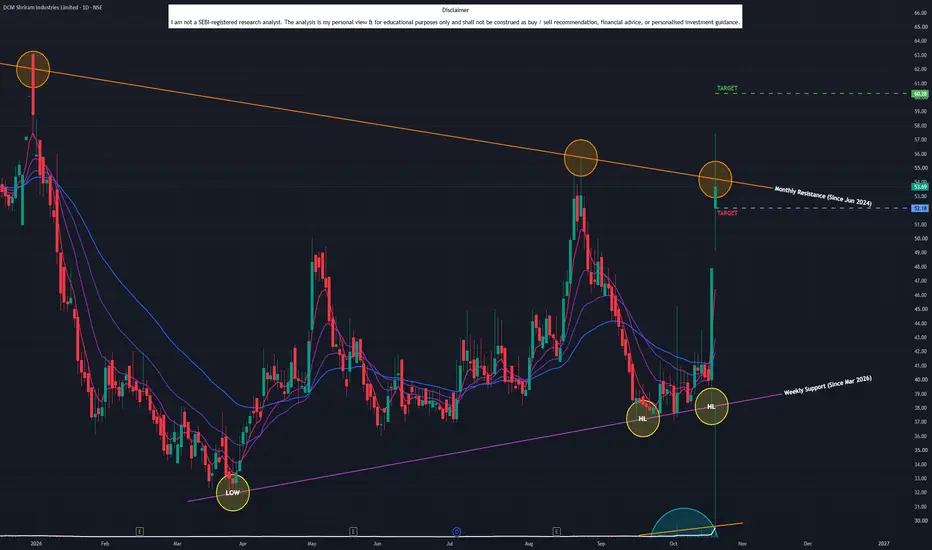
DCM Shriram Industries (D): REVERSAL & RESISTANCE TESTTimeframe: Daily | Chart Scale: Linear
Explosive gap-up and +12.09% surge today backed by a massive 57.43M volume spike! ๐ฅ
Technical Highlights:
โ
Reversal: Forming Higher Lows after a downtrendโtrend is shifting!
โ ๏ธ Resistance Test: Pushed into a long-term angular resistance (Jun '26) but couldn't secure the close.
โ
Volume: Rising volume confirms heavy buyer accumulation.
โ
Momentum: Short-term EMAs in positive crossover (Daily/Weekly). MACD & RSI rising. ๐
Key Levels to
India Cements (D): MASSIVE SUPPORT BOUNCE & BREAKOUTTimeframe: Daily | Chart Scale: Linear
Explosive +12.04% surge today backed by a massive 28.53M volume spike! ๐ฅ
Technical Highlights:
โ
Macro Floor: Bounced directly off a massive long-term angular support (active since Feb 2020!).
โ
Breakout: Cleared & closed above short-term consolidation.
โ ๏ธ Caution: Given the extreme 12% move, watch out for near-term profit booking.
โ
Momentum: MACD & RSI rising (Daily/Weekly), though EMAs are still catching up. ๐
Key Levels to Watch:
Bajaj Finance Faces Selling Pressure Despite Strong Q2 ResultsHighlights
Bajaj Finance is trading around โน930โโน940 after falling nearly 3% following its Q2 FY27 results, announced on Monday, October 19, rather than Saturday. The stock touched approximately โน929 today, indicating renewed selling pressure.
Immediate support is around โน925โโน930, followed by โน900โโน910. A decisive breakdown below โน900 could extend the correction towards โน875โโน885.
On the upside, โน950โโน960 is the immediate resistance zone. A sustained breakout above โน960 could trigger a r
JIO - Indiaโs biggest IPO is live. Make-or-Break level๐ RELIANCE INDUSTRIES (NSE: RELIANCE) โ Double Bottom at the Neckline as Jio IPO Opens ๐
India's biggest IPO (Jio Platforms) is live, and Reliance is testing the neckline of a double bottom after a ~24% fall from its 52-week high of โน1,611.80.
โโโโโโโโโโโโโโโโโโโโ
๐ฐ MAJOR NEWS
โโโโโโโโโโโโโโโโโโโโ
๐ฅ Jio Platforms IPO: 21โ23 Oct | โน30,213 cr | 27 crore fresh shares (no OFS)
| Price band โน1,065โ1,119 |~$108B valuation |
๐ RIL rose ~3% on 15 Oct when the price band was announced, and hit โน1,234
Trading Road Mapoptions trading and institutional trading are important parts of modern financial markets. Options trading offers flexibility and opportunities for profit, while institutional trading provides liquidity and stability to the market. However, beginners should learn market concepts carefully before entering options trading because losses can occur quickly without proper knowledge and risk management. Education, practice, and disciplined investing are essential for long-term success in trading.
Auropharma - Multi timeframe analysisIn the lower timeframe, the price is giving a breakout from a descending triangle. In the daily timeframe, the price is moving within a range and is forming a rounding-top pattern. It is a bearish pattern, but the range movement has made it choppy. If the price falls, it won't be a trending move.
Sell below 1622 with a stop loss of 1640, for the targets 1604, 1592, 1576, 1558, 1542 and 1528.
The rounding top pattern completes in the zone 1500 - 1520.
If the price breaks it with bearish strength
Bullish Setup In Godrej Properties๐๐ข๐๐ฅ๐๐ ๐ฃ๐ฅ๐ข๐ฃ๐๐ฅ๐ง๐๐๐ฆ | ๐๐จ๐ง๐จ๐ฅ๐ ๐ฆ๐๐๐ ๐๐ก๐ง | ๐ฅ๐๐๐๐ง๐ฌ ๐ฆ๐๐๐ง๐ข๐ฅ
๐ ๐๐ป๐ผ๐๐ต๐ฒ๐ฟ ๐ฝ๐ผ๐๐ฒ๐ป๐๐ถ๐ฎ๐น ๐น๐ผ๐ป๐ด-๐๐ฒ๐ฟ๐บ ๐๐ฒ๐๐๐ฝ ๐ถ๐ป ๐๐ผ๐ฑ๐ฟ๐ฒ๐ท ๐ฃ๐ฟ๐ผ๐ฝ๐ฒ๐ฟ๐๐ถ๐ฒ๐!
Godrej Properties appears to be approaching an interesting zone for long-term investors, based on its technical chart structure.
๐ ๐ช๐ต๐ฎ๐ ๐บ๐ฎ๐ธ๐ฒ๐ ๐๐ต๐ถ๐ ๐๐ฒ๐๐๐ฝ ๐ถ๐ป๐๐ฒ๐ฟ๐ฒ๐๐๐ถ๐ป๐ด?
๐น ๐ฆ๐๐ฝ๐ฝ๐ผ๐ฟ๐ ๐ญ๐ผ๐ป๐ฒ: Price is approaching a key support area after a fresh correction of approximately 30%.
๐น ๐ฅ๐ฆ๐ ๐ฆ๐๐ฝ๐ฝ๐ผ๐ฟ๐: The RSI is holding support at a key technical level.
๐น ๐๐ถ๐ด๐ต ๐ฉ๐ผ๐น๐๐บ๐ฒ ๐๐ฐ๐๐ถ๐๐ถ๐๐: Elevated volume is another fac
โBreakout Confirmed โ Waiting for 60โ75% RetracementโWeekly & Daily Chart Review
Instrument: MPHASIS CMP 2567
Timeframes: Weekly & Daily
๐น Breakout Context
The instrument has recently broken out of a key resistance zone 2550 , confirming bullish momentum. However, price action is extended, and a healthy retracement is likely before continuation.
๐น Retracement Zone (60โ75%)
Based on Fibonacci levels and prior consolidation ranges, I expect a pullback into the 60โ75% retracement zone from current values. This area aligns with strong demand on
HSCL Q2 FY27 Results: Revenue Soars, Margins Under Pressure! ### ๐ Key Highlights
- **Revenue:** โน1,691 crore | **+57.9% YoY | +18.1% QoQ**
- **Net Profit:** โน231 crore | **+31.3% YoY | +1.3% QoQ**
- **EPS:** โน4.60, up 28.5% YoY.
- **EBITDA:** Approximately โน303 crore, down 3.2% QoQ.
- **EBITDA Margin:** Fell to 17.9% from 22.2% a year ago.
- **Net Profit Margin:** Declined to 13.68% from 16.45% YoY.
### โ
Positives
- Strong revenue growth and healthy annual profit expansion.
- Increasing scale of operations.
- Long-term opportunities in speciality chemi
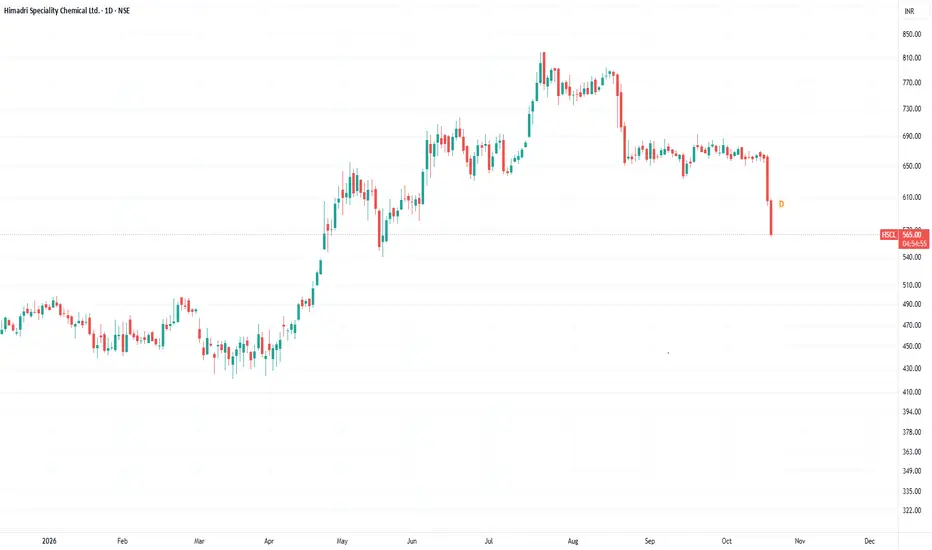
HSCL Crashes 13.5% in Two Sessions: Support & Breakdown RisksKey Insights from the Chart
Breakdown of support :
HSCL has fallen below the โน650โโน660 range that contained much of the September and early-October price action.
Strong bearish momentum
The latest candle opened near โน606, reached only โน609 on the upside, and closed near its low at โน571.60.
Heavy preceding selling :
On 19 October, HSCL fell 8.30% on volume of approximately 5.76 million shares, compared with around 1.53 million on 16 October. That is evidence of substantially in
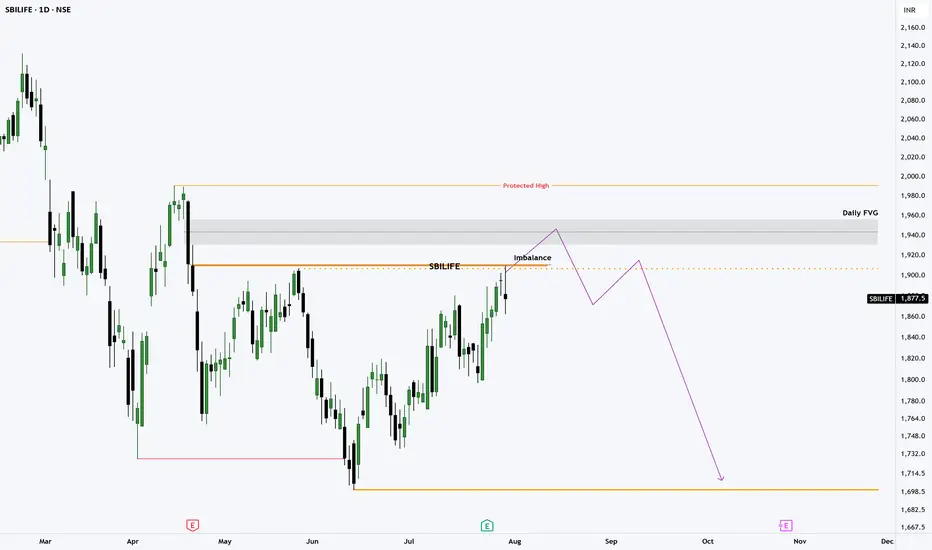
SBILIFE : Higher Timeframe Bearish Structure & Key Supply ZonesMarket Bias: Bearish
Timeframe: Daily (1D)
Market Overview & Technical Structure
SBILIFE continues to operate within a defined higher-timeframe downtrend, characterized by a series of lower lows and lower highs. The recent upward momentum reflects a corrective pullback back into the Premium Zone of the last major swing leg.
Key Technical Factors
Local Imbalance Rejection: Price has recently encountered initial resistance and shown a reaction off the local imbalance around the ~1900.0 level.
Mid-Week Chart Study: Market Structure on Monthly Time Frame Apoorv Dubey, SEBI Registered Research Analyst
Disclaimer:
This video is for educational and informational purposes only and is not a recommendation to buy, sell or hold any security. Investments in securities markets are subject to market risks. Read all related documents carefully before investing. Registration granted by SEBI and certification from NISM in no way guarantee the performance of the intermediary or provide any assurance of returns to investors.
Topics
Discussed market structure
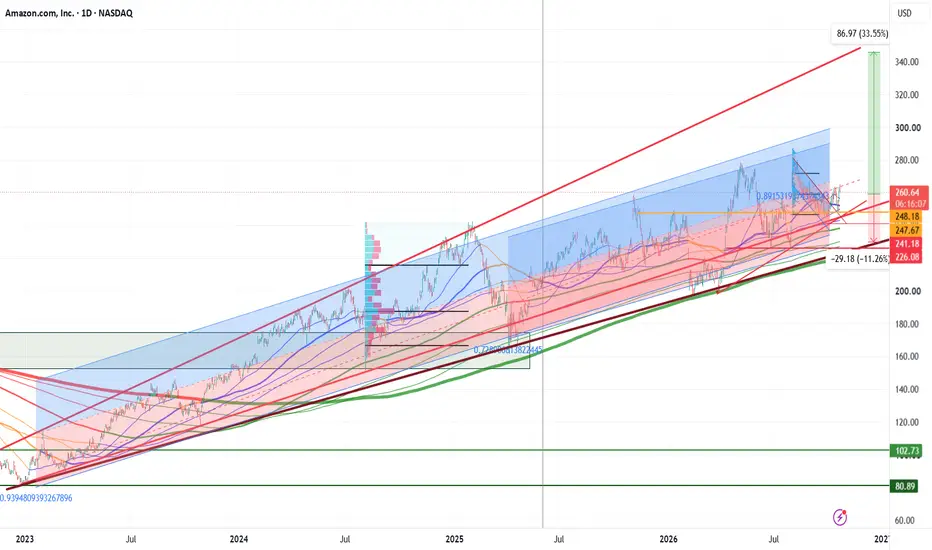
AMAZON Ready for takeoff or downfall?AMAZON is currently available at a reasonable valuation and is testing one of its important resistance and support levels.
On the 1D chart, it has clearly broken out of its downward-sloping parallel channel and tested support again on 15th Oct. This suggests AMAZON is ready to break out on the daily frame.
On the higher frame/ long term, it still has room for a drop to approx. 226 USD (-11%), which would be a bulk buy phase if it comes. With a reward of upside to 300-304 USD (+16.5%), where w
MU ยท Micron Technology, Inc. at Best Buy Zone.NASDAQ:MU is a good fundamental company with a trending catalist. Strong Buy: Quality, value and trend line up.
The Fundamentals:
Micron makes memory and storage: DRAM (incl. HBM for AI), NAND flash and SSDs. Business units: Cloud Memory, Core Data Center, Mobile & Client, Automotive & Embedded. Global sales; fabs in US, Japan, Taiwan, Singapore. Earns from memory chip sales โ highly cyclical.
One of only three DRAM makers; HBM technology position.
FY EPS estimate $175.18 vs last FY $74.34
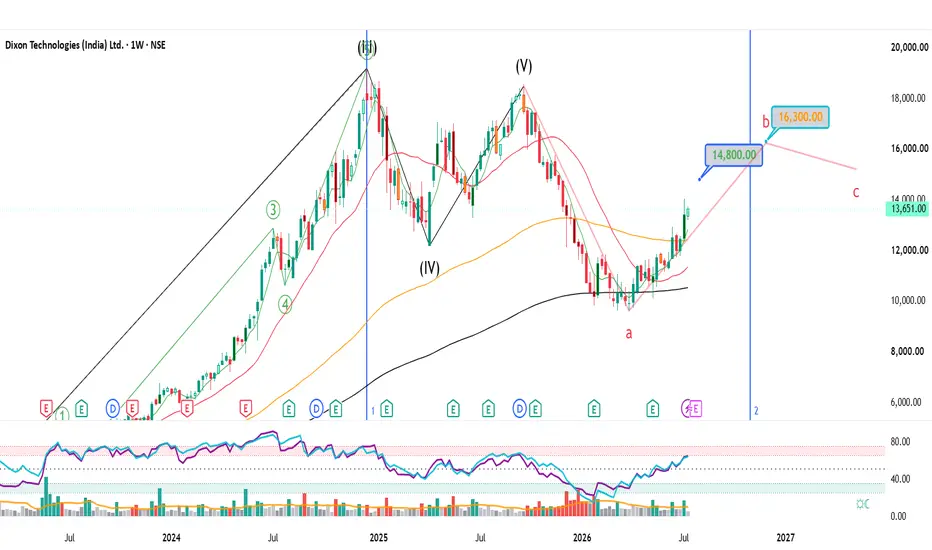
Dixon Technologies โ Short-Term Trading PlanDixon Technologies โ CMP: โน13,651 | Timeframe: Weekly (Execution: Daily)
๐ Trading Strategy
โ
Existing Long Positions
Continue to hold while price remains above โน13,000 .
Trail stop-loss higher as the stock advances.
โ
Fresh Entry
Prefer buying:
On a pullback towards โน13,200โ13,300, or
On a decisive breakout above โน14,000 with strong volumes.
๐ฏ Targets
Target 1: โน14,800
Target 2: โน16,300
Target 3: โน18,500 (only if momentum remains strong)
๐ Stop Loss
Closing below โน12,800 would