M&MFIN 21 DEMA BREAKOUT STRUCTUREANALYSIS
MAHINDRA & MAHINDRA FINANCIAL SERVICES LTD. (M&MFIN) is showing a potential bullish swing-reversal and post-earnings recovery setup following a strong reversal candle from its recent support base near ₹260.
The stock is testing a key moving-average resistance cluster around ₹289.00–₹289.56, corresponding to the 21-DEMA and 21-Week EMA reference levels.
A decisive daily candle close above ₹289.56 would indicate a potential short-term trend reversal following the prolonged multi-week dec
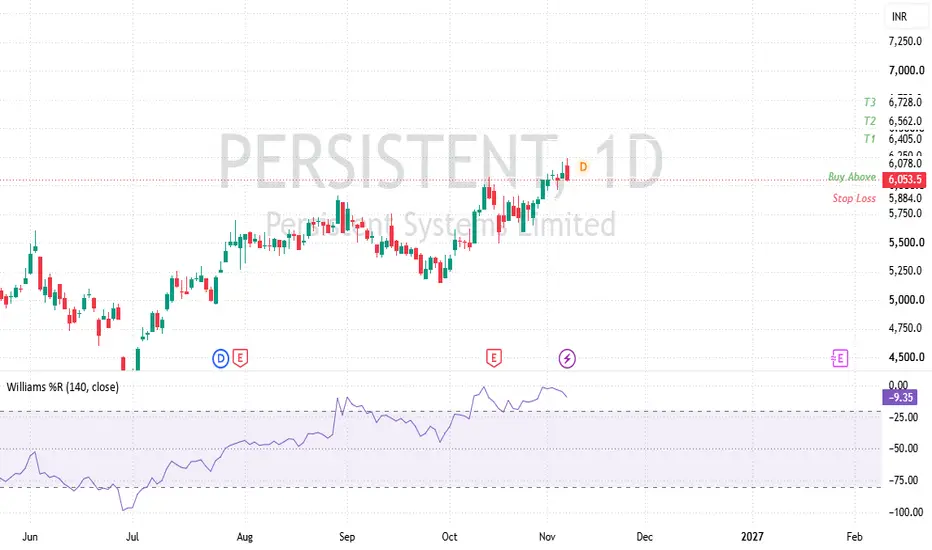
PERSISTENT | Bullish Breakout Swing Trading SetupANALYSIS
PERSISTENT SYSTEMS LTD. (PERSISTENT) is showing a potential bullish swing breakout setup as price approaches a key horizontal resistance zone near ₹6,098.00.
A sustained move above ₹6,098.00 could indicate a bullish continuation and potentially attract fresh buying interest.
The proposed entry is conditional on a decisive breakout, preferably supported by a strong daily candle close and volume expansion.
The improving Indian IT sector sentiment, institutional participation and recent c
PIDILITE INDUSTRIES LTD Trend line breakout + Two Entry methodANALYSIS
PIDILITE INDUSTRIES LTD. (PIDILITIND) is showing a potential bullish swing-recovery and accumulation setup following a consolidation phase after testing a recent low near ₹1,402.90.
The stock has reportedly reclaimed its 21-DEMA near ₹1,485.00 and is currently holding around ₹1,503.20, indicating improving short-term price structure.
A Fair Value Gap (FVG) demand zone is identified between ₹1,462.00 and ₹1,500.00, which may act as a potential accumulation area during price retracements
KAJARIA CERAMICS LTD Swing Satup 200 Week EMA BreakoutANALYSIS
KAJARIA CERAMICS LTD. (KAJARIACER) is showing a potential bullish swing-reversal and long-term trend-continuation setup following a successful recovery above its 200-day Exponential Moving Average (EMA).
The stock has reportedly reclaimed and consolidated above the 200 EMA near ₹1,113.10, potentially converting a major long-term resistance level into a demand zone.
The Supertrend indicator (7, 2) has reportedly flipped bullish at ₹1,101.70, indicating renewed positive momentum.
Price a
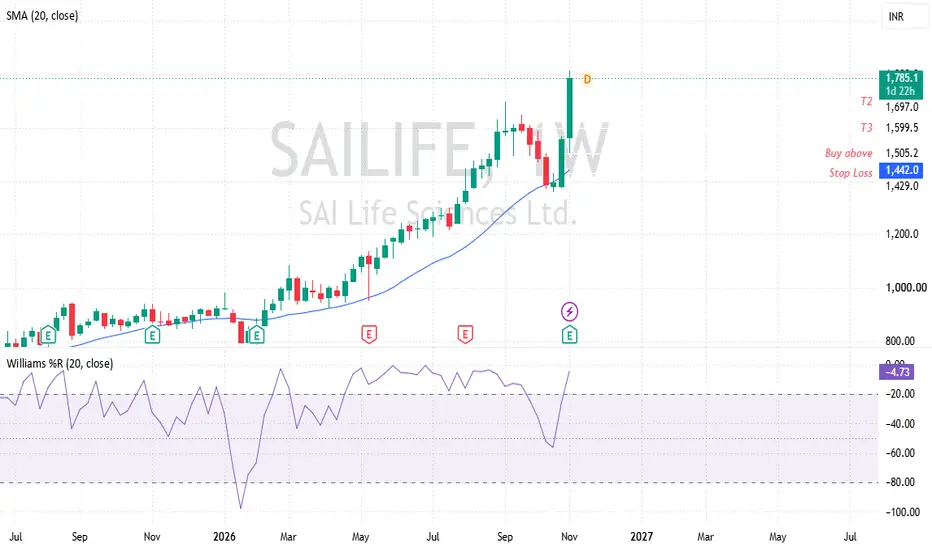
SAILIFE — SWING TRADING IDEA | WEEKLY MOMENTUM BREAKOUTANALYSIS
SAI LIFE SCIENCES LTD. (SAILIFE) is showing a potential bullish swing continuation setup following a reported bounce from the 20-week Simple Moving Average (SMA).
The key moving-average support reference is near ₹1,410.30, which may act as a medium-term support zone.
The reported current price is ₹1,491.70, approaching the proposed breakout trigger at ₹1,505.20.
Williams %R (20) is reportedly recovering from oversold territory, with a current reading of −39.81, indicating improving bul
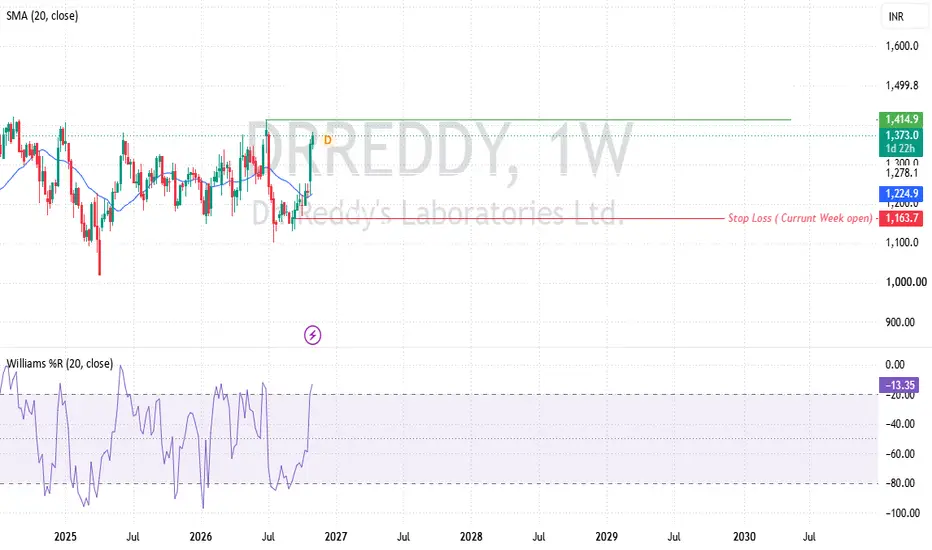
DRREDDY — SWING TRADING IDEA | WEEKLY BREAKOUT SETUPANALYSIS
DR. REDDY'S LABORATORIES LTD. (DRREDDY) is showing a potential bullish swing continuation setup following a reported bounce from the 20-week Simple Moving Average (SMA).
The key moving-average support reference is near ₹1,219.30, which may act as a medium-term support zone.
A decisive breakout above ₹1,278.10, supported by strong volume and sustained price action, would strengthen the bullish continuation thesis.
Williams %R is reportedly recovering from oversold territory, indicating
MANKIND PHARMA — MOMENTUM BREAKOUT SWING SETUPANALYSIS
MANKIND PHARMA (NSE: MANKIND) is developing a potential bullish momentum breakout setup, with a proposed entry trigger above ₹2,513.50.
The stock has established a potential medium-term support base near ₹2,474.90, aligned with the reported 20-week SMA breakout structure.
Price is consolidating within the broader ₹2,474–₹2,550 range, making a decisive breakout and sustained follow-through important for confirming bullish continuation.
A move above ₹2,513.50, supported by buying volume,
PHOENIXLTD — WEEKLY BREAKOUT SETUP | FUNDAMENTAL CATALYSTSANALYSIS
PHOENIX MILLS LTD. (PHOENIXLTD) is approaching a key weekly breakout zone of ₹1,930–₹1,935, which requires confirmation through a decisive weekly candle close.
The reported increase in ownership of Island Star Mall Developers Pvt. Ltd. (ISMDPL) to 68.10% following NCLT approval on October 28, 2026, represents an important step in the company's planned ownership consolidation.
The phased buyout plan, reportedly involving approximately ₹5,450 crore across four tranches over three years,
ITC ITC Ltd. – Long-Term Trade Rationale (Weekly Chart)
ITC is showing early signs of a potential bullish reversal after a prolonged corrective phase. The stock is displaying positive RSI divergence, with price making lower lows while RSI forms higher lows, indicating weakening selling pressure. The latest strong bullish weekly candle, supported by volume expansion, suggests renewed buying interest. Price has reclaimed the 10 and 20 EMAs, indicating improving momentum. RSI has recovered to 50, movi
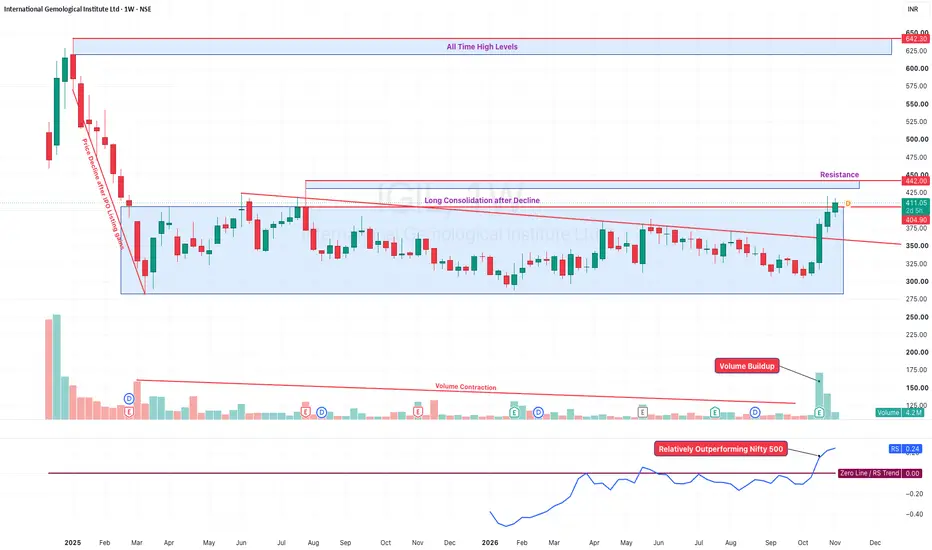
IGIL - Long Consolidation BreakoutIGIL is showing encouraging signs of a potential momentum reversal on the weekly chart after a prolonged consolidation phase.
Following a significant decline from its earlier highs(IPO Listing HIghs), the stock spent several months consolidating within a broad range of approximately ₹285–₹410. Recently, price has broken above the descending trendline and is now attempting to move beyond the upper boundary of this consolidation range.
Key Technical Observations
Long Consolidation: The stoc
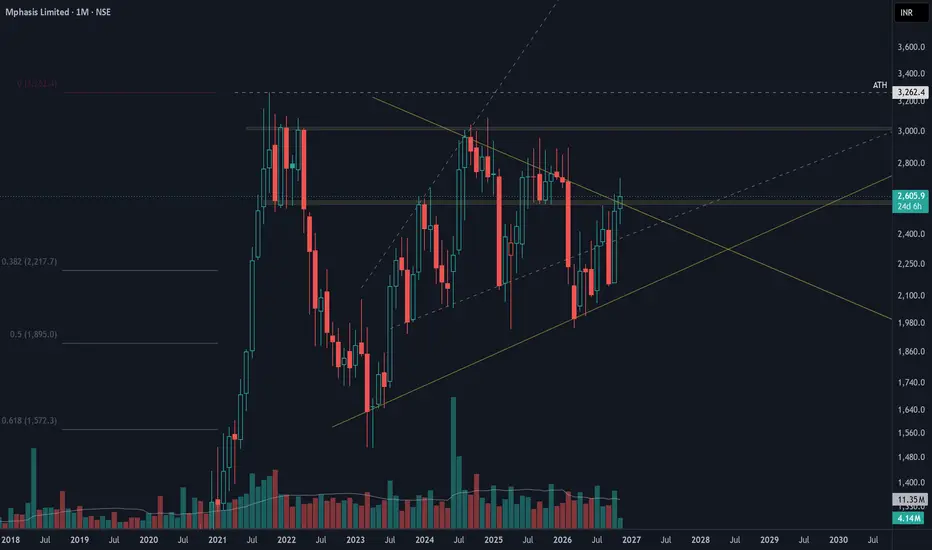
Decoding the Code: Can MphasiS Debug Resistance? Pattern Structure: The chart maps out a complex structural evolution, displaying higher highs and higher lows within a broadening channel. This volatility compression resolves into a decisive breakout across the descending trendline, signaling a shift in trend momentum.
Volume Analysis: A marked surge in accumulation volume validates this breakout, providing the necessary algorithmic conviction to confirm genuine institutional participation.
Fibonacci Confluence: Following the primary advanc
BUY TODAY SELL TOMORROW for 5%DON’T HAVE TIME TO MANAGE YOUR TRADES?
- Take BTST trades at 3:25 pm every day
- Try to exit by taking 4-7% profit of each trade
- SL can also be maintained as closing below the low of the breakout candle
Now, why do I prefer BTST over swing trades? The primary reason is that I have observed that 90% of the stocks give most of the movement in just 1-2 days and the rest of the time they either consolidate or fall
Trendline breakout in MUFTI
BUY TODAY SELL TOMORROW for 5%
GYFTR (Gyftr Ltd.)Technical Analysis & Trade Setup
- Symbol: GYFTR (Gyftr Ltd.) — Daily Timeframe (NSE)
- Current Price: ₹206.04 (-0.64% intraday move)
- Market Structure: Following an extended sideways base-building and accumulation phase above the ₹139.69 structural support, the stock has initiated a sharp impulsive breakout. Price action reflects strong trend reversal characteristics, breaking out of its multi-week range to challenge higher supply zones.
Key Technical Trade Levels
- Entry Zone: ~₹205.
Adai enterprises Current Setup: Following a strong multi-month rally, the price is facing visible exhaustion near a crucial long-term falling trendline resistance (originating from Dec-22 highs).
• Correction Risk: If the price fails to cross and close strongly above this trendline on a monthly basis, the probability of a correction toward the breakout retest zone of 2600 and below is high.
• Actionable Strategy:
Avoid fresh long positions at current resistance.
Good level to book profits on existing longs.
B
Resistance to support Adani Energy solutionThis is monthly chart, 1250 level had acted as resistance for about 3yrs and now it has given good bullish support.
This makes this counter as bullish and a buy on dips.
A good rally till all time high can be expected. This being monthly chart targets will come after 6 to 12 months time.
Faze Three LtdTechnical Analysis & Trade Setup
- Symbol: FAZE3Q (Faze Three Ltd.) — Daily Timeframe (NSE)
- Current Price: ₹603.35 (+5.74% intraday move)
- Market Structure: Following a prolonged corrective phase and multi-month base consolidation below a macro descending trendline, the stock has broken out aggressively with strong volume expansion. Price action indicates a major trend reversal, clearing the overhead resistance line and challenging immediate supply zones.
Key Technical Trade Levels
-
Demand Zone to Channel Re-test: Bajaj Auto's Crucial InflectionCurrent State & Macro Structure:
Last Traded Level: Oscillating around 10,485 after reaching a swing high test near 10,800.
Market Context: Following a parabolic surge to peak levels around 12,484 and an aggressive markdown back into the primary macro Demand Zone (9,600 – 9,900), the stock staged a sharp V-shaped recovery within an ascending channel/pitchfork structure.
The Rejection Event: The recent sharp up-thrust reached the prior breakdown imbalance box, effectively tagging the "G
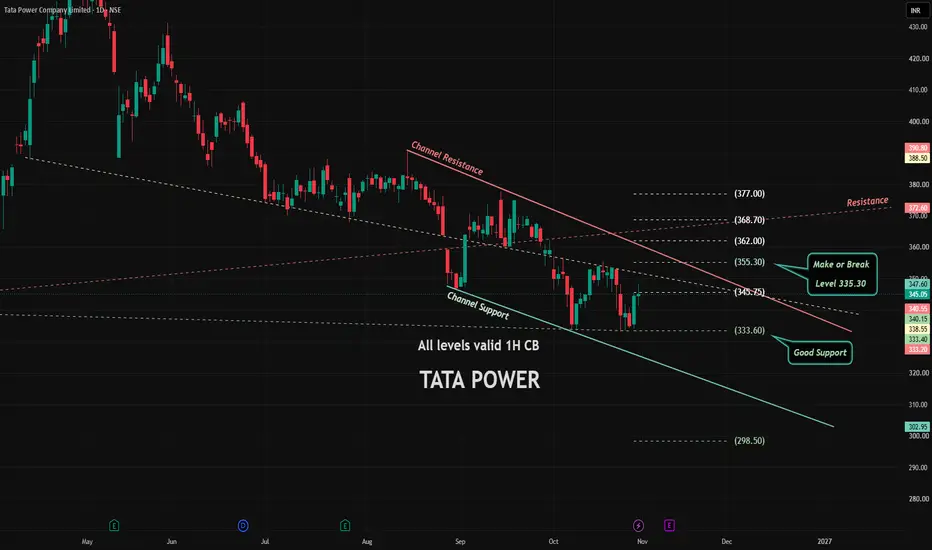
TATA POWER: Is a Trend Reversal Brewing or Is More Pain Ahead !Market Structure: A Bearish Trend Meets an Important Support Zone
Tata Power continues to trade within a broader descending channel, characterised by a sequence of lower highs and lower lows. The stock's inability to sustain previous recovery attempts reflects persistent selling pressure and a lack of convincing bullish follow-through.
However, the recent price action around ₹333–335 deserves attention.
This region represents an important support cluster, where the stock has shown signs of buyin
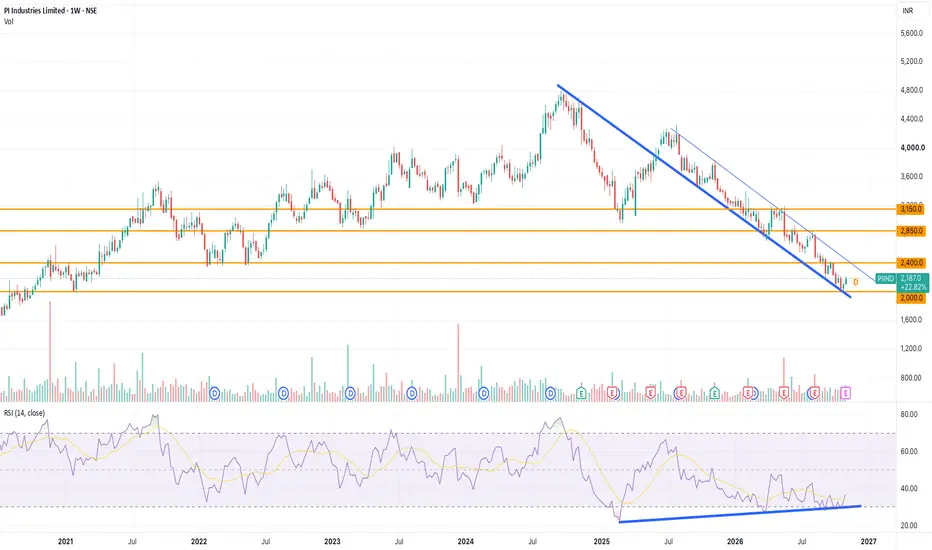
PI Industries (PIIND): Weekly RSI Divergence Awaits BreakoutA high-conviction macro setup is maturing on the weekly timeframe at a major multi-year inflection point.
📊 Technical Setup
• Macro Floor: Strong historical accumulation and psychological support at ₹2,000.
• Price Pattern: Clean corrective descending channel active since late 2024.
• RSI Divergence: Powerful weekly bullish divergence (price making lower lows, RSI making higher lows) signals seller exhaustion.
🎯 The Trigger
Wait for a clean weekly candle close above the descending channel an
Elliott Wave Analysis : Regular Flat or Double Zigzag? NASDAQ:META: Regular Flat or Double Zigzag? The Next Few Sessions Decide
META is at an important decision point, and the internal structure of the current decline will decide the next major move.
The big picture
Counting from the 2022 low, META completed a five-wave advance. The corrective phase that followed the Wave 5 top is still incomplete. Right now two corrective structures fit the price action, and they point in opposite directions.
Scenario 1: Regular Flat (A-B-C)
If the current leg
BUY TODAY SELL TOMORROW for 5%DON’T HAVE TIME TO MANAGE YOUR TRADES?
- Take BTST trades at 3:25 pm every day
- Try to exit by taking 4-7% profit of each trade
- SL can also be maintained as closing below the low of the breakout candle
Now, why do I prefer BTST over swing trades? The primary reason is that I have observed that 90% of the stocks give most of the movement in just 1-2 days and the rest of the time they either consolidate or fall
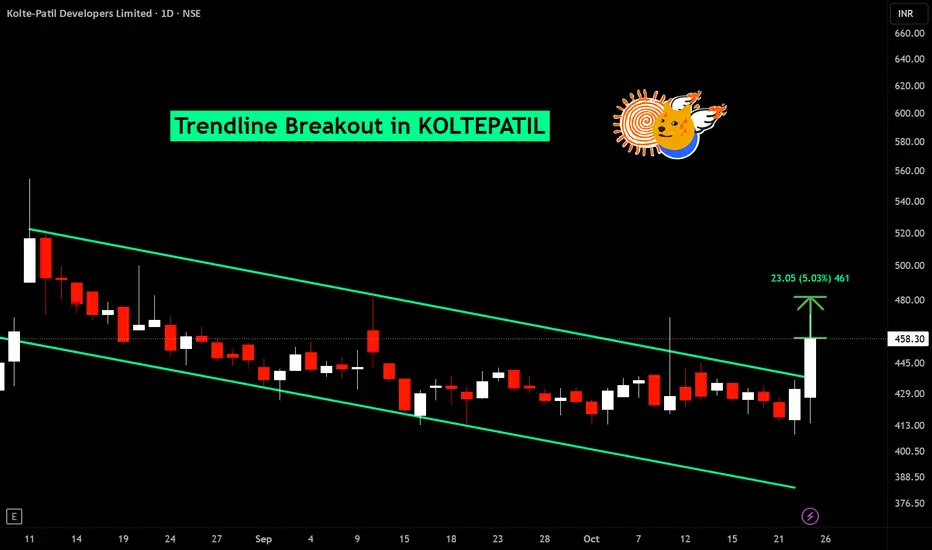
Trendline breakout in KOLTEPATIL
BUY TODAY SELL TOMORROW for 5%
BUY TODAY SELL TOMORROW for 5%DON’T HAVE TIME TO MANAGE YOUR TRADES?
- Take BTST trades at 3:25 pm every day
- Try to exit by taking 4-7% profit of each trade
- SL can also be maintained as closing below the low of the breakout candle
Now, why do I prefer BTST over swing trades? The primary reason is that I have observed that 90% of the stocks give most of the movement in just 1-2 days and the rest of the time they either consolidate or fall
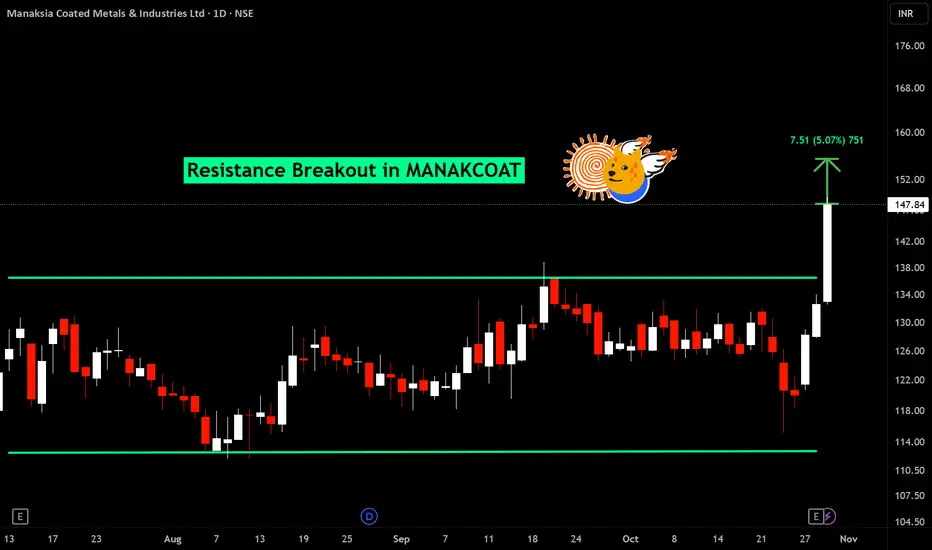
Resistance breakout in MANAKCOAT
BUY TODAY SELL TOMORROW for 5%
BUY TODAY SELL TOMORROW for 5%DON’T HAVE TIME TO MANAGE YOUR TRADES?
- Take BTST trades at 3:25 pm every day
- Try to exit by taking 4-7% profit of each trade
- SL can also be maintained as closing below the low of the breakout candle
Now, why do I prefer BTST over swing trades? The primary reason is that I have observed that 90% of the stocks give most of the movement in just 1-2 days and the rest of the time they either consolidate or fall
Resistance breakout in APLLTD
BUY TODAY SELL TOMORROW for 5%
BUY TODAY SELL TOMORROW for 5%DON’T HAVE TIME TO MANAGE YOUR TRADES?
- Take BTST trades at 3:25 pm every day
- Try to exit by taking 4-7% profit of each trade
- SL can also be maintained as closing below the low of the breakout candle
Now, why do I prefer BTST over swing trades? The primary reason is that I have observed that 90% of the stocks give most of the movement in just 1-2 days and the rest of the time they either consolidate or fall
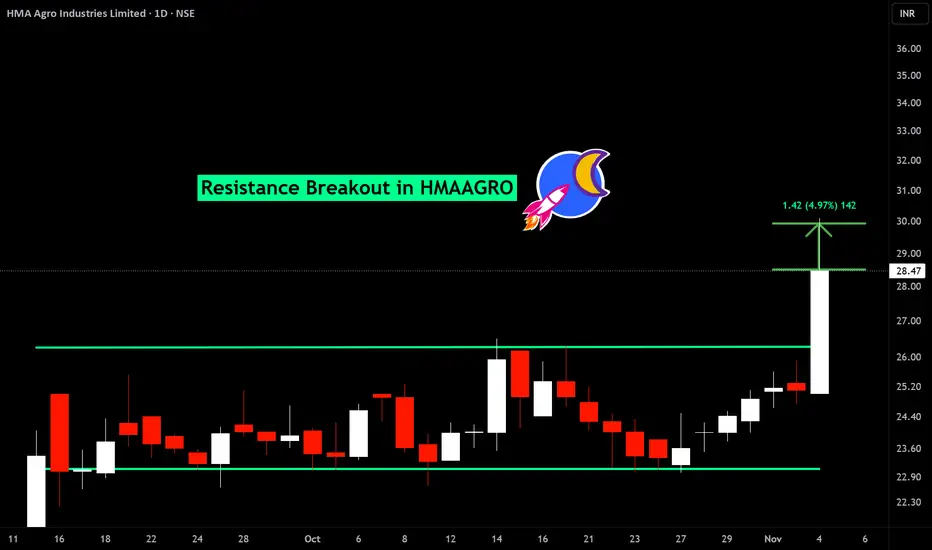
Resistance breakout in HMAAGRO
BUY TODAY SELL TOMORROW for 5%