State Bank of IndiaCMP: ₹1,036
Support Zones
S1: ₹1,030–1,032
S2: ₹1,015–1,020 (Strong)
Major Support: ₹995–1,000
Resistance Zones
R1: ₹1,045–1,050
R2: ₹1,070–1,080
Major Resistance: ₹1,100–1,120
Technical Analysis
✅ Trend: Bullish
✅ Price is trading above most key moving averages.
✅ RSI is around 55, indicating healthy momentum without being overbought.
⚠️ MACD is still slightly weak, so expect volatility near resistance.
📈 A breakout above ₹1,050 with strong volume can trigger a move towards ₹1,080–1,100.
Trading Plan
Bullish Scenario
Buy above ₹1,050
Targets: ₹1,080 → ₹1,100 → ₹1,120
Stop-loss: ₹1,025
Bearish Scenario
If SBI breaks below ₹1,015, it may decline towards ₹1,000 and then ₹980.
Outlook
The overall structure remains positive as long as the stock holds above ₹1,015–1,020. A decisive breakout above ₹1,050 would strengthen the bullish case, while a break below ₹1,015 would weaken the short-term trend. ICICI BankSupport
S1: ₹1,374
S2: ₹1,350
Strong Support: ₹1,320–1,325
Resistance
R1: ₹1,431
R2: ₹1,455
Major Breakout: ₹1,480–1,500
Trading Plan
Bullish Scenario
Buy on dips near ₹1,375–1,390 if price shows reversal.
Fresh breakout buy above ₹1,431 with volume.
Upside targets:
₹1,455
₹1,480
₹1,500+
Bearish Scenario
If the stock closes below ₹1,374, weakness may extend toward ₹1,350 and then ₹1,320.
Technical View
Trend: Bullish
Momentum: Positive while above ₹1,374
Strategy: Buy on dips rather than chasing sharp rallies.  Long
Long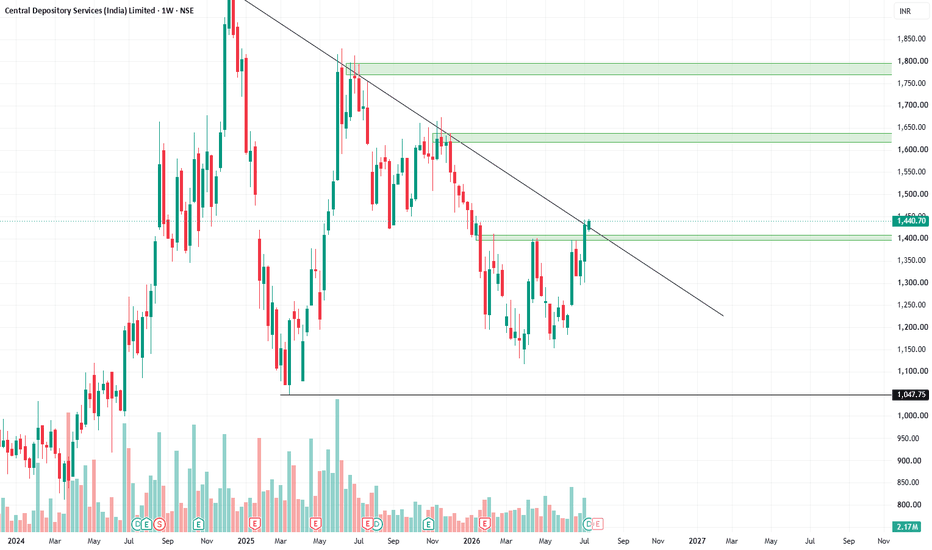
 Long
Long
Avenue Supermarts (DMART) | Daily Timeframe AnalysisNSE:DMART
Avenue Supermarts is currently trading within a large symmetrical triangle formation, indicating a period of consolidation after a strong rally. Price action has been respecting both the descending resistance trendline and the ascending support trendline, suggesting that a decisive move could emerge in the coming weeks.
🔹 Key observations:
• The stock has faced repeated rejection from the falling resistance line near the ₹4,300–₹4,600 zone.
• The ascending trendline from February lows continues to provide support, keeping the broader structure intact.
• The ₹4,000 level is acting as a crucial pivot zone. Sustaining above this level may keep bullish momentum alive.
• A breakout above the upper trendline could trigger fresh upside towards ₹4,400, ₹4,600 and higher levels.
• On the downside, a breakdown below the rising support may lead to increased selling pressure and open the gates for lower levels.
⚠️ Trading Strategy:
✔️ Bullish confirmation only above the upper trendline with strong volume.
✔️ Bearish confirmation below the ascending support.
✔️ Until a breakout or breakdown occurs, traders may expect range-bound movement inside the pattern.
Levels to watch:
📌 Resistance: ₹4,200–₹4,300
📌 Major Resistance: ₹4,600
📌 Support: ₹3,900–₹3,950
📌 Breakdown Zone: Below ₹3,850
This analysis is purely for educational purposes and should not be considered investment advice. Always use proper risk management before taking any trade.
==============
⚠️ Disclaimer:
==============
This content is shared strictly for educational and informational purposes.
We are not SEBI-registered investment advisors or analysts.
The views expressed are personal opinions, based on publicly available data and market observations.
Please consult a SEBI-registered investment advisor before taking any investment or trading decisions.
Any actions taken based on this content are entirely at your own risk and responsibility.
========================
Trade Secrets By Pratik
========================  Long
Long
 Long
Long
Long 
 Short
Short
Long 
Peak to Flip: A 50% Story That RepeatedThis post is educational and observational in nature based on historical price action on a monthly timeframe. It is not a forecast or a trading recommendation.
1) Marked on this chart in white are three separate flip zones. A flip zone is a price level that once acted as resistance, and after being broken and sustained above, converted into support. Markets often revisit these levels later, and when they hold from above, it confirms the flip.
2) Each time one of these flip zones formed, a similar sequence followed. Price rallied from the flip zone, reached a peak, meaning the highest point of that particular move, and then fell back down. What stood out across all three instances is where that fall eventually found support.
In each of the three cases, the decline from peak to bottom landed close to a 50% retracement of that move, and in each case, the level where price stopped falling was the same flip zone that had originally supported the rally. The zone that launched the move also caught the fall.
3) This is not a rule, not a strategy and not a signal to act on. It is simply a repeated observation across this specific chart, on this specific timeframe, three separate times. Seeing the same relationship between a flip zone, a rally, a peak and a roughly 50% retracement recurring more than once is the kind of pattern recognition that comes only from spending time studying price history closely.  Long
Long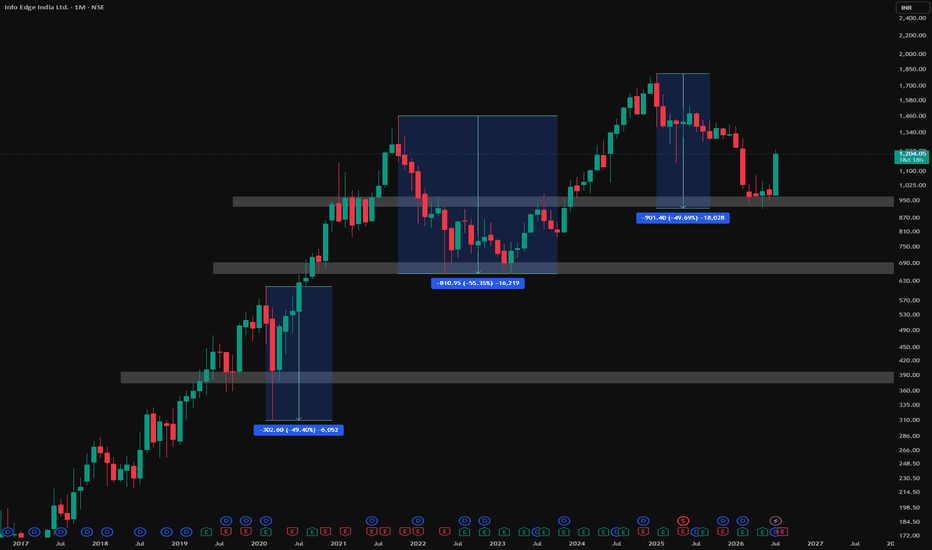
CDSL 3-Month Breakout with Strong Volume📊 CDSL: Daily Technical Snapshot – 3-Month Breakout with Strong Volume
📊 STWP Technical Analysis
________________________________________
MARKET STRUCTURE SNAPSHOT | NSE: CDSL | DAILY
Closing Price: 1,431.90 (+85.40 | +6.34%)
Core Trend: Strong Uptrend
Market State: Confirmed 3-Month Breakout
Price Structure: Price has broken above a three-month consolidation range with a powerful bullish candle, supported by exceptionally strong volume and broad market participation.
________________________________________
OPERATIONAL PRICE GRID & KEY REFERENCE LEVELS
Model Reference Level: 1,443.00
Hard Invalidation Level: 1,299.10
Structural Risk: 143.90 (9.97%)
Resistance Levels: R1 1,465.70 | R2 1,499.50 | R3 1,556.00
Support Levels: S1 1,375.40 | S2 1,318.90 | S3 1,285.10
Range Structure: Low 1,299.10 | High 1,556.00
Higher Timeframe Observation Zones: 1,586 | 1,730 | 1,874
________________________________________
MOMENTUM, PARTICIPATION & CPR DATA
Volume Profile: 9.18 Million Shares
Volume Character: Extremely High Relative Participation
RSI: 68.95 (Strong Momentum Zone)
ADX: 24.95 (Strengthening Trend)
ROC: +8.72%
MACD Status: Strong Positive Momentum with Fresh Bullish Crossover
CCI: +164.10 (Strong Bullish Momentum)
Stochastic Reading: 92.49 (Extended Momentum Zone)
Current Bias: BUY ON PULLBACKS
CPR State: Bullish Zone | CPR Moving Up (Wide)
Today's CPR: Pivot 1,339.05 | Top 1,342.75 | Base 1,335.30
Tomorrow's CPR (Projected): Pivot 1,409.20 | Top 1,420.55 | Base 1,397.85
________________________________________
📚 EDUCATIONAL OBSERVATION
Central Depository Services (India) Ltd. (CDSL) has delivered a decisive 3-month breakout, closing above a prolonged consolidation range with a strong bullish candle supported by exceptionally high trading volume. Such breakouts often indicate that demand has successfully absorbed supply over an extended period, allowing the stock to transition from consolidation into a potential expansion phase.
The breakout is reinforced by multiple technical confirmations, including a Three Inside Up candlestick pattern, a MACD bullish crossover, an RSI breakout, and Bollinger Band expansion. The sharp increase in trading volume further strengthens the breakout, suggesting broad market participation and improving institutional interest rather than a low-volume price move.
Several technical factors are currently aligned in support of the bullish structure:
Momentum indicators continue to support the prevailing trend. The RSI at 68.95 reflects strong bullish momentum while remaining just below the conventional overbought threshold. MACD has generated a fresh bullish crossover, signalling improving trend strength, while ADX at 24.95 indicates that the trend is becoming stronger. The ROC of +8.72% highlights healthy price acceleration, and the CCI reading of +164.10 confirms robust upside momentum. Meanwhile, the Stochastic reading of 92.49 suggests strong buying pressure, although traders should also be mindful that short-term consolidations can occur after sharp advances.
The projected Central Pivot Range (CPR) for the next trading session has shifted significantly higher, with the projected Pivot at 1,409.20. A rising and widening CPR generally reflects improving market acceptance of higher prices and often supports trend continuation when accompanied by strong participation.
The immediate technical focus remains on the resistance zone between 1,466 and 1,500. A sustained move above this area could strengthen the existing bullish structure and bring the higher-timeframe observation zone near 1,556 into focus. On the downside, 1,375 remains the first important support, while the structural invalidation level is positioned near 1,299.
From a business perspective, CDSL is one of India's leading securities depositories, providing electronic depository services, settlement infrastructure and related capital market solutions. Continued growth in retail investor participation, increasing demat account penetration and expanding digital capital market infrastructure provide a constructive long-term outlook for the company.
Support and resistance levels should be viewed as observation zones rather than predictive targets. Chart patterns, price action, volume analysis, momentum indicators and CPR are educational tools intended to help market participants understand evolving market structure within a disciplined risk-management framework.
________________________________________
⚠️ Disclaimer
This analysis is provided strictly for educational and informational purposes.
This is not financial, investment or trading advice and should not be considered a recommendation to buy or sell any security.
Stock market investments are subject to market risks, including the possible loss of capital.
Past performance, historical observations, chart patterns and technical indicators do not guarantee future results.
Please conduct your own research and consult a SEBI-registered investment adviser before making investment decisions.
STWP assumes no responsibility or liability for any financial loss arising directly or indirectly from the use of this information.
Long 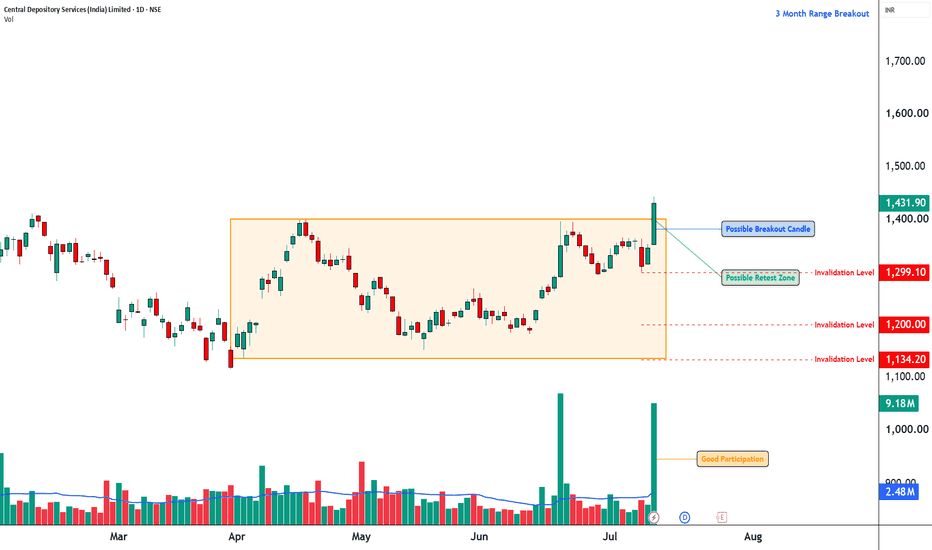
 Long
Long
 Long
Long
 Long
Long
 Long
Long
 Long
Long