Long
Long
 Long
Long
Beta Drugs Ltd📈 Beta Drugs Ltd. (1W) – Powerful Breakout Signals a New Bullish Phase 🚀
Beta Drugs has delivered a decisive breakout above a major multi-month resistance zone, indicating a strong shift in market sentiment. After a prolonged correction and base-building phase, the stock has regained momentum and is now showing signs of entering a fresh long-term uptrend. 👀
🔍 Technical Highlights
✅ Major Breakout Above ₹2,210
The stock has successfully broken above the ₹2,210 resistance zone, which had repeatedly acted as a strong supply area. This breakout significantly strengthens the long-term technical structure.
✅ Strong Trend Reversal
After finding support near ₹995, Beta Drugs has formed a textbook sequence of higher highs and higher lows, confirming that buyers have regained control.
✅ Momentum Continues to Build
The breakout is backed by large bullish weekly candles, reflecting strong buying interest and increasing participation. Sustaining above the breakout zone could attract further momentum buying.
🎯 Measured Move Projection
If the stock holds above ₹2,210 on a weekly closing basis, the measured move projects a potential rally towards the ₹3,400 zone, offering an upside of nearly 50% from the breakout level.
⚠️ What Traders Should Watch
🔹 A weekly close above ₹2,210 would strengthen the breakout confirmation.
🔹 A successful retest of ₹2,210 as support would further validate the bullish setup.
🔹 Avoid chasing extended rallies. Waiting for confirmation or a healthy pullback can improve the overall risk-reward.
📌 Key Levels
🟢 Breakout Level: ₹2,210
🛡️ Major Support: ₹2,000 followed by ₹1,700
🎯 Potential Target: ₹3,400
💡 Final Thoughts
Beta Drugs has transitioned from a prolonged consolidation into a strong bullish trend. As long as the stock sustains above the ₹2,210 breakout zone, the technical outlook remains positive with the potential for a move towards ₹3,400 over the medium term.
📢 Do you think Beta Drugs is entering a fresh long-term bull run, or will it retest the breakout zone before moving higher? Share your views below! 👇  Long
Long
Godrej Industries Ltd📈 Godrej Industries Ltd. (1W) – Fresh Breakout Signals the Start of a New Uptrend 🚀
Godrej Industries has delivered a strong breakout above a key multi-month resistance zone, backed by one of the strongest weekly candles in recent months. After a prolonged consolidation, the stock appears to be entering a fresh bullish phase with momentum shifting decisively in favor of the buyers. 👀
🔍 Technical Highlights
✅ Major Breakout Above ₹1,388
The stock has convincingly broken above the ₹1,388 resistance level, which had acted as a significant supply zone. This breakout improves the long-term technical outlook.
✅ Bullish Price Structure
Following a strong recovery from the ₹750 support area, the stock has established a sequence of higher highs and higher lows, confirming a sustained trend reversal.
✅ Strong Momentum
The recent breakout is supported by a large bullish weekly candle, reflecting aggressive buying interest and increasing market participation.
🎯 Measured Move Projection
If the stock sustains above ₹1,388 on a weekly closing basis, the measured move suggests a potential rally towards the ₹2,000 zone, representing an upside of nearly 40–45%.
⚠️ What Traders Should Watch
🔹 A weekly close above ₹1,388 confirms the breakout.
🔹 Any healthy pullback that successfully retests ₹1,388 as support would strengthen the bullish case.
🔹 Avoid chasing extended rallies and focus on confirmation or retracement-based entries.
📌 Key Levels
🟢 Breakout Level: ₹1,388
🛡️ Major Support: ₹1,250 followed by ₹1,100
🎯 Potential Target: ₹2,000
💡 Final Thoughts
Godrej Industries has transitioned from a prolonged consolidation into a strong bullish trend. As long as the stock holds above the breakout zone, the technical structure favors further upside toward the ₹2,000 mark.
📢 Do you think Godrej Industries is entering a fresh long-term rally? Share your views below! 👇  Long
Long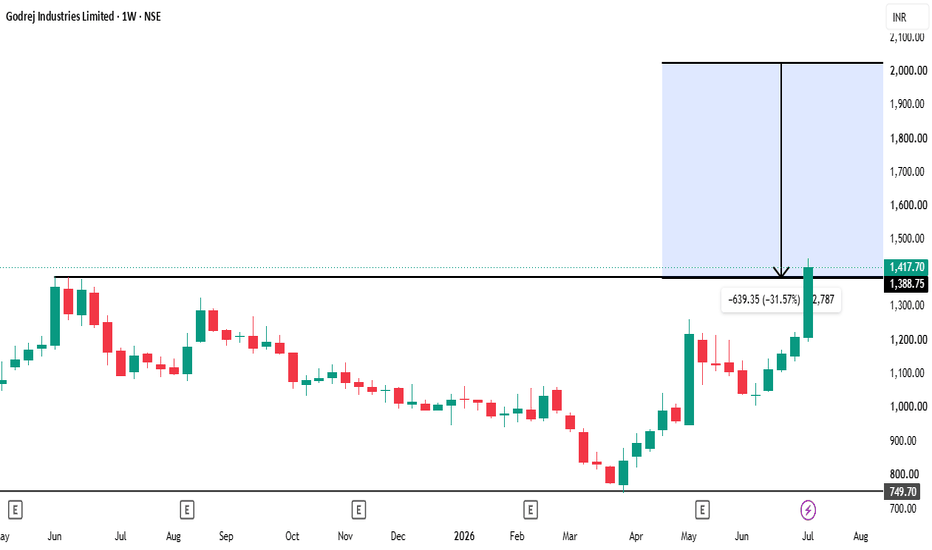
Balaji Amines Ltd📈 Balaji Amines Ltd. (1W) – Breakout Opens the Door for a Fresh Uptrend 🚀
Balaji Amines has delivered a convincing breakout above a major multi-month resistance zone after a strong recovery from its lows. The recent price action indicates that buyers have regained control, and the stock could be preparing for the next leg of its upward journey. 👀
🔍 Technical Highlights
✅ Breakout Above Major Resistance:
The stock has decisively crossed the ₹2,350 resistance zone, a level that had repeatedly acted as a strong supply area. This breakout marks a significant improvement in the long-term technical structure.
✅ Powerful Trend Reversal:
After forming a solid base near ₹987, the stock has rallied sharply while consistently forming higher highs and higher lows, confirming a healthy bullish trend.
✅ Strong Bullish Momentum:
The breakout is supported by strong weekly bullish candles, reflecting sustained buying interest and improving market sentiment.
🎯 Measured Move Projection:
If the stock sustains above ₹2,350 on a weekly closing basis, the measured move projects a potential upside towards the ₹3,600 zone, offering nearly 50% upside from the breakout level.
⚠️ What Traders Should Watch
🔹 A weekly close above ₹2,350 would strengthen the breakout confirmation.
🔹 Any healthy pullback that successfully retests ₹2,350 as support would reinforce the bullish setup.
🔹 While momentum is strong, avoiding emotional entries after extended rallies and waiting for confirmation can improve the overall risk-reward.
📌 Key Levels
🟢 Breakout Level: ₹2,350
🛡️ Major Support: ₹2,000 followed by ₹1,700
🎯 Potential Target: ₹3,600
💡 Final Thoughts
Balaji Amines has transitioned from a prolonged consolidation into a strong bullish phase. With price now trading above a significant resistance zone, the technical setup favors further upside as long as the breakout level holds. A sustained move above ₹2,350 could pave the way for a rally toward the ₹3,600 zone over the medium term.
📢 Is Balaji Amines entering a fresh long-term bull run, or will it consolidate around the breakout zone before the next move? Share your thoughts below! 👇  Long
Long
 Long
Long
 Long
Long
Long 
 Long
Long
DLF — Reclaiming EMAs After Multi-Year Trendline Support TestOverview
DLF has staged a sharp move today (+3.96%, closing at 685.75), reclaiming both its 50 EMA (615) and 200 EMA (645) after a multi-month downtrend from the 2024 high of 967.60. This bounce comes off a well-established rising trendline that has held since 2021, having been tested and respected at the 2022 low, the 2023 low, and again at the recent 2026 low — making it a genuine multi-year structural support.
Closer view of recent Chart patterrn
Pattern Explanation
The stock has been in a broad uptrend since 2021, with a long-term rising trendline connecting successive higher lows across 2022, 2023, and now 2026. Price recently pulled back to test this trendline again near the 517–520 zone before today's sharp reversal. The move has pushed price back above both EMAs in a single session, which is often an early signal of a potential trend shift after an extended decline, though it needs follow-through to confirm.
Key Levels
Resistance Zone: 806
200 EMA: 645 (644.52)
50 EMA: 615 (614.91)
Support / Invalidation Zone: 517.65
Major Reference High: 967.60
Major Reference Low: 231.85
Scenarios
If the EMA reclaim holds: Continued stabilization above the 615–645 zone would support the case that this is a genuine trend shift rather than a one-day bounce, with the Resistance Zone at 806 as the next major level to watch.
If the reclaim fails: A close back below the 50 EMA (615), and especially a break below the Support/Invalidation zone at 517.65, would suggest today's move was a temporary bounce within the larger downtrend, keeping the long-term rising trendline as the key structural level to watch instead.
Beginner's Lesson
Reclaiming key moving averages after an extended decline is a meaningful technical event, but a single strong session isn't enough to confirm a trend change on its own. What matters more is whether price can hold above these averages over the following sessions rather than slipping back below them — that follow-through is what separates a genuine shift from a short-lived bounce.
Conclusion
DLF has shown a strong reaction off multi-year trendline support today, reclaiming both EMAs in the process. As always, wait for confirmation over the next few sessions before drawing firm conclusions, and manage risk according to your own plan.
Not investment advice. For educational purposes only. Please consult your financial advisor before making any trading decisions. Long 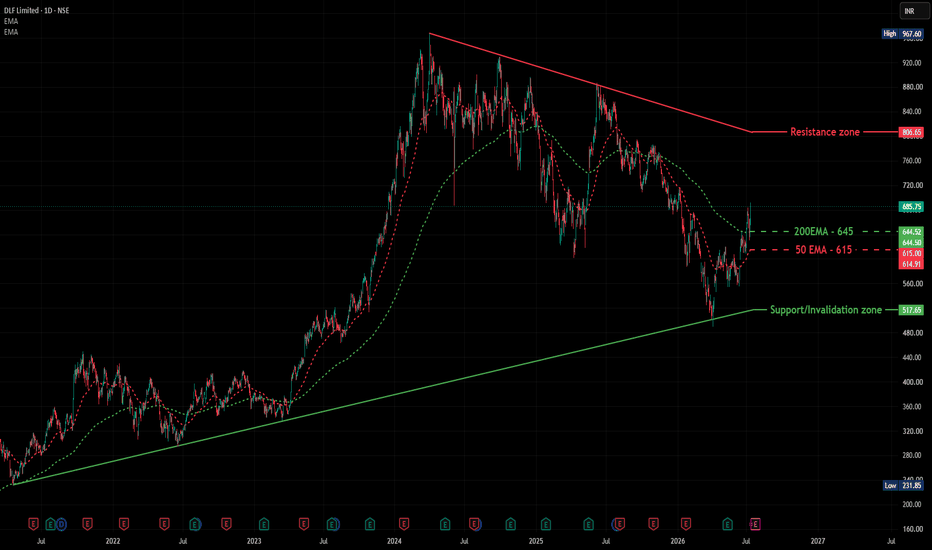
 Short
Short
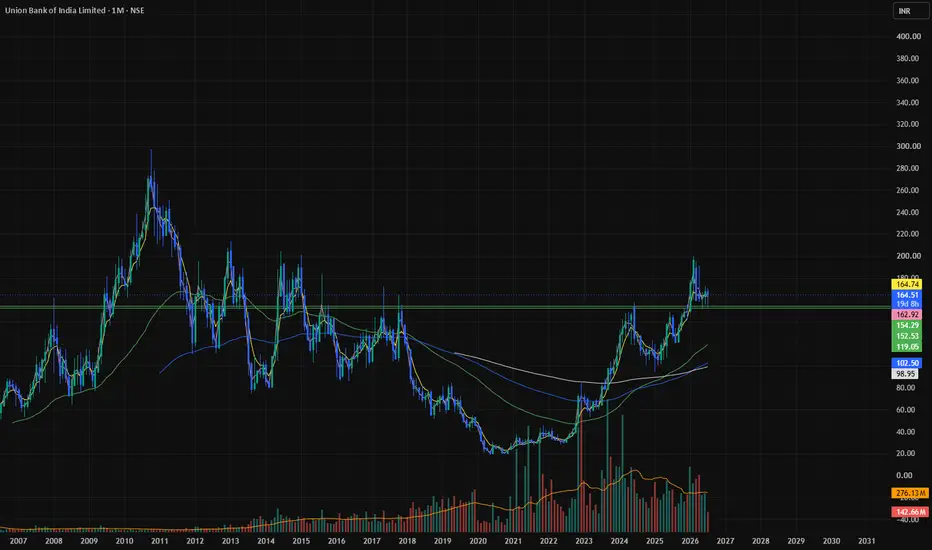
UNION BANK **Union Bank – Multi-Year Breakout with Strong Long-Term Potential**
Union Bank has delivered a significant **multi-year breakout** above the **₹150–155** resistance zone, indicating the possibility of a sustained long-term uptrend. Following this breakout, the stock has the potential to move towards its **all-time high over the next 1–2 years**, provided the broader market and business fundamentals remain supportive.
From a macro perspective, PSU banks are expected to play a pivotal role in India's long-term economic growth. As India's economy continues to expand through increased infrastructure spending, credit growth, and financial inclusion, public sector banks are well positioned to benefit from this structural trend.
While private sector banks have consistently demonstrated strong performance and are likely to continue growing, I believe the coming decade could belong to **PSU banks**. Their improving asset quality, stronger balance sheets, and attractive valuations make them compelling long-term investment opportunities.
Among the PSU banking space, **Union Bank** stands out as one of the potential leaders and could be a key beneficiary of India's next phase of economic growth.
 Long
Long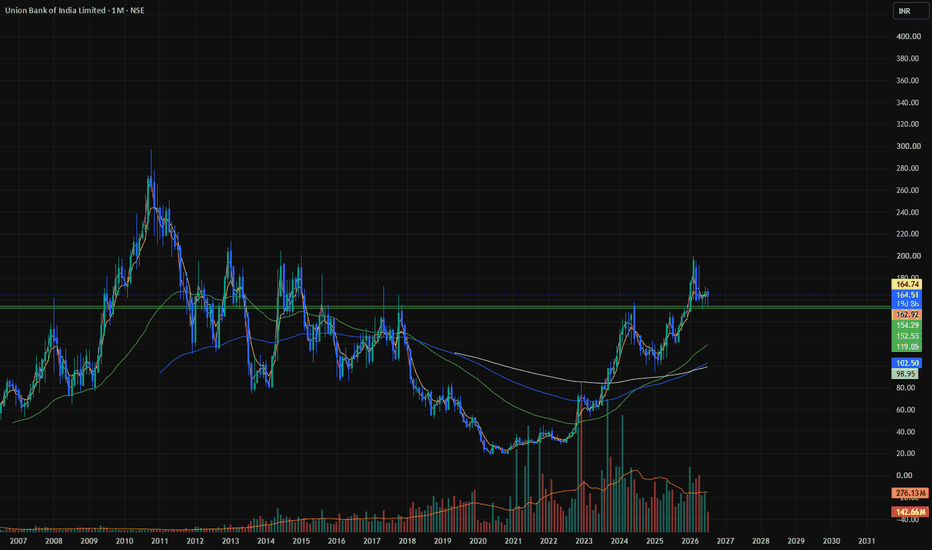
 Long
Long
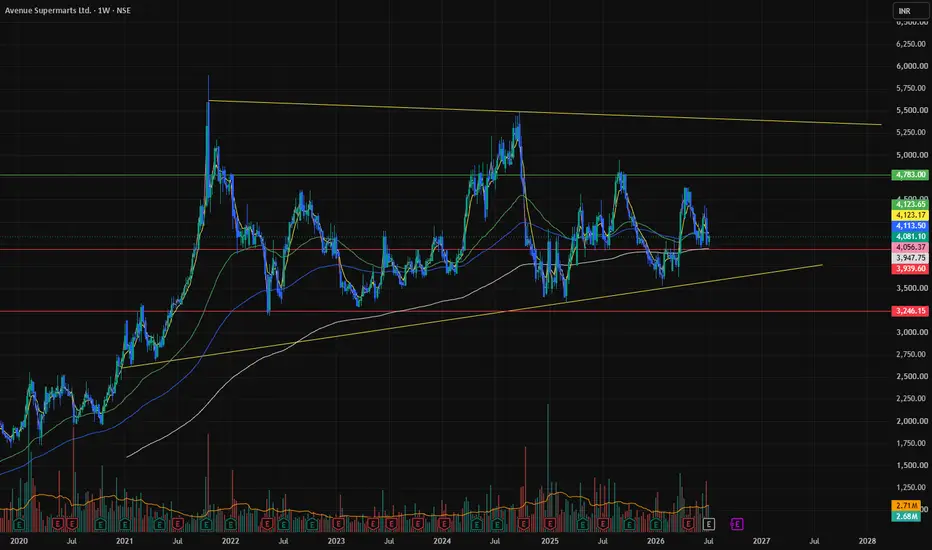
DMART **Retail King – Strong Long-Term Opportunity**
The company continues to demonstrate strong business fundamentals, supported by a robust balance sheet and consistent earnings growth. Despite the stock price remaining relatively stagnant over the past few years, the underlying business has continued to strengthen, creating the potential for a significant re-rating.
**Technical View:**
* A decisive breakout above the **₹4,790–4,800** resistance zone would confirm renewed bullish momentum.
* If the stock subsequently delivers a **strong monthly close above the ₹4,800–5,250 range**, it could signal the beginning of a major long-term uptrend.
* In such a scenario, the stock has the potential to target the **₹9,500–10,000** zone over the long term.
The combination of improving fundamentals and a confirmed technical breakout could make this stock one of the strongest retail sector leaders in the coming years.
 Long
Long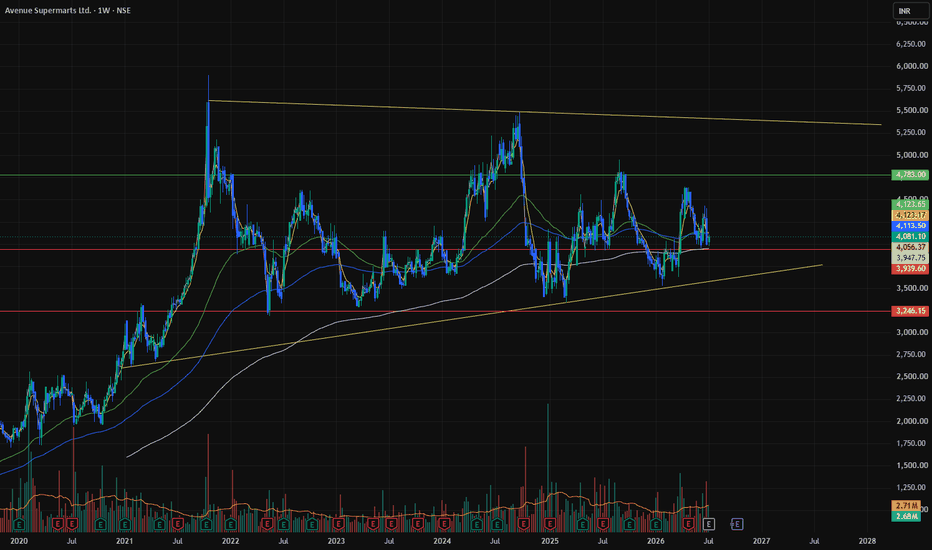
 Long
Long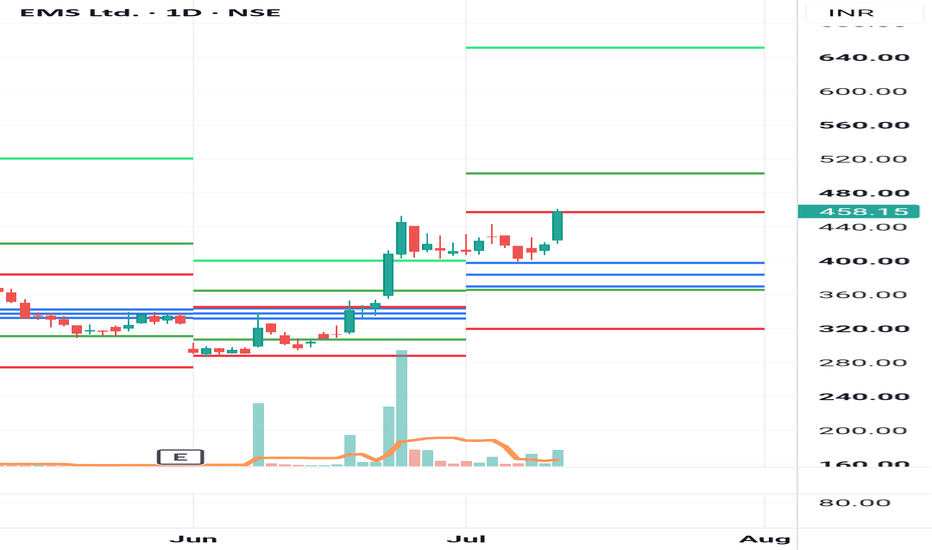
Reading the Full Structure ( Technical Terms ) This post is educational and observational in nature based on historical price action. It is not a forecast or a trading recommendation.
The Two Parallel Channels
-Marked with dotted white lines are two parallel channel structures on this chart, an upward one and a downward one, each telling a different part of the story.
-The downward parallel channel contains price within two descending parallel lines, and the breakout here happened by moving outside this channel, meaning price broke free of the falling structure entirely.
-The upward parallel channel works differently in this context. Its lower boundary is being treated as a trendline support, meaning the same rising line that once contained price within the channel is now acting as a floor that price is respecting from above.
-Together these two channels show how the same tool can serve two different purposes depending on the direction of the structure and where price is positioned relative to it.
The Descending Triangle Pattern
Marked in red is a descending triangle, formed by a flat support base at the bottom with a series of lower highs pressing down against it. This pattern typically reflects a struggle between sellers who are gradually stepping in earlier and buyers defending a consistent floor.
Disclaimer: This post is purely educational and observational in nature based on historical price action. It does not constitute financial advice, a forecast, or a recommendation to buy, sell, or hold any security.
Long 
 Long
Long
 Long
Long
 Long
Long
Bullish Setup: Support, Fibonacci Confluence and Fair Value GapPrice has retraced into a major support zone around $237–$239, where buyers previously stepped in. This area also aligns with the 0.50–0.618 Fibonacci retracement zone, creating strong technical confluence.
During the retracement, price entered a bullish fair value gap, suggesting that the imbalance could act as a demand zone. After briefly trading below the support area, price recovered and began forming higher lows, indicating that selling pressure may be weakening.
The bullish scenario remains valid while price holds above the $227–$230 invalidation zone. A sustained move above the nearby resistance and bearish fair value gaps around $247–$254 would provide further confirmation.
My upside target is approximately $278, which corresponds with the previous swing high and the 0 Fibonacci level. The setup offers an estimated 2.5 risk-to-reward ratio.
Key levels:
- Entry/support zone: $237–$240
- Stop-loss/invalidation: below $234
- Target: $275
This analysis is based on Fibonacci confluence, market structure, support and fair value gaps. It is not financial advice.  Long
Long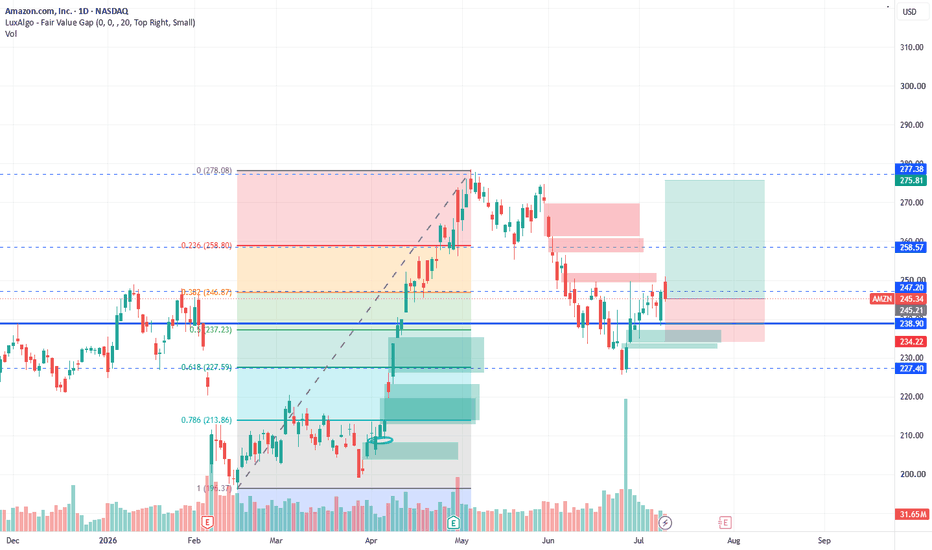
Trading AnalysisWhere is Nifty right now?
Nifty closed at 23,689 on Thursday May 14. After a brutal fall earlier this week (it touched ~23,300), it bounced back for 2 days in a row. So right now it's in a recovery mood — but it hasn't really "fixed" itself yet. Think of it like someone who had a fever, now feeling slightly better, but not fully healthy.
2 What's the wall above? (Resistance)
If Nifty tries to go up next week, it will hit a wall around 23,500–23,600 first. That's the first test. If it somehow crosses that, the BIGGER wall is at 23,900–24,000 — where all the major moving averages (50-day & 200-day) are sitting. Lots of sellers will be waiting there to book profits. So going above 24,000 next week? Unlikely unless something very positive happens.
3 What's the floor below? (Support)
If Nifty starts falling, the first safety net is around 23,300–23,150. This zone has held multiple times recently. If it breaks this level decisively (and stays below it), then the next stop could be 23,000 or even 22,900. That's the danger zone — but that's not the most likely scenario for next week.