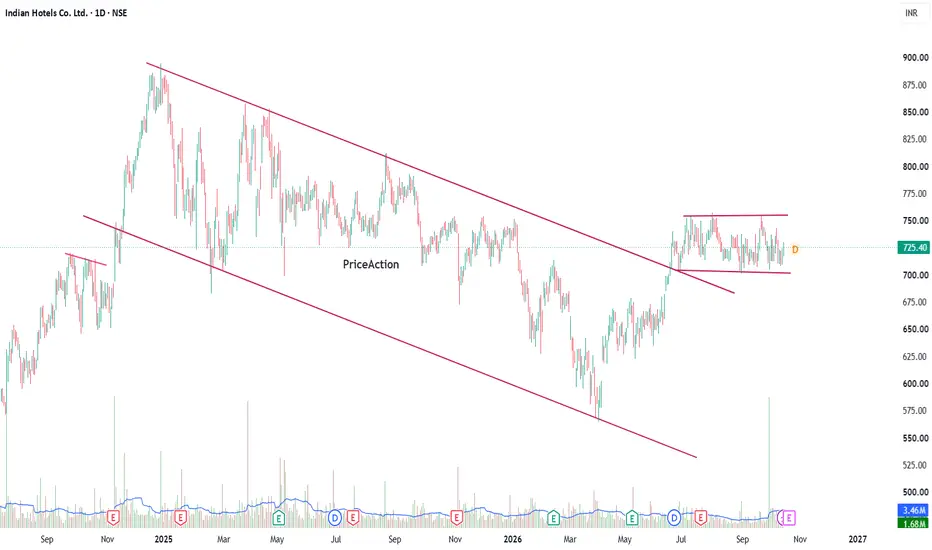
INDIAN HOTELS | Descending Channel Breakout & ConsolidationOn the daily timeframe, Indian Hotels Company has shown a recovery from its recent lows and a breakout above the previous descending channel trendline.
Price is currently consolidating in a range around ₹700–₹755, forming a short-term structure that may lead to a potential breakout or breakdown.
Key Levels to Watch:
Resistance: ₹750–₹755
Immediate Support: ₹700–₹705
Bullish Scenario: A decisive breakout above ₹755, supported by strong volume, could indicate further upside momentum.
Bearish
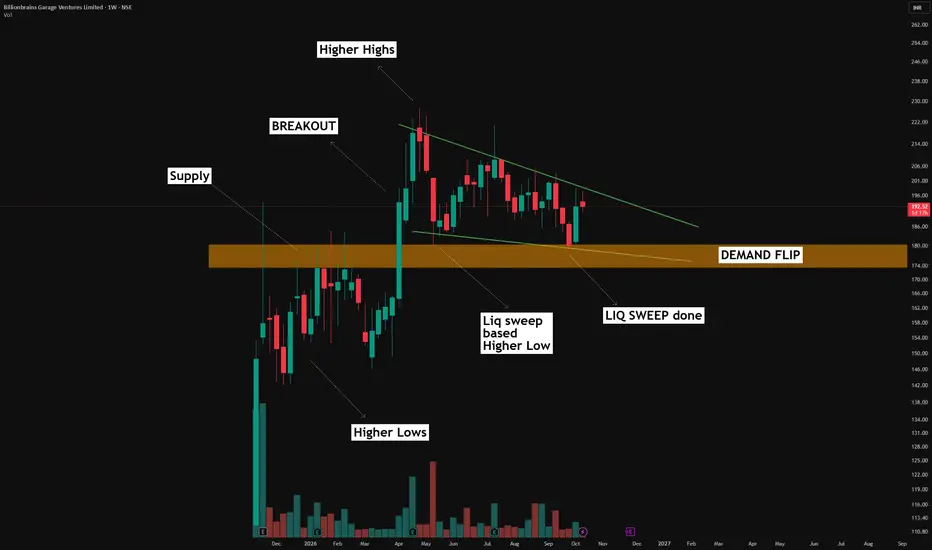
Higher Highs, Flip Zone, Liquidity Sweep: Read the ChartAPOORV DUBEY | SEBI Registered Research Analyst
⚠️ This post is for educational purposes only. It is not a recommendation to buy, sell or hold any security.
Why this post?
The aim is not to forecast anything. It is to show you how to read price structure yourself, step by step. All the levels discussed are marked on the chart.
1. Higher High, Higher Low structure
A classical uptrend is a series of higher highs (HH) and higher lows (HL).
Each pullback holds above the previous low, and ea
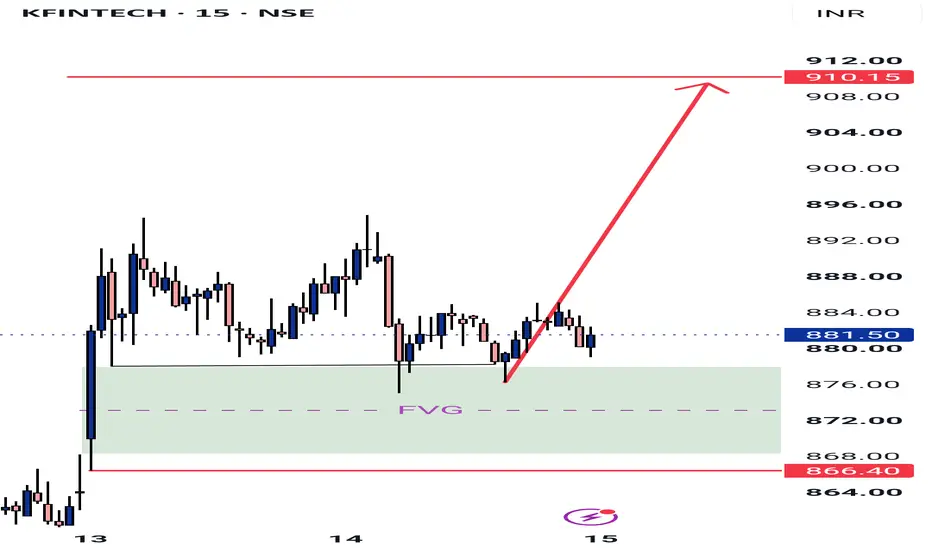
YUKENGO LONG YUKEN AT 930-345 LEVEL
Key Levels:
Immediate resistance: ₹960 (prior swing high) → ₹1,040 (gap zone from earlier retracement)
Support/base: ₹840–860 (recent breakout shelf) → ₹698 (secondary demand zone)
Invalidation: A daily close below ₹840 would weaken this breakout thesis
View:
Structurally, this looks like a momentum continuation setup — a stock basing after a steep correction, then breaking out with strength. Not a "near 52-week low" value pick; this is a breakout/momentum trade
Global Financial MarketsGlobal financial markets are systems where people, companies, and governments buy and sell financial assets across the world. They help move money from those who have extra funds to those who need funds.
Main Types of Global Financial Markets:
Stock Markets – Buying and selling shares of companies (e.g., NYSE, NSE).
Bond Markets – Governments and companies borrow money by issuing bonds.
Foreign Exchange (Forex) Markets – Trading currencies like USD, EUR, INR.
Commodity Markets – Trading gold, o
A Spectrum Shift!Pattern Structure: The chart showcases a well-defined descending wedge breakout.
Volume Analysis: A substantial surge in buying volume confirms the validity of the breakout, providing the necessary conviction to protect against potential false signals.
Supply and Demand Conversion Zone: Observe the transition zone on the chart: a former demand area that flipped into resistance, and has now been decisively reclaimed, positioning it to act as support once again.
Importance of Risk Management: S
BUY TODAY SELL TOMORROW for 5%DON’T HAVE TIME TO MANAGE YOUR TRADES?
- Take BTST trades at 3:25 pm every day
- Try to exit by taking 4-7% profit of each trade
- SL can also be maintained as closing below the low of the breakout candle
Now, why do I prefer BTST over swing trades? The primary reason is that I have observed that 90% of the stocks give most of the movement in just 1-2 days and the rest of the time they either consolidate or fall
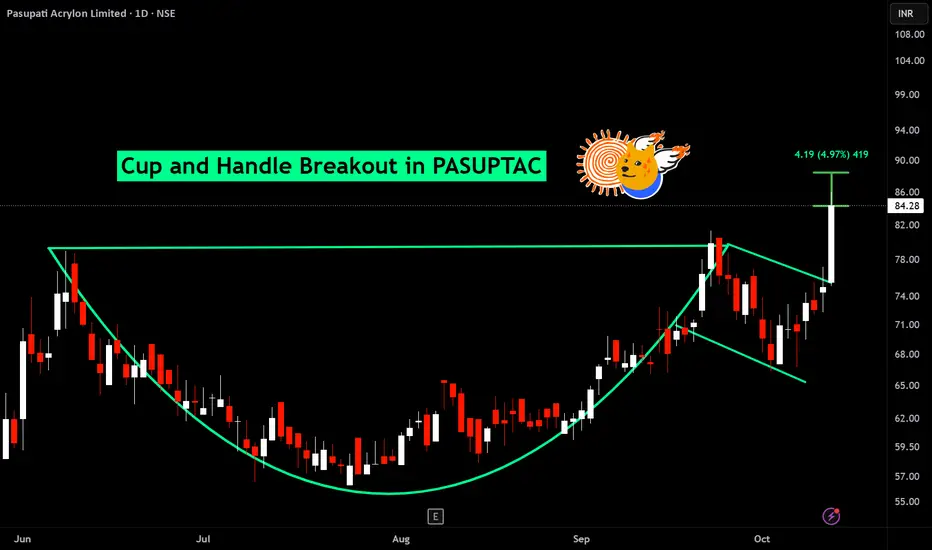
Cup and handle breakout in PASUPTAC
BUY TODAY SELL TOMORROW for 5%
TCS IS BACK IN ACTION (AI ERA) 📌 TATA CONSULTANCY SERVICES (NSE: TCS) – Breakout After Q2 FY27 Results 🚀
TCS has broken out of a multi-week downward trendline after forming a rounding-bottom (cup) structure on a strong demand zone. The breakout came with a spike in volume right after the Q2 FY27 results.
- India's largest IT services company by market cap, with a very large order book
━━━━━━━━━━━━━━━━━━━━
🏢 Q2 FY27 RESULTS (8 Oct 2026)
━━━━━━━━━━━━━━━━━━━━
💰 Revenue: ₹73,188 cr
📊 Net profit: ₹13,884 cr
🤖 AI Revenue: annual
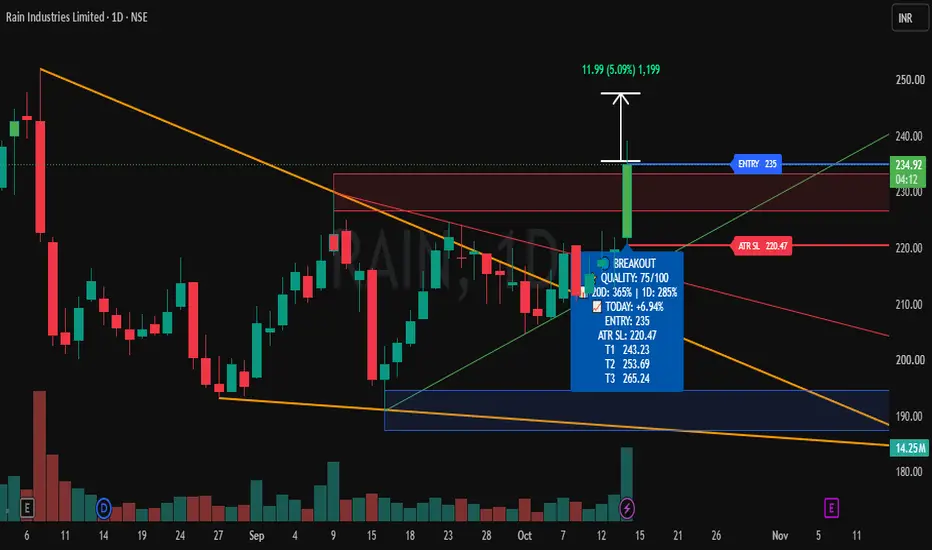
Buy Today, Sell Tomorrow for 3-5% - Daily Breakout SetupRAIN — BTST BREAKOUT SETUP
Entry, Stop Loss & Targets Are Clearly Defined — Helping You Plan Your Trade With Confidence.
📊 Stock Strength: 75/100
(Note: Higher score indicates stronger stock conditions, not guaranteed returns.)
A bullish breakout has appeared on the 1D timeframe with positive price action and strong volume expansion.
🔄 Trade Type: BTST
────────────────────
🎯 TRADE LEVELS
ENTRY: ₹236
🛑 STOP LOSS
ATR SL: ₹221
🎯 TARGETS
3–5%
────────────────────
📈 VOLUME
20D Volume: 359%
Buy Today, Sell Tomorrow for 3-5% - Daily Breakout SetupHINDCOMPCO — BTST BREAKOUT SETUP
Entry, Stop Loss & Targets Are Clearly Defined — Helping You Plan Your Trade With Confidence.
📊 Stock Strength: 97/100
(Note: Higher score indicates stronger stock conditions, not guaranteed returns.)
A bullish breakout has appeared on the 1D timeframe with positive price action and strong volume expansion.
🔄 Trade Type: BTST
────────────────────
🎯 TRADE LEVELS
ENTRY: ₹466
🛑 STOP LOSS
ATR SL: ₹438
🎯 TARGETS
3–5%
────────────────────
📈 VOLUME
20D Volume
SKYGOLD Bullish Breakout from Rectangular ConsolidationLooking at the daily timeframe for Sky Gold and Diamonds Limited, the stock has been trading within a clear rectangular consolidation zone for several weeks.
The price action was largely range-bound, oscillating between a support level near the 740 zone and a resistance level around the 850 mark.
Recently, we can observe a strong bullish breakout above the upper boundary of this consolidation box.
Crucially, this breakout candle is accompanied by a massive surge in trading volume, which valida
PRADPME Bull Flag Breakout Validated by Historic VolumePradeep Metals Limited is demonstrating a classic bullish continuation setup on the daily timeframe.
After a strong initial rally from the 380 levels up to 600 (forming the flagpole), the stock entered a multi-month consolidation phase within a well-defined descending channel.
The most recent price action shows a decisive breakout above the upper resistance line of this channel.
Crucially, this breakout is supported by a massive spike in volume (over 514K), which dwarfs the average daily vol
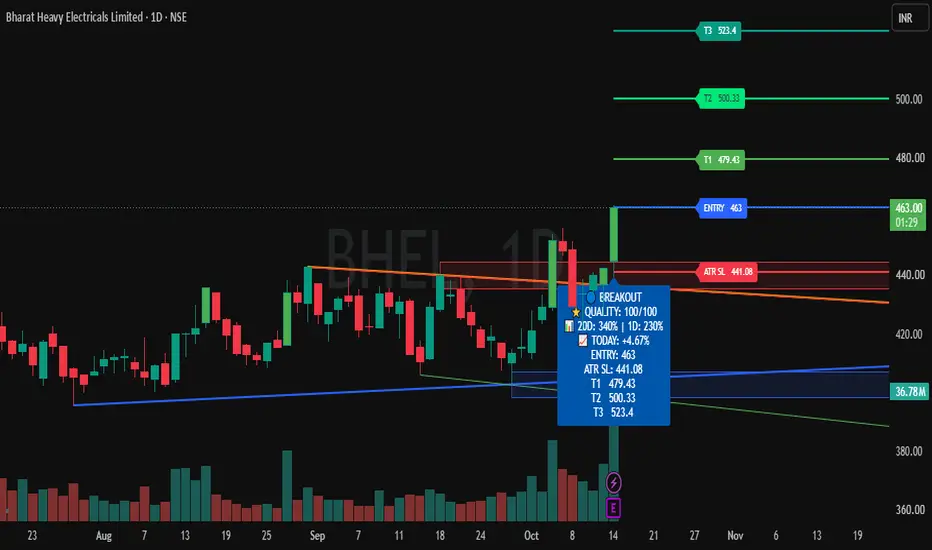
Buy Today, Sell Tomorrow for 3-5% - Daily Breakout SetupBHEL — BTST & SWING BREAKOUT SETUP
Entry, Stop Loss & Targets Are Clearly Defined — Helping You Plan Your Trade With Confidence.
📊 Stock Strength: 100/100
(Note: Higher score indicates stronger stock conditions, not guaranteed returns.)
A bullish breakout has appeared on the 1D timeframe with positive price action and strong volume expansion.
🔄 Trade Type: BTST & Swing Trade
────────────────────
🎯 TRADE LEVELS
ENTRY: ₹463
🛑 STOP LOSS
ATR SL: ₹441
🎯 TARGETS
T1: ₹479
T2: ₹500
T3: ₹523
──
RAMBHAJO Strong Breakout Above Key ResistanceTaking a look at the daily timeframe for Advit Jewels Limited, we can see a compelling technical setup.
After a strong impulsive move in late August, the stock entered a period of healthy consolidation, forming a clear resistance ceiling around the 307.80 mark.
In the most recent trading session, the price printed a strong bullish Marubozu-style candle, successfully breaking and closing above this key resistance level at 328.00 (+7.51%).
This decisive price action indicates a high probability
HCLTech Surges Following Strong Q2 ResultsHighlights
HCLTech is trading around ₹1,335–₹1,345 after a sharp earnings-led rally. The stock gained approximately 8.4% on October 13 following its Q2 FY27 results announced on Monday, October 12, rather than Saturday.
Immediate resistance is around ₹1,350–₹1,355. A sustained breakout above ₹1,355 could push the stock towards ₹1,380–₹1,400, followed by ₹1,430.
On the downside, ₹1,315–₹1,325 is the immediate support zone, while ₹1,280–₹1,300 remains the stronger demand area.
Momentum has
DIVGIITTS Classic Break and Retest Setup at Key SupportOverview & Technical Analysis
Looking at the weekly chart for Divgi TorqTransfer Systems Ltd, we can observe a textbook example of a "break and retest" technical setup.
The stock recently broke out of a structural base, forcefully clearing a major horizontal resistance line at 1,115.4.
This breakout was accompanied by a massive surge in buying volume, validating the upward momentum.
Following the initial upside rally, the price pulled back to retest the 1,115.4 level. As per classic market st
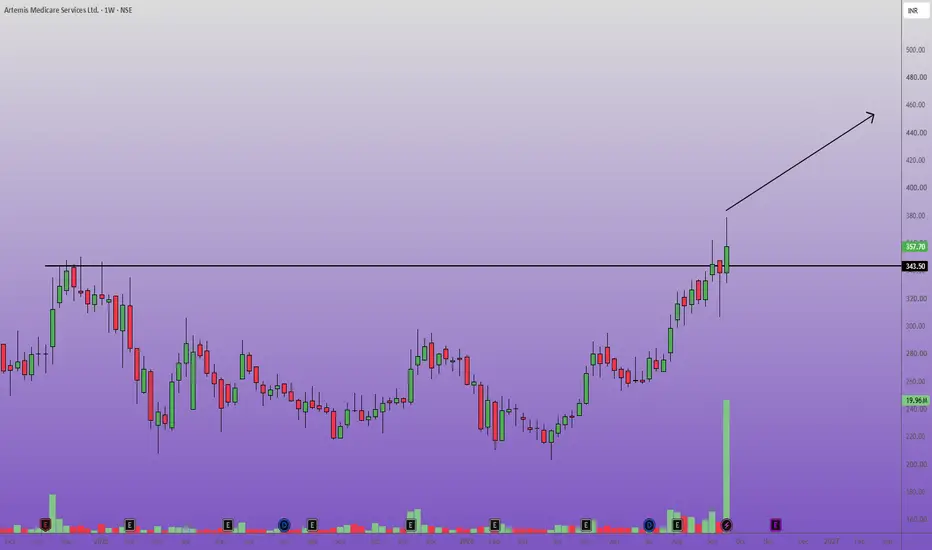
ARTEMISMED Weekly Breakout with Massive Volume SurgeArtemis Medicare Services Ltd. has formed a highly bullish technical setup on the weekly timeframe.
The stock recently broke out above a critical horizontal resistance line at the 343.50 level.
This breakout is validated by a massive, anomalous spike in trading volume, indicating strong institutional accumulation and high conviction behind the move.
Following a prolonged period of volatility and basing, this price action suggests a structural shift in momentum.
The previous heavy resistance
SHANTIGOL Weekly Breakout Above Key Resistance & Strong VolumeThe weekly timeframe for Shanti Gold International Limited.
Following a prolonged period of consolidation and recovery from the 170 levels earlier this year, the stock has staged a decisive breakout above a major horizontal resistance zone.
Technical Analysis:
Price Action: The price has cleanly broken and closed above the critical resistance line at 271.35, a level that previously acted as a strong supply zone in August/September.
Volume Validation: The breakout is supported by a significant
CAPLIPOINT Major Resistance Breakout and RetestCaplin Point Laboratories Limited on the weekly timeframe outlines a clear bullish continuation setup.
Chart Analysis & Rationale
Major Structural Breakout: As seen the price decisively broke above a long-standing horizontal resistance level at 2,636.3.
This marks a significant shift in the broader market structure.
Volume Confirmation: The upward momentum that pushed the price through the 2,636.3 line was accompanied by a noticeable volume spike at the bottom of the chart, validating the stre
KPL : Strong Volume Breakout from Rectangular ConsolidationChart Analysis & Pattern:
Looking at the daily timeframe for Kwality Pharmaceuticals Ltd, the stock has spent the last several weeks moving sideways within a well-defined rectangular consolidation pattern.
The price has been bouncing strictly between a solid support base near 3,250 and a strong resistance ceiling around the 3,700–3,750 zone.
The Breakout & Volume Confirmation:
In the most recent trading session, KPL delivered a powerful bullish breakout, piercing through the upper boundary of t
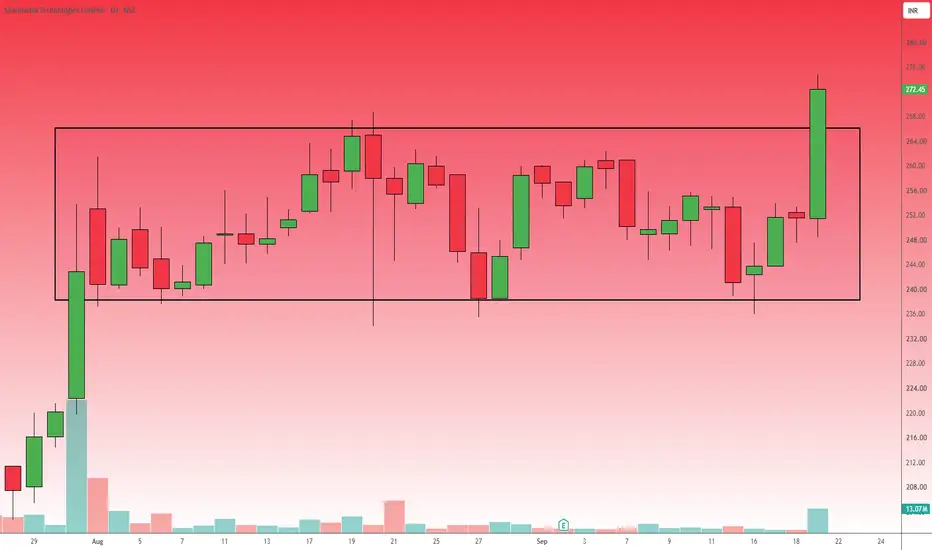
SHADOWFAX : Bullish Rectangle Breakout with Volume ConfirmationTrade Bias: Long
Chart Analysis:
As observed in Shadowfax Technologies has spent several weeks consolidating within a clear rectangular channel, bounded by support around 240.00 and resistance near 264.00.
The most recent daily price action demonstrates a definitive breakout above this resistance zone, printing a strong, full-bodied bullish candle that closed at 272.45 (+8.31%).
To satisfy the requirement of multiple technical confirmations, this pattern breakout is heavily supported by a ma