• Products
  • Community
  • Markets
  • Brokers
  • More
Get started
  • Markets
  • /World stocks
  • /Ideas
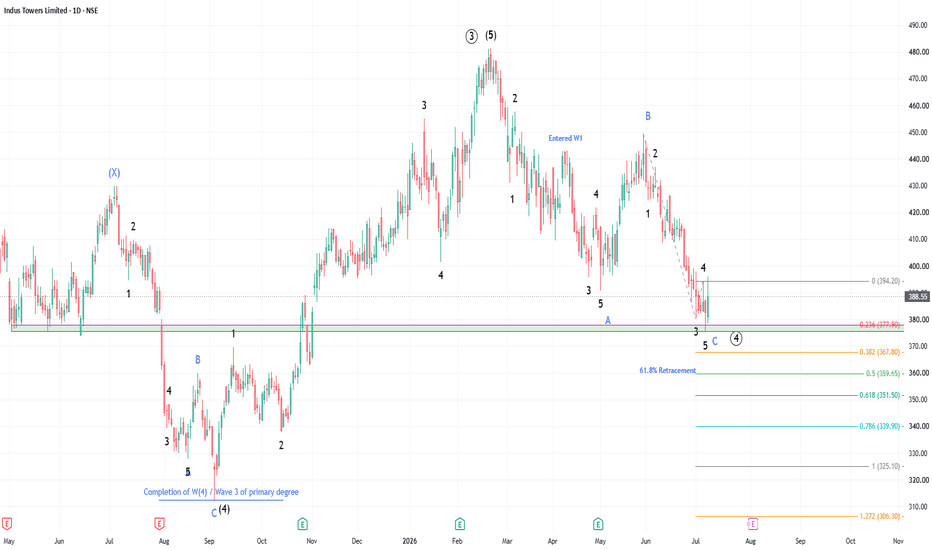
Indus Tower, Wave 4 of primary degree, Buy The last impulse of Indus Tower which commenced on 3 Sep 2025 is of Intermediary degree Wave (5) of Wave 3 of primary degree. The stock completed the said impulse wave on 19 Feb 2026 and ever since has been undergoing correction. The correction has been in the form of Zigzag which is a 5-3-5 structure. Wave A got completed on 4 May 2026 Wave B got completed on 29 May 2026 Wave 5/ Wave C most likely got completed at 23.6% of Wave 1-3 as given in the chart. Incidentally the stock has retraced 61.8% of the impulse wave. Normally Wave 4 of primary degree will have to be a larger correction. However, Wave (4) of intermediary degree of the said wave went in for a very long correction in the form of a WXY (double flat and one zigzag) over 216 days. Considering such a larger correction, one may expect that Wave 4 of primary degree may not have similar correction. One may consider going long on the stock with a stop loss of 365
NSE:INDUSTOWERLong
by ChartTheWave
Ixigo (Le Travenues Technology) – First Impulse Wave Completed Le Travenues Technology, better known as Ixigo, went public on 18 Jun 2024. Post listing, the stock entered a corrective phase, unfolding as a zigzag, which concluded on 4 Mar 2025. Since then, it has been advancing in a motive impulse wave. The first impulse wave now looks complete. Wave Structure: Waves 1 & 2 – Small and completed on 12 Mar 2025. Wave 3 – A powerful impulse, with extensions in all three actionary sub-waves (rare). Sub-wave 1 ≈ Sub-wave 3 (equality). Sub-wave 5 ≈ 78.6% of Sub-waves 1–3. Wave 5 – Peaked on 12 Sep 2025, completing at ~38.2% of the total length of Waves 1–3. With the first impulse complete, the stock has likely entered a corrective phase. Fresh entries may be avoided until the correction settles.
NSE:IXIGOShort
by ChartTheWave
Updated
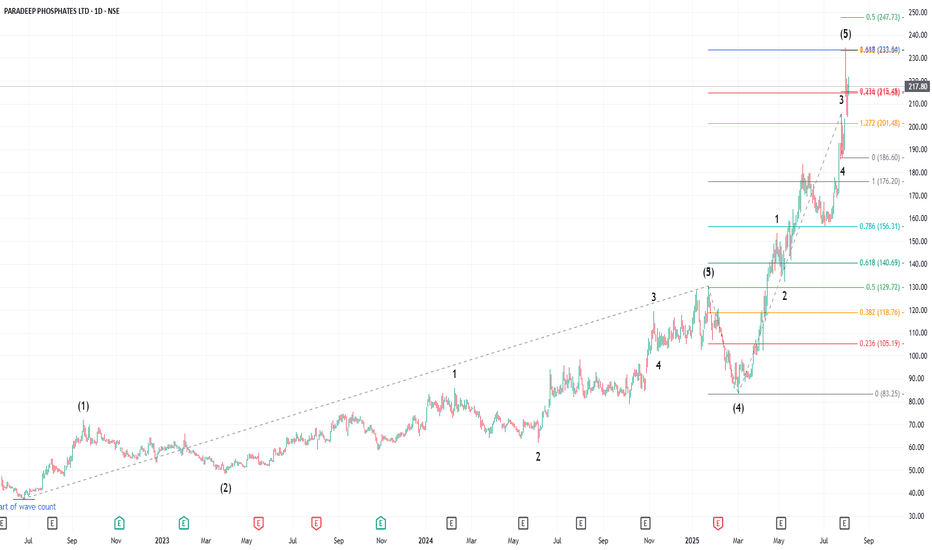
Paradeep Phosphates: Completion of Major Wave (5), Exit Paradeep Phosphates, part of the Microcap 250, has been a favourite among traders and investors alike. The recent rally has been spectacular—but there are clear signals that this leg may be over. Wave (4) was completed on March 3, 2025, after which the stock began forming Wave (5). This final leg saw a classic Wave (5) extension, with sub-wave (1) itself extending—a rare but powerful pattern in Elliott Wave Theory. From the low of Wave (4), the stock delivered over 180% returns in just 5 months. Why a Top May Be In The major wave 5 has now hit the 1.618 Fibonacci extension of wave 0–3 projected from wave 4. Simultaneously, sub-wave (5) of Wave 5 has also reached the 0.382 fibo extension of wave (0)–(3) to (4). These dual confluences at key fibo levels increase the probability that a significant top has been formed. No New Longs – Exit Advised This is not the time to initiate fresh long positions. Since the stock is not in the F&O segment, shorting is not an option either. Traders and investors are advised to exit and wait for a meaningful correction or a new setup to emerge.
NSE:PARADEEPShort
by ChartTheWave
Updated
1111
BUY TODAY SELL TOMORROW for 5% DON’T HAVE TIME TO MANAGE YOUR TRADES? - Take BTST trades at 3:25 pm every day - Try to exit by taking 4-7% profit of each trade - SL can also be maintained as closing below the low of the breakout candle Now, why do I prefer BTST over swing trades? The primary reason is that I have observed that 90% of the stocks give most of the movement in just 1-2 days and the rest of the time they either consolidate or fall Resistance breakout in SGMART BUY TODAY SELL TOMORROW for 5%
NSE:SGMART
by Kapil-Mittal
22
IntradayIntraday trading involves buying and selling financial instruments within the same trading session, with all positions closed before the market ends. Traders aim to take advantage of short-term price fluctuations using fast decision-making and technical analysis. Intraday trading is highly active and often relies on chart patterns, volume analysis, momentum indicators, and market news to identify quick trading opportunities.
NSE:BAJFINANCEEducation
32:23
by Knowledgehub
1313
Advanced Intraday TradingOptions Trading is a type of financial trading where investors buy or sell contracts that give them the right, but not the obligation, to purchase or sell an asset at a fixed price before a specific date. Traders use options to earn profits, hedge risks, or speculate on market movements. Common strategies include call options, put options, straddles, and spreads. Options trading can provide high returns, but it also carries significant risk because prices can change rapidly due to market volatility.
NSE:RELIANCEEducation
43:47
by Knowledgehub
66
ACUTAAS: Record Earnings Fuel SMC Breakout | Is ₹3,700 Next?Trade Plan Asset: ACUTAAS Setup: Bullish Continuation (Conditional) Entry: 3480–3490 after bullish confirmation SL: 3445 Targets: T1 3650 | T2 3725 ETA: Trigger 3–8 candles | T1 6–12 candles (~6–12h) | T2 12–20 candles (~12–20h) Invalidation: Hourly acceptance below 3480 (1H VAH) followed by a break below 3445 invalidates the continuation thesis. Score: 80/100 — ✅ Execute (only on pullback, not at current price) Narrative: The higher timeframe remains in a strong markup phase with intact HH/HL structure and no bearish structural failure. Price has broken decisively above the 4H value area, with acceptance above VAH (~3320) and sustained trading far above the 4H POC (~3130), confirming initiative buying and value migration. On the 1H chart, the marked demand zone around 3220–3300 generated a strong bullish displacement that cleared prior highs and pushed price above 1H VAH (~3485). This aligns with a Trend Expansion auction state. However, the current candle is a vertical breakout after an extended impulse, reducing immediate risk-reward for fresh entries. The preferred strategy is to wait for a pullback into 3480–3510, where a successful retest and renewed displacement would offer a higher-quality continuation entry toward 3650 and 3725. Chasing the current breakout is not recommended despite the bullish structure.
NSE:ACUTAASLong
by Passion-Trader
Updated
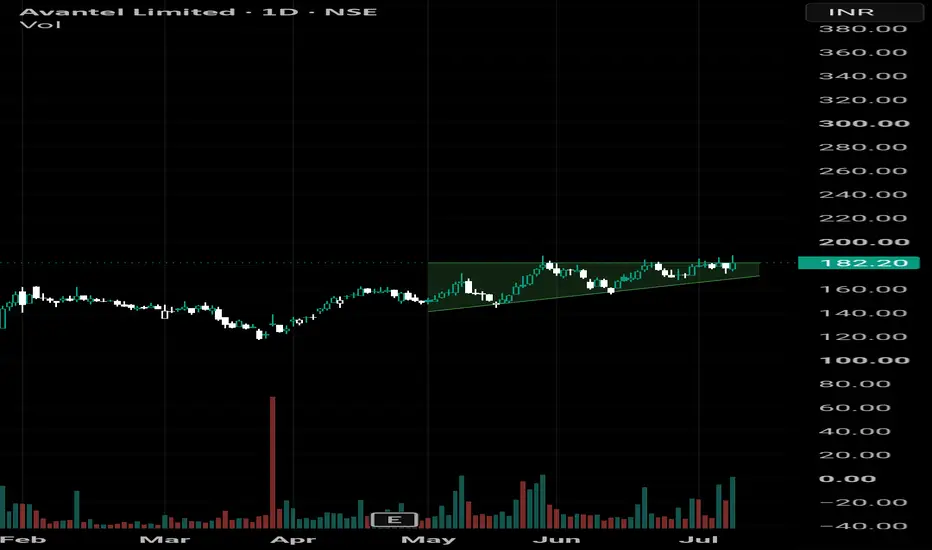
Something BIG is brewing in Avantel... Weeks of tight consolidation near the highs. Rising trendline still intact. 📈 Sellers are failing to push it lower. ⚡ A strong close above ₹185–188 with volume could trigger the next momentum move. Smart money watches price. Retail usually notices after the breakout. 😉 Is Avantel on your watchlist? 🚀 🚨 Not SEBI registered. This is for educational purposes only, not a buy/sell recommendation. #Avantel #Breakout #StocksToWatch
NSE:AVANTELLong
by StockEdgeCreate
J&KBANKJ&K bank has been a good 60% up since its breakout from 100 levels in end of Februrary. Good move with in the channel. Ichimoku cloud shows all positive indications of further up move but before a small correction would be healthy
NSE:J&KBANKLong
by steveatcfs
Aegis Logistics: Range Breakout Setup with Improving RSSetup: Trend Reversal / Range Breakout The Core Thesis Aegis Logistics appears to be transitioning from a prolonged corrective phase into a new uptrend. Following a strong recovery from the April lows, the stock has established a sequence of higher highs and higher lows while reclaiming all key moving averages. Relative Strength continues to improve, indicating sustained outperformance versus the broader market. The current setup represents a potential breakout from a multi-month trading range. Price is consolidating just below resistance after a strong advance, suggesting that the market is attempting to absorb overhead supply before the next directional move. Technical Observations Trend Structure: The stock has completed a trend reversal with higher highs and higher lows visible on the daily timeframe. Moving Average Alignment: Price is trading above the 10 EMA, 20 EMA and 50 EMA, with all moving averages turning higher. Relative Strength: The RS line continues to make new highs, indicating strong relative performance compared to the broader market. Constructive Pullback: The recent retracement from the ₹770 area was shallow and orderly, suggesting healthy profit-taking rather than distribution. Key Resistance: The ₹780–820 region represents a significant overhead supply zone and remains the primary obstacle for the bulls. Bullish Scenario A decisive breakout above the recent range with improving volume could trigger a move toward the upper supply zone. Successful absorption of overhead supply may open the path for a broader trend continuation. Risk Factors Presence of overhead supply between ₹780 and ₹820. Breakout attempts without volume confirmation may result in a false breakout. A breakdown below the recent higher low would weaken the current bullish structure. Trading Plan Entry Zone: ₹760–775 Support Zone: ₹735–740 Target 1: ₹800 Target 2: ₹820 Extended Target: ₹900 Conclusion Aegis Logistics is showing improving trend structure, strengthening relative strength and constructive price behaviour. While overhead supply remains a key challenge, the stock is positioned near the upper end of its range and may be worth monitoring for a breakout continuation setup. Disclaimer: This analysis is for educational purposes only and not investment advice. Always use appropriate risk management.
NSE:AEGISLOGLong
by Sudhi4488
Updated
SGFIN - showing strength SGFIN has shown a strong bullish move after a long consolidation phase and is currently holding well despite recent volatility near the 650 zone. The stock witnessed a sharp impulsive rally from the February-March base and successfully reclaimed key EMAs. Market structure has turned bullish with clear higher highs and higher lows. A few positive observations from the chart: • Strong bullish displacement from the base zone • Price sustaining above key EMAs • Controlled pullback after the rally • Buyers still defending short-term support After the sharp move towards 650, some profit booking appeared, which is normal after an extended rally. However, instead of a deep correction, the stock is consolidating near the highs while respecting the key EMAs. If price sustains this consolidation and gives a fresh breakout with strength, then there is probability of continuation towards higher levels. This type of impulsive move followed by healthy consolidation is often seen in momentum stocks before the next expansion phase. ✅ If you like my analysis, please follow me here as a token of appreciation :) in.tradingview.com/u/SatpalS/ 📌 For learning and educational purposes only, not a recommendation. Please consult your financial advisor before investing.
NSE:SGFIN
by SatpalS
Updated
Hyundai Motors – Impulse Wave Completed Since listing on 22 Oct 2024, Hyundai bottomed on 7 Apr 2025 and has since been forming its first impulse wave. It appears that the stock has completed its first impulse wave of minor degree with a Wave 1 extension. The wave structure suggests that - Wave 1 extension had sub-wave 1 extension (as per EWP, extended sub-waves behave similar to parent wave). Wave 3 = 78.6% of Wave 1 Wave 5 = 78.6% of Wave 3 Internal wave counts align with the extension scenario. In case of Wave 1 extensions, Waves 3–5 usually terminate within 0.618 – 1.414x of Wave 1. Recommendation: Investors who are long may consider exiting at current levels or trade with a strict trailing stop loss.
NSE:HYUNDAIShort
by ChartTheWave
Updated
11
FIEM Industries in Strong BiuZone?Overall Technical View * 🟢 **Long-term trend remains bullish**, as the stock is trading above its **50-DMA, 100-DMA, and 200-DMA**, indicating that the primary uptrend is intact. ( ) * 🟡 **Short-term momentum is neutral**, with the price consolidating around the 20-day moving average after a recent correction. ( ) * 🟡 **RSI is around 50**, suggesting neither overbought nor oversold conditions. ( ) * 🟢 **MACD remains positive**, indicating that the medium-term bullish structure is still intact. ( ) * 🟡 The stock is currently **range-bound**, and a breakout above resistance is needed for the next leg up. ( ) Important Support Levels * **₹2,235–2,240** – Immediate support. * **₹2,210–2,215** – Strong support. * **₹2,190** – Major positional support. ( ) Important Resistance Levels * **₹2,280–2,285** – Immediate resistance. * **₹2,300–2,305** – Breakout resistance. * **₹2,325–2,330** – Next resistance after breakout. ( ) Swing Trading Strategy (1–3 Months) * ✅ **Preferred Buy Zone:** ₹2,220–2,240. * ✅ **Alternative Entry:** Buy only after a **decisive close above ₹2,305** with higher-than-average volume. * 🛑 **Stop-loss:** ₹2,185 (positional). * 🎯 **Target 1:** ₹2,400. * 🎯 **Target 2:** ₹2,500. * 🎯 **Target 3:** ₹2,600 (if momentum remains strong). Risk–Reward * **Risk:** ~3–4%. * **Potential Upside:** ~10–15%. * **Risk–Reward Ratio:** Approximately **1:3**, which is attractive for swing traders if the entry is near support. Suggestions * ✔️ **Do not chase the stock** near resistance. * ✔️ Buy near **₹2,220–2,240** if a bullish reversal forms. * ✔️ If the stock breaks above **₹2,305** with strong volume, it can signal the start of a fresh uptrend. * ✔️ If it falls below **₹2,185**, avoid averaging immediately and wait for a new base to form. * ✔️ Position size should be limited to **5–7% of your portfolio**, as FIEM is a mid-cap auto ancillary stock. Technical Rating * **Trend:** ⭐⭐⭐⭐☆ * **Momentum:** ⭐⭐⭐☆☆ * **Breakout Potential:** ⭐⭐⭐⭐☆ * **Swing Trade Probability (1–3 months):** **70–75%**, provided the stock holds above **₹2,210** and the broader market remains supportive.
NSE:FIEMIND
by shanmurali
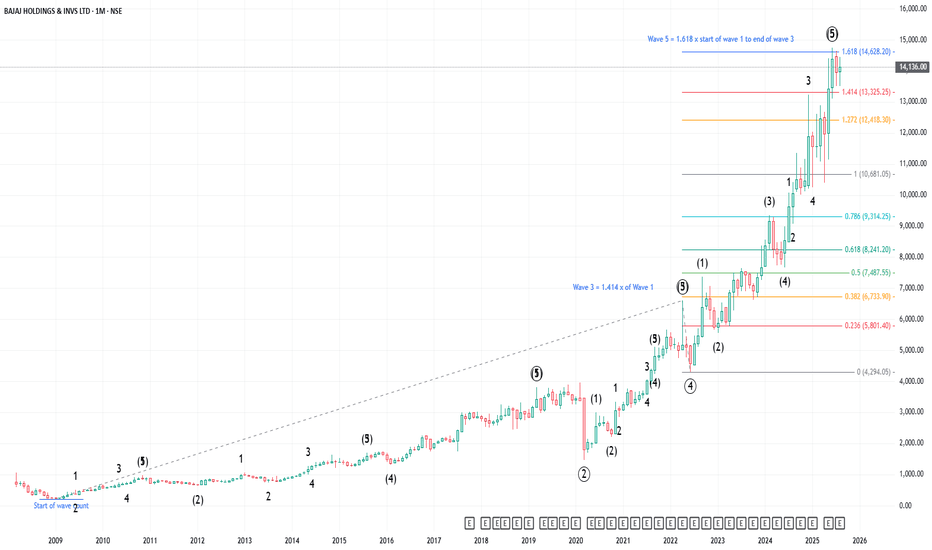
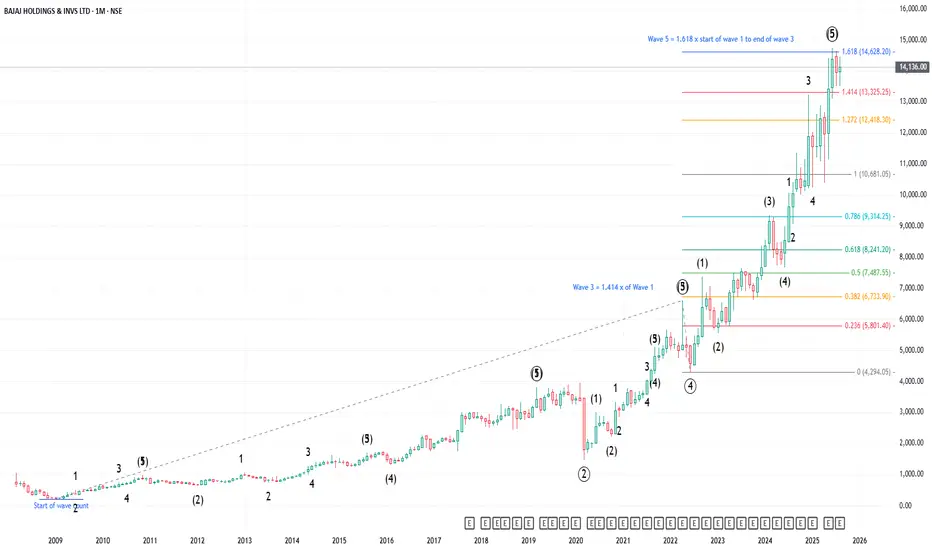
Bajaj Holdings – End of Wave V: Time to Exit? Timeframe: Monthly Chart Bajaj Holdings appears to have completed a larger-degree Wave V, forming a 5th wave extension. Under Elliott Wave Principle, when Wave 5 is the longest, it typically extends 1.618 times the distance from Wave 1’s start to Wave 3’s end. In this case, Wave 5 has indeed traveled 1.618x of that measure, while Wave 3 extended 1.414x of Wave 1. Further internal wave counts align well with this structure, strengthening the case for a completed cycle. Conclusion: The larger 5-wave sequence looks complete. Investors and traders may consider exiting positions at this stage.
NSE:BAJAJHLDNGShort
by ChartTheWave
Updated
22
The Leela palaces, swing ideaStrong breakout with volumes on chart.Retest done. Looks good for a swing trade with stop loss of 465.
NSE:THELEELALong
by VinitaNaiduAndra
TCS, Investment ideaIT sector is at most favourable risk reward ratio. TCS has taken support at 2k levels. It can be added to long term portfolio with potential targets of 3200, 3600 and 4k. Add to the position when chart starts making higher highs.
NSE:TCSLong
by VinitaNaiduAndra
33
Thyrocare , long viewMore than six months of consolidation, base conformation, expecting a breakout. Healthcare sector has given breakout. Long trade can be initiated.
NSE:THYROCARELong
by VinitaNaiduAndra
Updated
Edelweiss financial services, investment ideaTurnaround on charts after breaking 60 levels. After breakout, retested levels of 60-62. Bounced with good volumes from support. Can enter in dips for longterm targets of 115 and 180.
NSE:EDELWEISSLong
by VinitaNaiduAndra
Updated
Sterlite Technologies, currently at support on monthly chartsWith chart showing turn around,took support of 110 levels on monthly and quaterly charts. A good volume candle on monthly should be good for entry with targets 0f 200 and 260 with an investment point of view.
NSE:STLTECHLong
by VinitaNaiduAndra
Updated
HFCL, long, short termHFCL looks good for taking long position from here @84.7, base breakout with volume. A short term trade with stop of 81 can be taken
NSE:HFCLLong
by VinitaNaiduAndra
Updated
11
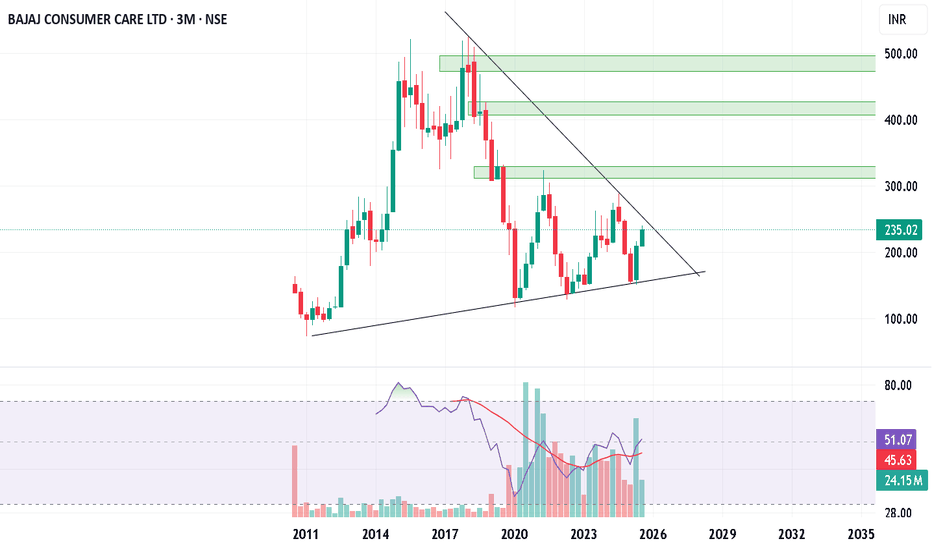
Bajaj Consumer Care, 3M, longBajaj consumer looks good for investment, recent volumes and price action supports its long position. To reduce risk, add after trendline line breakout on quaterly. Add more at 170 or above 280.
NSE:BAJAJCONLong
by VinitaNaiduAndra
Updated
Anantraj,1W, looks good for upside.Chart looks good for trendline breakout with good volumes with potential targets of 600,700.
NSE:ANANTRAJLong
by VinitaNaiduAndra
BUY TODAY SELL TOMORROW for 5%DON’T HAVE TIME TO MANAGE YOUR TRADES? - Take BTST trades at 3:25 pm every day - Try to exit by taking 4-7% profit of each trade - SL can also be maintained as closing below the low of the breakout candle Now, why do I prefer BTST over swing trades? The primary reason is that I have observed that 90% of the stocks give most of the movement in just 1-2 days and the rest of the time they either consolidate or fall Consolidation breakout in ZSARACOM BUY TODAY SELL TOMORROW for 5%
NSE:ZSARACOM
by Kapil-Mittal
Updated
22
112233445566778899101011111212131314141515161617171818191920202121222223232424252526262727282829293030313132323333343435353636373738383939404041414242
…999999

Made by humans

Select market data provided by ICE Data Services. Select reference data provided by FactSet. Copyright © 2026 FactSet Research Systems Inc.Copyright © 2026, American Bankers Association. CUSIP Database provided by FactSet Research Systems Inc. All rights reserved. SEC filings and other documents provided by Quartr.© 2026 TradingView, Inc.

More than a product
  • Supercharts
Screeners
  • Stocks
  • ETFs
  • Bonds
  • Crypto coins
  • CEX pairs
  • DEX pairs
  • Pine
Heatmaps
  • Stocks
  • ETFs
  • Crypto coins
Calendars
  • Economic
  • Earnings
  • Dividends
  • IPOs
More products
  • News Flow
  • Portfolios
  • Fundamental Graphs
  • Yield Curves
  • Options
  • Macro Maps
  • Pine Script®
Apps
  • Mobile
  • Desktop
Community
  • Social network
  • Wall of Love
  • Refer a friend
  • House Rules
  • Moderators
Ideas
  • Trading
  • Education
  • Editors' picks
Pine Script
  • Indicators & strategies
  • Wizards
  • Freelancers
  • Paid Spaces
Tools & subscriptions
  • Features
  • Pricing
  • Market data
  • Gift plans
Trading
  • Overview
  • Brokers
  • Brokers comparison
  • The Leap
Special offers
  • CME Group futures
  • Eurex futures
  • US stocks bundle
About company
  • Who we are
  • Space mission
  • Blog
  • Help Center
  • Careers
  • Media kit
Merch
  • TradingView store
  • Tarot cards for traders
  • The C63 TradeTime
Policies & security
  • Terms of Use
  • Disclaimer
  • Privacy Policy
  • Cookies Policy
  • Accessibility Statement
  • Security tips
  • Bug Bounty program
  • Status page
Business solutions
  • Widgets
  • Charting libraries
  • Lightweight Charts™
  • Advanced Charts
  • Trading Platform
Growth opportunities
  • Advertising
  • Brokerage integration
  • Partner program
  • Education program
Community
  • Social network
  • Wall of Love
  • Refer a friend
  • House Rules
  • Moderators
Ideas
  • Trading
  • Education
  • Editors' picks
Pine Script
  • Indicators & strategies
  • Wizards
  • Freelancers
  • Paid Spaces
Business solutions
  • Widgets
  • Charting libraries
  • Lightweight Charts™
  • Advanced Charts
  • Trading Platform
Growth opportunities
  • Advertising
  • Brokerage integration
  • Partner program
  • Education program
Look FirstLook First