Long
Long
 Long
Long
 Long
Long
 Long
Long
 Long
Long
RBL Bank Ltd. Supertrend Breakout & Momentum Swing SetupThe daily chart for RBL Bank Ltd. highlights a classic pullback-and-resume structure. Following a brief correction that found a floor near ₹357, the price is aggressively turning around to challenge overhead resistance, backed by a significant surge in shorter-term momentum.
1. Williams %R Analysis (The Momentum Trigger)
The Williams %R (140) indicator is currently printing at -9.58, placing it firmly inside the "overbought" zone (between 0 and -20).
Behavior Above -20: In momentum trading, when Williams %R crosses above the -20 threshold from below, it indicates that the asset is trading very close to its highest high over the lookback period (140 periods here). Rather than a sign to short, this reflects extreme bullish strength and an acceleration of buying velocity.
Price Action Real-World Alignment: As seen on the chart around Thursday, July 2, 2026, the stock put in a sharp bullish reversal candle. The subsequent push of the Williams %R past -20 directly aligns with the price breaking above the Previous Week High Breakout level (₹371.50). When Williams %R pins itself near the top (closer to 0), it acts as a green light that momentum is strong enough to fuel a sustainable breakout.
2. Supertrend Breakout Analysis (July 2, 2026)
On July 2, 2026, RBL Bank established a critical swing low right around the structural support floor of ₹357.93.
The Resistance Barrier: The Supertrend (7, 2) is currently tracking a bearish overhead resistance line at ₹379.42.
Breakout Catalyst: The chart identifies a Supertrend Breakout level at ₹378.75. If the current bullish daily expansion continues and clears this ₹378.75–₹379.42 zone, it will force the Supertrend indicator to flip from red to green. This change of character acts as a mechanical confirmation for positional and swing traders, often triggering a secondary wave of institutional buying.
Breakout Trigger Entry: ₹378.75 – ₹379.42 Momentum confirmation entry (on a daily close above the Supertrend).
Stop Loss (SL): ₹357.93 Placed safely right below the July 2 structural swing low.
Target 1 (T1): ₹389.10 Immediate overhead structural resistance.
Target 2 (T2): ₹398.20 Full target mapping representing a 9.20% price expansion.
Disclaimer: aliceblueonline.com Eternal Limited – Weekly Breakout Swing Trade SetupThe weekly chart for Eternal Limited shows a powerful structural trend shift and momentum acceleration, making it an ideal candidate for a swing trading setup. The stock has broken through a significant resistance level, opening the door for an extension rally.
Technical Observations
Trend Shift & Moving Averages: The chart notes a "Trend Shift Confirmation from Super Trend," indicating that the higher-timeframe trajectory has officially turned bullish. The stock is currently trading well above its key Moving Averages (MMA 30: 258.62, MMA 50: 281.80, MMA 100: 266.45), which will now act as dynamic layers of support.
Breakout Structure: The current weekly candle has surged past the Previous Week High (Break-Out Entry) line, marking a definitive close above prior near-term resistance at ₹288.35.
Momentum: The Daily Williams %R is sitting at -21.05 and angling upward. As highlighted on the chart ("Daily Williams %R at -21 | Momentum is about to surge"), it is entering the high-velocity bullish zone, indicating that the upward move is backed by strong buying pressure.
Entry Price,₹288.35,Triggered on the decisive break above the previous week's high.
Stop Loss (SL),₹281.80,Placed right at the major structural support line (aligning with the MMA 50).
Target 1 (T1),₹308.55,First overhead resistance hurdle.
Target 2 (T2),₹335.65,Intermediate swing target.
Target 3 (T3),₹368.45,Full structural extension target.
Disclaimer: aliceblueonline.com Bajaj Auto: Structural Trend Reversal (CHoC)1. Trend Structural Shift (Change of Character)
Previous Weeks (Bearish): During Week 1 (W1) and Week 2 (Jun W2), the stock was under clear selling pressure, marked by a -4.33% and -4.25% downtrend respectively.
The Pivot (Jun W3): In the third week of June, the stock found a floor and printed a Change of Character (CHoC), recovering by -2.79% from its absolute swing lows. This indicates that the aggressive selling pressure has dried up and buyers are stepping in to accumulate.
Current Week (Jun W4 - Expected Bullish): The chart shows a strong projected upward trend of +4.30%, indicating a shift from a "sell on rallies" to a "buy on dips" environment.
2. Key Indicator & Price Action Levels
Supertrend: The Supertrend indicator (7, 5) is hovering at 9,952.56, acting as a major macro-level support line well below the current market price.
Current Price (CMP): The stock is currently trading around 10,176.00, up +1.09% during the session. It is consolidating just below a critical breakout trigger point.
Entry Trigger Above 10,210.00
Stop Loss (SL) 10,088.00
Target 1 (T1) 10,293.50
Target 2 (T2) 10,383.30
Target 3 (T3) 10,497.00
The Strategy: Avoid entering prematurely at the current price of 10,176.00. The area between 10,130 and 10,210 is a minor supply pocket. Entering strictly above 10,210 ensures you are riding the actual breakout volume.
Risk/Reward Check: If entered at 10,210 with a stop at 10,088, your risk is ~122 points. Achieving Target 3 (10,497) offers a reward of ~287 points, representing a healthy 1:2.35 Risk-to-Reward ratio.
Disclaimer: aliceblueonline.com TITAN – Swing Trading Analysis & SetupWeekly chart for Titan Company Limited (TITAN) highlights a highly structured, text-book bullish reversal and expansion pattern. This technical layout is reinforced fundamentally by Titan’s recent Q1 FY27 business update, which reported a staggering 41% YoY growth in its consumer businesses, driven by robust domestic festival demand and a massive 128% surge in international markets.
Here is the comprehensive technical analysis and a swing trading game plan based on the chart.
Technical Observations
Market Structure Evolution: * Change of Character (ChoCh): The chart illustrates a clear shift in market structure from a bearish/corrective phase to a bullish one as the stock formed a solid structural base between late 2024 and mid-2025 (Smart Money Accumulation).
Break of Structure (BOS): Following a period of steady upward movement (Retail Participation), the stock formed a secondary consolidation box. The current weekly candle shows a powerful Break of Structure (BOS) above this box, closing decisively higher at ₹4,629.80.
Trend & Momentum Indicators:
Supertrend (7, 2): Remains firmly bullish, giving a strong trailing support floor down at ₹4,075.19.
Williams %R (140): Printing at an extreme -1.50, indicating maximum bullish momentum. The oscillator is completely pinned to the top of its range, confirming that buyers are in absolute control during this breakout phase.
Swing Trading Idea
With the fundamental tailwind of explosive 41% revenue growth and a clean weekly structural breakout, the bias is strictly on the long side.
Entry Range,"₹4,550 – ₹4,630",Entering near current market price or on minor intra-week dips back toward the breakout line.
Stop Loss (SL),"₹4,180 (On a weekly closing basis)",Placed comfortably below the lower boundary of the recent BOS consolidation box.
Primary Target (T1),"₹5,099.20",The precise structural Full Target mapped out on the chart.
Since this is a Weekly (1W) chart setup, the time horizon for this swing trade should be roughly 4 to 12 weeks. Avoid over-leveraging on the daily fluctuations, as weekly breakouts require room to breathe. Maintain position sizing that respects the distance to the structural stop loss.
Disclaimer: aliceblueonline.com GLENMARK – Swing Trading Chart AnalysisBased on the daily chart, the stock has recently broken out of a consolidation phase, triggering a bullish setup for a swing trade. Here is a detailed breakdown of the technical indicators and structure.
1. Market Structure & Price Action
Consolidation & Breakout: After a corrective phase through late May and June, the stock entered a tight rectangular Consolidation Box roughly between ₹2,220 and ₹2,320. The most recent daily candle has forcefully broken out to the upside of this range, clearing a key resistance level.
Trend Change: The text on the chart notes a "Weekly Resistance break with ST change," suggesting that this breakout aligns with a larger-scale trend reversal on higher timeframes.
2. Key Technical Indicators
Supertrend: The Supertrend indicator (7, 2) is currently green and sitting at ₹2,166.36, confirming that the medium-term daily trend has turned bullish.
Williams %R (140): The oscillator is printing at -30.47 and curving upwards. It is moving out of the lower/neutral zone toward the overbought territory, indicating strong accelerating bullish momentum without being dangerously overextended just yet.
3. Swing Trading Action Plan
Entry Zone: Current market price (~₹2,281) up to the recent breakout point.
Stop Loss (SL): ₹2,222 (placed just below the consolidation box support and the recent swing low to protect against a false breakout).
Target 1 (T1): ₹2,356.50 (Immediate resistance/previous minor swing high)
Target 2 (T2): ₹2,474.00 (Major psychological and structural resistance)
Target 3 (T3): ₹2,539.20 (Peak resistance from the April/May highs)
Swing Perspective: The risk-to-reward ratio looks favorable here, especially if aiming for T2 or T3.
Watch for a retest of the ₹2,265–₹2,270 zone on lower volumes for an even safer entry, provided the ₹2,222 level holds on a daily closing basis.
Disclaimer: aliceblueonline.com  Long
Long
 Long
Long
Resistance Breakout in ADANIENSOLThe stock had been trading inside a broad range, with support near ₹1,465 and resistance around ₹1,595–₹1,600. After several unsuccessful attempts to cross this resistance, the price has now moved above it with a strong bullish candle.
The latest candle closed at approximately ₹1,622.80, suggesting that buyers have gained control and the previous resistance may now act as support.
Right Panel: Trade Setup
The right chart highlights the possible levels for the breakout trade:
Entry/confirmation: Above ₹1,631.60
Target: ₹1,660.75
Stop-loss: ₹1,584.75
The bullish setup remains valid only if the stock sustains above the breakout zone. A fall back below the resistance level may indicate a failed breakout.
Chart pattern: Horizontal Resistance Breakout
Timeframe: Daily
Bias: Bullish above the breakout zone Axis Bank Technical Levels & AnalysisBased on the latest technical data and recent price action, Axis Bank remains in a mild bullish trend, trading above its major moving averages with RSI around the neutral-to-bullish zone.
📈 Key Resistance Levels
R1: ₹1,372–1,375
R2: ₹1,385–1,390
R3: ₹1,415–1,420 (52-week high zone)
📉 Key Support Levels
S1: ₹1,355
S2: ₹1,335–1,340
Strong Support: ₹1,305–1,315
Trading View
✅ Bullish Scenario
Sustaining above ₹1,375 can trigger a move towards ₹1,390, followed by ₹1,420.
⚠️ Bearish Scenario
If the stock falls below ₹1,355, it may retest ₹1,335.
A breakdown below ₹1,335 could extend the correction towards ₹1,305.
Trend Summary
Trend: Bullish
Momentum: Positive
Strategy: Buy on dips near support with confirmation; avoid fresh entries near resistance unless a breakout is confirmed. Bharti AirtelSwing Trading Analysis
Trend: Bullish above ₹1,900
Key Support Zones
S1: ₹1,900–1,905
S2: ₹1,875–1,885
Strong Support: ₹1,855–1,860
Key Resistance Zones
R1: ₹1,935–1,940
R2: ₹1,960–1,980
Major Resistance: ₹2,000–2,020
Trading Plan
Bullish Setup
Buy on a sustained breakout above ₹1,940
Targets: ₹1,980 → ₹2,020 → ₹2,080
Stop Loss: ₹1,900
Bearish Setup
If the stock closes below ₹1,900, it may correct toward ₹1,875 and then ₹1,855.
Technical View
Price is holding above important short-term moving averages, indicating improving momentum.
Momentum indicators are broadly neutral-to-positive, suggesting room for another leg higher if resistance near ₹1,940 is broken. Larsen & ToubroTrend
Trend: Bearish
Structure: Lower Highs + Lower Lows
Momentum: Strong selling pressure after the breakdown below 4,040.
Current Price
CMP: ₹3,990
Support Levels
Level Strength View
S1: ₹4,000 Broken Now immediate resistance
S2: ₹3,980 Strong Intraday support
S3: ₹3,950 Very Strong Demand zone
S4: ₹3,900 Major Swing support
Resistance Levels
Level Strength View
R1: ₹4,020–4,040 Immediate Breakdown zone
R2: ₹4,080–4,100 Strong Supply zone
R3: ₹4,175 Major Previous swing resistance
R4: ₹4,240 Very Strong Trend reversal level
Trading Setup
Bearish Scenario
Below ₹4,000 → Bearish
Targets:
₹3,980
₹3,950
₹3,900
Bullish Recovery
Only if price closes above:
₹4,040
Then targets:
₹4,080
₹4,100
₹4,175
Intraday Bias
✅ Above ₹4,040 → Bullish
⚠️ Between ₹4,000–4,040 → Range-bound
❌ Below ₹4,000 → Strong Bearish
Price Action Observation
Large bearish candle indicates institutional selling.
Previous support at ₹4,000 has been broken.
Until ₹4,040 is reclaimed on strong volume, sellers remain in control.
Watch for buying interest around ₹3,950; a failure there could open the path toward ₹3,900.
Key Levels Summary
Resistance: ₹4,040 → ₹4,100 → ₹4,175 → ₹4,240
Support: ₹3,980 → ₹3,950 → ₹3,900
Overall Bias: Bearish unless the stock reclaims and sustains above ₹4,040 on the 1-hour timeframe. Tata Consultancy ServicesTata Consultancy Services (TCS) is currently trading in a weak-to-neutral trend after a sharp correction. The IT sector remains under pressure ahead of the company's quarterly earnings announcement on 9 July, so volatility is likely to increase this week.
Key Technical Levels
Level Price Zone Importance
Strong Resistance ₹2,145–2,170 Trend reversal zone
Resistance ₹2,085–2,100 Sellers likely to emerge
Pivot ₹2,050–2,055 Directional level
Support ₹2,000–2,010 First buying zone
Strong Support ₹1,950–1,960 Breakdown support
Major Support ₹1,880–1,930 Long-term demand zone
Trading View
🟢 Bullish Scenario
Sustained move above ₹2,055 improves momentum.
Break above ₹2,100 can open the way toward ₹2,145–2,170.
🔴 Bearish Scenario
Failure to hold ₹2,000 could lead to ₹1,950.
If ₹1,950 also breaks, the next downside zone is around ₹1,880–1,930.
Momentum View
Trend: Bearish to Neutral
RSI: Around 43 (neutral, not oversold)
MACD: Bearish
Buyers need a strong breakout above resistance to regain control.
Swing Trading Plan
Buy only if
Price closes above ₹2,055–2,100 with strong volume.
Sell/Short opportunity
If price rejects ₹2,085–2,100 or breaks below ₹2,000.
Important Event This Week
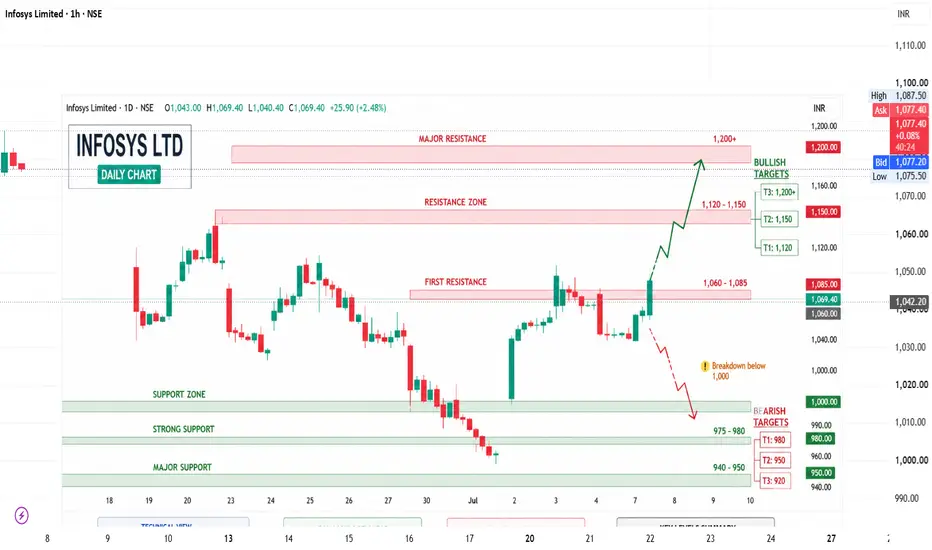
TCS is scheduled to announce its quarterly results on 9 July, making the stock susceptible to gap-up or gap-down moves depending on earnings and management commentary. InfosysTechnical Levels (Current Zone: ~₹1,040)
Major Resistance
₹1,060–1,085 (first supply zone)
₹1,120–1,150 (strong resistance)
₹1,200+ (trend reversal confirmation)
Major Support
₹1,000 (psychological support)
₹975–980 (strong buying zone)
₹940–950 (major positional support)
Trading Plan
Bullish Scenario
Buy only if the stock closes above ₹1,085 with strong volume.
Upside targets:
₹1,120
₹1,150
₹1,200
Stop-loss: ₹1,045
Bearish Scenario
If Infosys closes below ₹1,000, weakness may extend towards:
₹980
₹950
₹920
Stop-loss for short trades: ₹1,030
Technical View
Trend: Bearish to Neutral
Momentum: Weak, but approaching an important support zone.
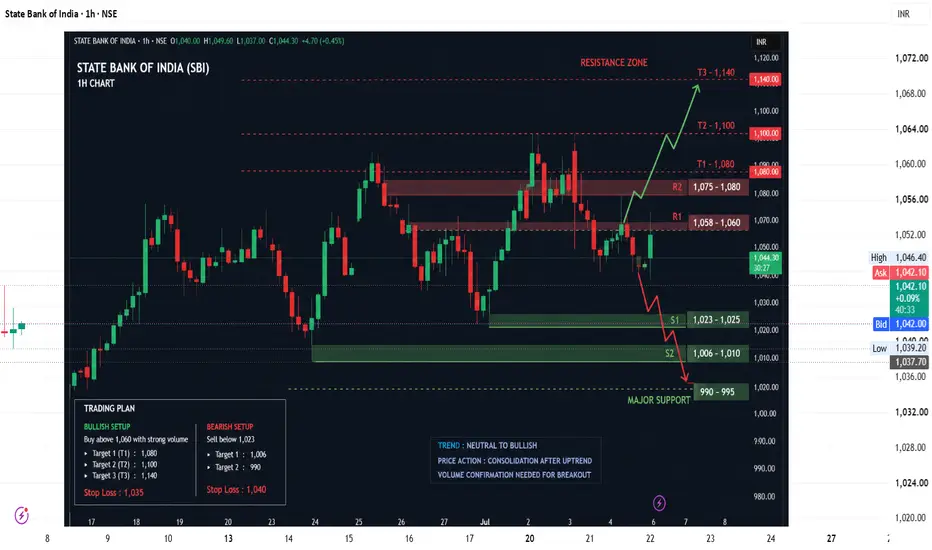
Best strategy: Wait for either a breakout above ₹1,085 or a reversal signal near ₹980–1,000 before taking fresh positions. Current technical indicators remain cautious. State Bank of India Technical AnalysisSBI is currently trading around the ₹1,035–1,040 zone after a recent pullback from higher levels. The stock remains in a medium-term uptrend, but it is consolidating near an important support area. A decisive move above resistance could restart the bullish trend, while a break below support may trigger further profit booking.
📈 Key Support Levels
S1: ₹1,023–1,025
S2: ₹1,006–1,010
Major Support: ₹990–995
📉 Key Resistance Levels
R1: ₹1,058–1,060
R2: ₹1,075–1,080
Major Breakout: ₹1,100–1,110
Trading Plan
Bullish Setup
Buy only if SBI closes above ₹1,060 with strong volume.
Upside targets:
🎯 ₹1,080
🎯 ₹1,100
🎯 ₹1,140
Stop-loss: ₹1,035
Bearish Setup
If SBI closes below ₹1,023, selling pressure may increase.
Downside targets:
🎯 ₹1,006
🎯 ₹990
Stop-loss for shorts: ₹1,040.
Technical View
Trend: Neutral to Bullish
Momentum: Consolidation after an uptrend
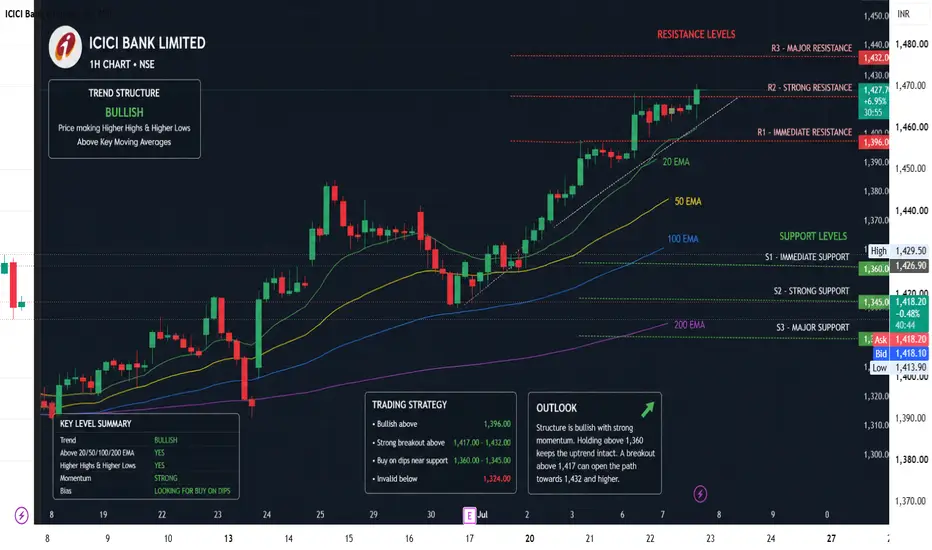
Volume Confirmation: Watch for a breakout above ₹1,060 with above-average volume before initiating fresh longs. ICICI BANK🔴 Resistance Levels
Level Significance
₹1,432–1,435 Immediate breakout zone
₹1,440 Psychological resistance
₹1,450 Swing target
₹1,468–1,475 Extended target if momentum continues
🟢 Support Levels
Level Significance
₹1,423–1,425 Immediate intraday support
₹1,417–1,420 Strong support (previous breakout)
₹1,405–1,410 Demand zone
₹1,390–1,395 Major swing support
₹1,360 Trend invalidation zone
Market Structure
✅ Higher Highs & Higher Lows
✅ Strong bullish momentum
✅ Price above all major moving averages
✅ Healthy consolidation after breakout
No bearish reversal signal yet.
Trading Plan
Buy Above
₹1,432
Targets
🎯 ₹1,440
🎯 ₹1,450
🎯 ₹1,468
Stop Loss
₹1,417
Buy on Dip
Accumulate near:
₹1,423–1,425
₹1,417–1,420
SL: ₹1,405
Bearish Scenario
If price closes below ₹1,417, expect a pullback towards:
₹1,405
₹1,395
₹1,380
A close below ₹1,360 would weaken the overall bullish trend.
Professional Outlook
Bias: 🟢 Bullish
Momentum remains strong.
Consolidation below ₹1,432 appears constructive.
A breakout above ₹1,432–1,435 with strong volume can trigger the next leg higher toward ₹1,450–1,470.
As long as ₹1,417 holds, buyers remain in contro