PNB Housing Finance — A Pattern 9 Years in the MakingGuys, I've been watching this one for a long time now and the chart is finally reaching the moment we've been waiting for.
Look at the bigger picture — stock peaked at 1,400 back in 2018, crashed all the way to 119, and since then it's been slowly building back up. And over all these years a massive symmetrical triangle has been forming on the weekly chart. Lower highs from the top, higher lows from the bottom, both lines converging — and right now price is sitting right at the upper trendline of that triangle.
This is the critical zone. Nine years of price action has led to this point.
A strong weekly close above 1,150 and this stock enters fresh territory with virtually no overhead resistance. The measured move from a structure this big projects well above the 2018 highs. That's the kind of trade that doesn't come often.
For those already holding — just sit tight. Don't overthink it, don't get shaken by daily noise. Weekly chart, weekly mindset.
For those watching — a clean breakout with volume is your trigger. Don't jump the gun, let it confirm first.
SL for existing positions: 800 on weekly closing basis.
Patience built this setup over 9 years. Don't ruin it by being impatient in the last mile.  Long
Long
 Long
Long
 Long
Long
 Long
Long
 Long
Long
 Long
Long
 Short
Short
HERO MOTOCORP – Multi-Timeframe Technical Analysis Daily+Weekly
Hero MotoCorp is displaying strong multi-timeframe bullish signals. The combination of a hammer pattern on the daily chart, a bullish reversal candle on the weekly chart, and high-volume buying near long-term support suggests that the correction may be ending. A decisive breakout above ₹5,325 would strengthen the bullish case and could pave the way for a move towards ₹5,525–₹5,715, with ₹6,380 as the longer-term target. Until then, the stock remains in a recovery phase with a positive bias.
This chart becomes more bullish because it combines daily and weekly reversal signals. The stock has formed a strong base near long-term support and is showing early signs of a trend reversal.
1. Long-Term Downtrend
Hero MotoCorp corrected from its peak near ₹6,380 (red arrow).
The declining trendline highlights a series of lower highs, confirming the prolonged downtrend.
The pace of the decline has gradually slowed, indicating weakening selling pressure.
Interpretation: The long-term correction appears to be nearing completion.
2. Hammer Candlestick at Major Support
The stock formed a Hammer candlestick near ₹4,482, which coincides with a previous swing low.
Why it is important:
Buyers absorbed heavy selling near support.
The long lower shadow reflects strong demand at lower levels.
The hammer was accompanied by significantly higher trading volume, improving the reliability of the reversal.
Interpretation: This suggests institutional accumulation and the possibility of a medium-term bottom.
3. Weekly Chart Confirmation
An additional positive factor is that the weekly chart has also formed a bullish reversal candle.
This increases the probability of a sustained uptrend because:
Weekly signals are generally more reliable than daily signals.
A reversal occurring simultaneously on both timeframes often attracts positional investors.
Multi-timeframe confirmation strengthens the overall bullish outlook.
4. Recovery from Support
Following the hammer pattern:
The stock has rebounded from ₹4,482 to around ₹5,000.
Recent candles show higher lows, indicating improving buying momentum.
Momentum remains positive as long as the stock stays above the recent support zone.
Trading Strategy
✅ Bullish Scenario
If Hero MotoCorp closes above ₹5,325 with strong volume:
Upside Targets
₹5,325
₹5,525
₹5,715
₹6,380 (long-term)
⚠️ Bearish Scenario
If the stock fails to hold recent support:
Support Levels
₹4,850
₹4,673
₹4,482 (major support)
A close below ₹4,482 would invalidate the bullish reversal setup.
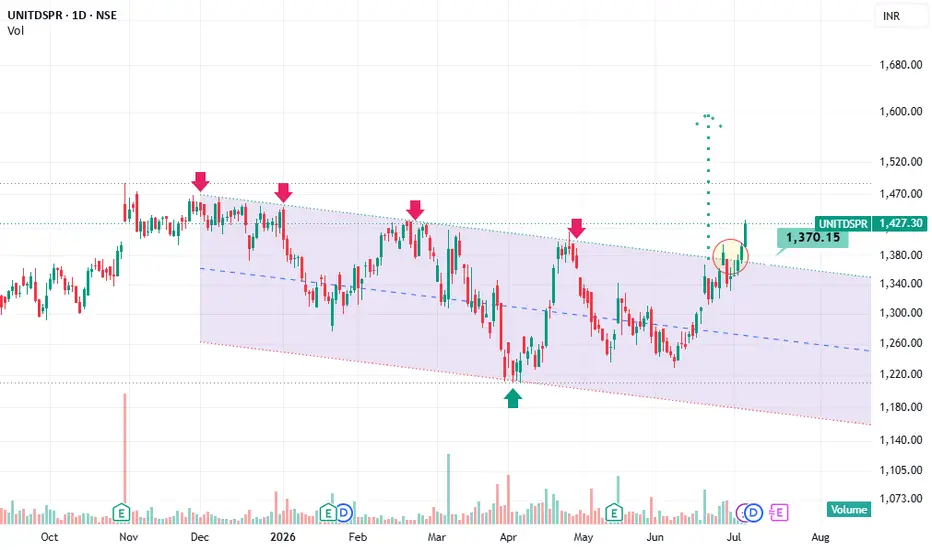
UNITDSPR – Daily Chart AnalysisTrend: Improving (still inside a falling channel until breakout)
Momentum: Bullish
Pattern: Falling Channel Breakout Attempt
Action: Watch for a decisive daily close above ₹1,380–1,390 with above-average volume. A confirmed breakout could signal the start of a new uptrend, while rejection at this level may lead to a short-term pullback before another attempt.
The chart shows that the stock has been trading inside a falling channel for several months and is now attempting to break above the upper trendline.
Key Observations
1. Falling Channel Formation (Bearish Structure)
The stock has been making lower highs and lower lows since November.
The pink arrows indicate multiple rejections from the upper resistance line.
The green arrow marks the channel support, where buyers stepped in and reversed the trend.
Interpretation: The long-term downtrend is losing momentum as buyers are becoming more aggressive.
2. Strong Recovery from Support
After touching around ₹1,200, the stock rallied sharply.
Price has moved above the channel's midline with strong bullish candles.
This indicates improving momentum.
3. Current Resistance Zone (Circled Area)
The circled candle is testing the upper boundary of the channel near ₹1,370–1,385.
This is an important level because:
Previous rallies have failed here.
Sellers have repeatedly entered at this trendline.
4. Volume Analysis
Volume has increased during the recent rally.
Higher volume near resistance suggests strong participation.
However, confirmation is needed through a breakout.
Possible Scenarios
✅ Bullish Scenario
If the stock closes above ₹1,380–1,390 with strong volume:
Falling channel breakout will be confirmed.
Fresh buying momentum may emerge.
Possible targets:
₹1,470
₹1,550
₹1,600 (marked by the dotted projection)
⚠️ Bearish Scenario
If the stock fails to break the trendline:
Profit booking may occur.
Price could retrace towards:
₹1,340
₹1,300
Channel midline support
 Long
Long
 Long
Long
 Long
Long
MOSCHIP: Structural Breakout & Momentum AccelerationFollowing a prolonged, multi-month horizontal consolidation phase established in December 2025, MOSCHIP has demonstrated a clean structural breakout above its historical trading range. The price action indicates a decisive shift in market structure from a neutral accumulation phase to an active markup phase, signaling that buyers have successfully absorbed overhead supply at the prior resistance.
The validity of this directional expansion is reinforced by a noticeable spike in relative volume, confirming institutional interest and high conviction behind the move.
A fresh bullish crossover on the MACD line above the signal line confirms accelerating upward velocity. The Relative Strength Index has printed above 66. While this level approaches the traditional "overbought" threshold, in the context of a fresh range breakout, it typically underscores strong, high-velocity bullish momentum rather than immediate buyer exhaustion.
From a tactical execution standpoint, chasing the immediate extension carries elevated near-term risk. A classic trend-following approach would anticipate a localized mean reversion or a formal retest of the prior resistance-turned-support zone. If the breakout zone holds on a corrective pullback, the next resistance will be 279 with support place at 192.
Disclaimer: This analysis is strictly for educational and informational purposes and does not constitute financial, investment, or legal advice. The charts and technical setups discussed represent hypothetical market observations and past performance is not indicative of future results. Trading equities involves significant financial risk. Individuals must perform their own due diligence or consult with a registered financial advisor before executing any market positions. The author holds no accountability for individual trading outcomes.  Long
Long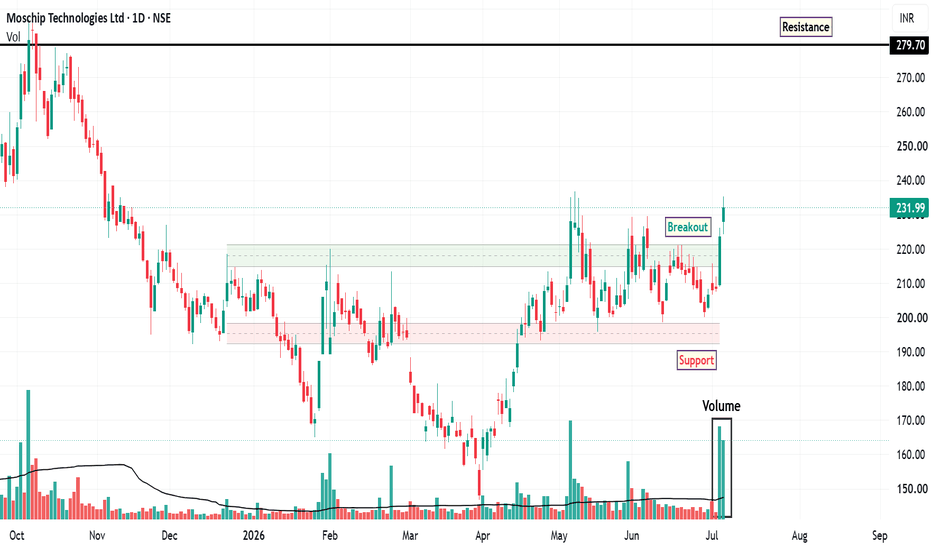
HDFC Bank: Early Signs of StabilizationHDFC Bank has undergone a meaningful correction, with the stock trading roughly 30% below its 52-week high. Following this prolonged downtrend, recent price action suggests that the stock may be entering a stabilization phase, supported by improving technical structure and momentum indicators.
One of the more constructive aspects of the current setup is the stock’s repeated ability to hold above a marked support zone, which may also be viewed as a discount or value area from a chart-based perspective. Multiple successful retests of this region indicate that buying interest has continued to emerge near lower levels, helping to establish a potential base.
The stock has also managed to close above its 20-day EMA, which may be interpreted as an early indication of improving short-term strength. While a single close above the moving average does not confirm a full trend reversal on its own, sustained price action above this level can often signal a gradual shift in sentiment.
Another supportive factor is the gradual increase in daily trading volume, which suggests improving market participation. Rising volume during a recovery phase is often monitored as a sign that the stock may be attracting renewed interest after an extended period of weakness.
From a momentum perspective, the MACD has delivered a bullish crossover on the weekly timeframe, which is typically considered more significant than signals on lower timeframes. This development may indicate that downside momentum is easing and that buyers are beginning to regain influence over the broader trend.
Despite the improving setup, the RSI and the presence of minor supply zones suggest that the stock may still experience short-term consolidation or a pullback before attempting a stronger directional move. In this context, the area around ₹757 may serve as an important level to monitor, particularly if the stock retraces to retest support before deciding its next move.
Based on the current structure, the following chart levels appear important:
Major resistance: near ₹819 , where prior supply may emerge
Stoploss: below the marked support zone on the chart
Disclaimer: This analysis is provided strictly for educational and informational purposes only. It reflects a technical interpretation of price action and indicators and should not be construed as investment advice, a solicitation, or a recommendation to buy, sell, or hold any security. Market conditions can change quickly, and investors should conduct their own due diligence or consult a licensed financial advisor before making any investment decisions.  Long
Long

 Long
Long
Long 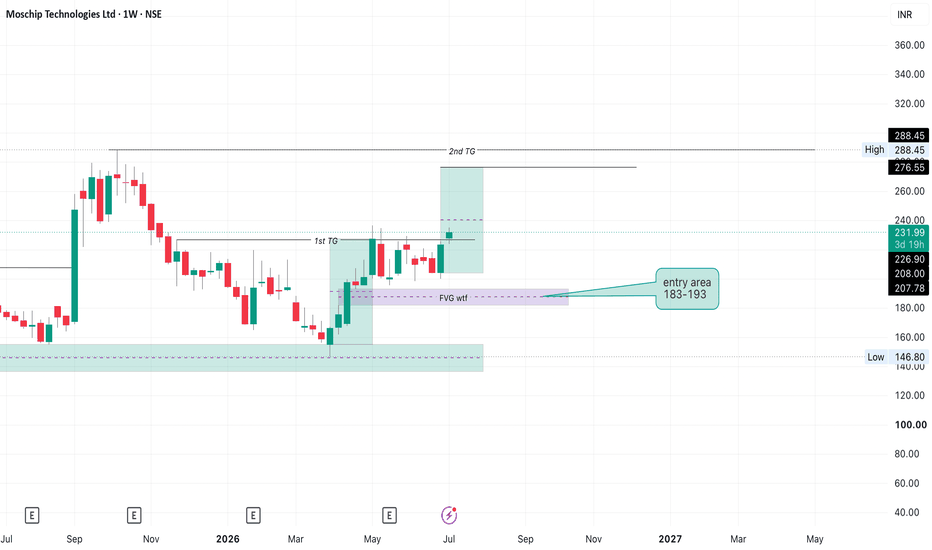
DELHIVERY — IPO Base Breakout on the Weekly ChartSince listing in mid-2022, Delhivery has carved out a massive multi-year IPO Base — exactly the kind of long, deep structure O'Neil describes for newly listed stocks that need time to shake out weak hands and build institutional sponsorship before a real move can begin.
The Structure:
📌 Listed ~₹560–650 in 2022, then corrected hard into a base low near ₹235 by early 2025 — a deep first-stage shakeout
📌 Multi-year rounding/cup formation from 2023 through 2026, with a clear left side, base, and now a right side forming higher lows into resistance
📌 Pivot/Buy Point: 500.00 — the level marking the top of the base structure
This Week's Breakout:
📌 O510.95 → H523.00 → L508.15 → C519.65 (+2.40%) on strong weekly volume (7.2M shares)
📌 Weekly close decisively above the 500 pivot and above the prior swing high resistance zone (~485–495) — this is a textbook Minervini-style breakout: tight price action into resistance, followed by an expansion candle with volume confirmation
📌 Multiple weekly volume spikes over recent months into the base's right side show accumulation building well before the actual breakout — smart money often shows up early
RS Line — The Key Confirmation:
📌 The Relative Strength line has been carving out its own bottoming pattern since late 2024, now curling up sharply alongside price
📌 Per Weinstein's Stage Analysis, this is the RS line transitioning from Stage 1 (basing) into Stage 2 (advancing) — a stock only qualifies as a true leader when RS confirms price strength, and that's happening here in real time
📌 RS making new highs alongside the breakout is the single most important technical confirmation in this setup — it separates genuine institutional leadership from a stock simply moving with the market.
Levels to track:
Support: 500 pivot (former resistance, now the line in the sand) and 457.70 (dashed support)
Next resistance: psychological/round-number zone, watch how price behaves on any pullback to the pivot
A multi-year IPO Base breaking out on strong volume with RS confirming — this is the type of setup Minervini and Weinstein both emphasize as high-probability: long consolidation + volume expansion + leading relative strength.
Not investment advice — just sharing my technical analysis. 📊
 Long
Long
 Long
Long