HDFC BankSupport
S1: ₹807–810
S2: ₹793–796
S3: ₹786–788 (major demand)
Resistance
R1: ₹818–820
R2: ₹830–835
R3: ₹850–860 (major breakout zone)
Trading Plan
🟢 Bullish
Hold above ₹820 → Targets ₹835 → ₹850 → ₹860
🔴 Bearish
Fall below ₹807 → Targets ₹796 → ₹788
Technical View
Trend: Moderately Bullish
Price is trading above key medium-term moving averages, indicating improving momentum.
Recent quarterly business update showed 15.4% YoY growth in advances and 14.7% growth in deposits, which has supported sentiment in the stock.
Key Level Summary
Level Price
Strong Resistance ₹850–860
Resistance ₹830–835
Immediate Resistance ₹818–820
Current Zone ₹815–816
Immediate Support ₹807–810
Strong Support ₹793–796
Major Support ₹786–788
State Bank of IndiaCurrent Trend
Price is trading around ₹1,040–1,050.
The stock is above its 20, 50 and 200-day moving averages, indicating the medium-term trend remains positive. RSI is near 54–60, suggesting neutral to mildly bullish momentum rather than an overbought condition.
Key Support Levels
₹1,040–1,043 – Immediate support
₹1,020 – Strong support
₹1,000–1,005 – Major positional support
Key Resistance Levels
₹1,050–1,058 – Immediate resistance
₹1,066–1,080 – Strong breakout zone
A sustained close above ₹1,080 could open the door for a fresh rally.
Trading View
Bullish: Buy on dips near ₹1,020–1,040 with a stop-loss below ₹1,000.
Breakout Trade: Consider fresh buying only after a strong close above ₹1,058–1,066 with volume.
Targets after breakout: ₹1,100 followed by ₹1,150 if momentum remains strong.
Overall Analysis
✅ Trend: Bullish to Neutral
✅ Momentum: Positive but not overextended
⚠️ Watch the ₹1,050–1,060 resistance zone carefully. A decisive breakout with strong volumes would strengthen the bullish case. Banking stocks have generally shown technical strength in the current market backdrop.
Larsen & ToubroCurrent Price
Around ₹4,045–4,050 (intraday, 6 Jul 2026).
Key Support Levels
₹4,025–4,050 – Immediate support
₹4,000–4,012 – Strong buying zone
₹3,940 – Major positional support
₹3,850 – Trend-changing support if broken decisively
Key Resistance Levels
₹4,080–4,120 – Immediate resistance
₹4,180 – Breakout level
₹4,330–4,340 – Major resistance
₹4,440 – 52-week high
Technical Analysis
The stock has corrected from ₹4,440 and is currently testing an important support area around ₹4,000–4,050.
Momentum is neutral to mildly bearish in the short term, but the long-term uptrend remains intact as long as ₹3,940 holds.
A close above ₹4,180 would improve the technical structure and could open the way toward ₹4,330–4,440.
Trading Plan
Bullish
Buy near ₹4,000–4,030 if support holds.
Add on a breakout above ₹4,180 with strong volume.
Targets: ₹4,330 → ₹4,440.
Bearish
A daily close below ₹3,940 could trigger further weakness toward ₹3,850 and potentially lower.
Investment View
Fundamentally, L&T remains one of India's strongest engineering and infrastructure companies with a robust order book. Recent concerns have centered on geopolitical risks affecting its Middle East exposure, but analysts generally continue to view the long-term outlook positively despite near-term execution and margin pressures.
Tata Motors Technical AnalysisKey Support Levels
S1: ₹422-425
S2: ₹412-415
Major Support: ₹400-405
Key Resistance Levels
R1: ₹439-445
R2: ₹455-460
Major Breakout: ₹470+
These levels are broadly consistent with recent technical pivot zones and market structure.
Trading Plan
Bullish Setup
Buy only if price closes above ₹445 with strong volume.
Targets: ₹460 → ₹475 → ₹495
Stop Loss: ₹425
Bearish Setup
If price breaks below ₹422, selling pressure may increase.
Downside Targets: ₹412 → ₹405 → ₹390
Keep a stop-loss above the breakdown candle.
Technical View
RSI is around the neutral-to-positive zone, suggesting momentum is improving but not overbought.
MACD remains positive, indicating bullish momentum is still present.
The stock is trading near an important resistance area, so a breakout confirmation is preferable before initiating fresh long positions.
Fundamental Triggers
Domestic passenger vehicle sales have remained strong, while the JLR business is still dealing with supply-chain and margin challenges.
Management continues to target long-term growth through EV expansion and capacity additions, but commodity costs and JLR performance remain key risks.
Overall View
Above ₹445: Bullish momentum can extend toward ₹475-495.
Between ₹422-445: Consolidation zone—wait for a decisive breakout.
Below ₹422: Short-term trend turns weak.
Adani Energy Solutions: Multi-Year Breakout Signals new UptrendAdani Energy Solutions: Multi-Year Breakout Signals Potential Start of a New Uptrend ⚡📈
Adani Energy Solutions has finally broken above a multi-year consolidation range, a development that often marks the beginning of a sustained trending phase.
Key Observations
• Price spent nearly 2.5 years consolidating within a broad range, allowing supply to be absorbed.
• A decisive breakout above the range has shifted the long-term trend in favor of the bulls.
• The current consolidation near the highs appears constructive and resembles a healthy pause after the breakout rather than a reversal.
As long as the stock continues to hold above the breakout region, the primary trend remains positive.
Key Levels
* Support: 1450–1500
* Immediate Resistance / Target: 1875
Long-Term Targets
🎯 Target 1: 1875
🎯 Target 2: 2800
🎯 Target 3: 3400
A sustained move above the first target could open the door for the next phase of the long-term trend.
My view:
Multi-year breakouts often create some of the strongest positional opportunities. While short-term volatility is always possible, the overall structure remains constructive as long as the breakout zone continues to hold.
Not financial advice. Always manage your risk.
#AdaniEnergySolutions #PowerSector #TechnicalAnalysis #SwingTrading #NSE #ChartAnalysis #BreakoutTrading
If you like to see more posts, please do show appreciation by liking this post and following me on:
in.tradingview.com/u/lovishkhanduja/
ONGC ONGC (1D Chart) – Quick Summary
📉 Trend: Short-term bearish (price below moving average). Long -term --bullish
🟧 Support: ₹235–240 (strong buying zone).
🚨 Breakdown: Below ₹228 = more downside possible.
📈 Resistance 1: ₹250–255.
📈 Resistance 2: ₹275–280.
🎯 Major Resistance: ₹325–340.
✅ Bullish only if: Price holds above ₹235–240 and closes above ₹250 with good volume.
BUY TODAY SELL TOMORROW for 5%DON’T HAVE TIME TO MANAGE YOUR TRADES?
- Take BTST trades at 3:25 pm every day
- Try to exit by taking 4-7% profit of each trade
- SL can also be maintained as closing below the low of the breakout candle
Now, why do I prefer BTST over swing trades? The primary reason is that I have observed that 90% of the stocks give most of the movement in just 1-2 days and the rest of the time they either consolidate or fall
Inverted head and shoulder breakout in INDOFARM
BUY TODAY SELL TOMORROW for 5%
KPIT TECHNOLOGIES : a good long term investment pick ?Note : This idea is purely for learning and educational purpose and it's not buying or selling recommendation.
1] Stock price has reached to yearly strong demand zone
2] According Elliot wave analysis, stock has completed one complete cycle (5 wave up and 3 waves down) and it could start a major 3rd wave.
3] Investment horizon : 3 to 5 years.
5] Follow stop-loss very strictly.
6] Never invest more than 5% capital in single stock.
Emmvee - Potential completion for 1st impulse wave - Book profit
Views expressed are based on Elliott Wave Principle
Emmvee Photovoltaic Power started forming its first impulse wave on 18 Dec 2025 after its listing in stock exchange.
W1 = Small five wave sequence
W2 = Flat correction where Wave C = 1x of Wave A (larger retracement)
W3 = Extended five wave sequence, achieved 2x of W1
W4 = Smaller degree correction
W5 = Extended five wave sequence, achieved 1x of W3
Details have been provided in the chart.
The stock has most likely completed its first impulse wave as above. Traders may book profit / trail stop loss.
GRSE Smart Money Analysis The CHoCH line at ₹2,775 correctly identifies the break zone;
The trendline anchors are the right swing points (₹2,530 → recovery), sugesting ₹2,833 target aligns with the actual 1D/4H HH cluster at ₹2,830–₹2,845.
Likely "Cup and Handle" pattern also support the analysis.
This is mere an analysis and not an advice for investment.
Bank of Baroda (BOB) Looks attractive for Medium to Long Term• **Investment Outlook**: Bank of Baroda is fundamentally attractive but technically weak short-term.
• **Fundamental Analysis** (Long-Term: Positive ⭐⭐⭐⭐☆):
- **Valuation**:
- P/E ratio around 7.
- Price-to-Book ratio approximately 0.84–0.85x.
- Dividend Yield about 3%.
- **Earnings Growth**:
- Q4 FY26 net profit up 11% YoY.
- Net Interest Income (NII) growth of about 9% YoY.
- Q1 FY27 credit growth reported at around 17% YoY.
- **Asset Quality**:
- Declining NPAs.
- Improved provision coverage.
- Comfortable capital adequacy.
- **Dividends**: Regular payouts make it suitable for capital appreciation and income.
• **Technical Analysis** (Short-Term: Neutral to Bearish):
- Recent stock correction due to NMC Health settlement.
- Current trend below short-term moving averages; weakened momentum.
- **Important Support Levels**: ₹250–252 (strong), ₹240–245 (major).
- **Resistance Levels**: ₹262–265, ₹275, ₹290.
- Close above ₹265–270 could enhance short-term outlook.
• **Buying Recommendations**:
- **Long-Term Investors (2–5 years)**: Accumulate gradually.
- Buy 30% now.
- Buy another 30% if it falls toward ₹250.
- Buy remaining 40% once it closes above ₹265–270 with strong volume.
- **Swing Traders**: Wait for:
- Breakout above ₹265–270 with volume or
- Strong bullish reversal near ₹250 support.
Connecting the World, ResponsiblySterlite Technologies Limited - STLTECH - CMP 106
About
Sterlite Technologies Limited was established in July 2001 after the demerger of the telecom division of Sterlite Industries Ltd (SIL). In July 2006, STL acquired the transmission line business of SIL to foray into the power transmission cables business. STL has grown over the years to become the largest Optical Fiber and Optical Fiber Cables manufacturer in the country. The company also has sizeable presence in the overseas markets with an established presence in the global optical fiber market.
STERLITE TECH:
STERLITE TECH launches AI-optimized data centre solutions and partners with Tech Data for India expansion.
Products target hyperscalers, enterprises, telecoms; meet global standards with 25-year warranty.
STERLITE TECHNOLOGIES: CO AND C-DOT ACHIEVE INDIA’S FIRST QUANTUM-SECURED NETWORK BREAKTHROUGH WITH MULTI-CORE FIBRE
Sterlite Technologies: Promoter Ankit Agarwal bought 2.58 lakh shares. Promoter Pravin Agarwal bought 7.35 lakh shares. (Positive)
This is just to boost my confidence. No Suggestions for buying. I will keep checking and updating my mistake if last post gone wrong...
Disclosure: I am not SEBI registered. The information provided here is for educational purposes only. I will not be responsible for any of your profit/loss with these suggestions. Consult your financial Adviser before making any decisions.
ITC Ltd : ( 1 M )📉 Chart Analysis
👉 Major bearish breakdown: ITC has broken below a long-term ascending support trendline and triangle pattern. This is a significant negative technical signal.
👉 Strong selling pressure: The large bearish monthly candle indicates aggressive institutional selling and a shift in long-term sentiment.
👉 Current price: Around ₹290, trading near recent lows after the breakdown.
👉 Trend: Long-term trend remains bearish until the stock starts making higher highs and higher lows.
🔑 Important Levels
📉 Support: ₹280–285 (immediate), then ₹260 if this zone fails.
📈 Resistance: ₹320–330 (first), followed by ₹390–400 (major resistance and previous breakdown zone).
📊 Outlook
🐂 Bullish case: A monthly close above ₹320–330 with strong volume could indicate the start of a recovery.
🧸 Bearish case: If ₹280 breaks on a closing basis, the stock may extend its decline toward ₹260.
💡 Conclusion
At the moment, ITC is not showing a confirmed bullish reversal. It is better to wait for a clear base formation and breakout rather than trying to catch the bottom.
Disclaimer: This is for educational purposes only and not a buy/sell recommendation. Please do your own research before investing.
#ITC #StockMarket #Nifty50
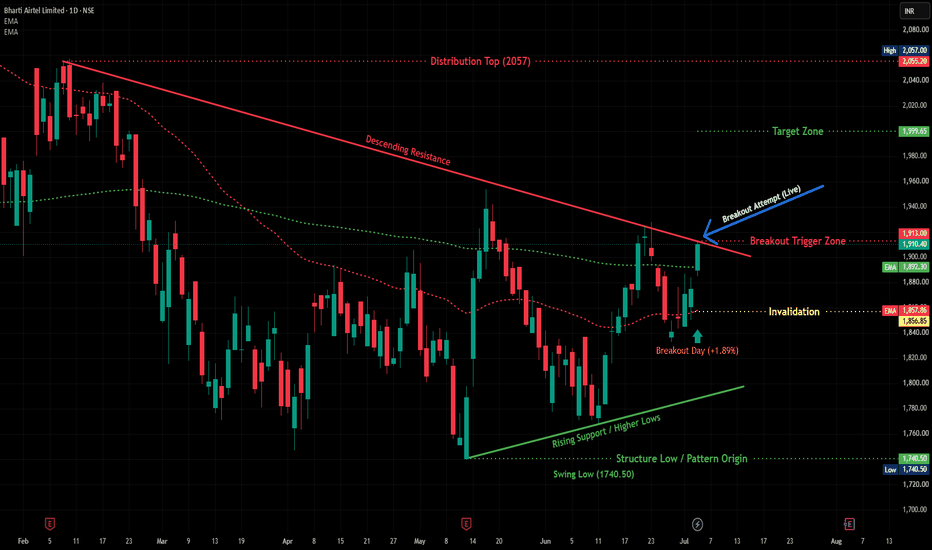
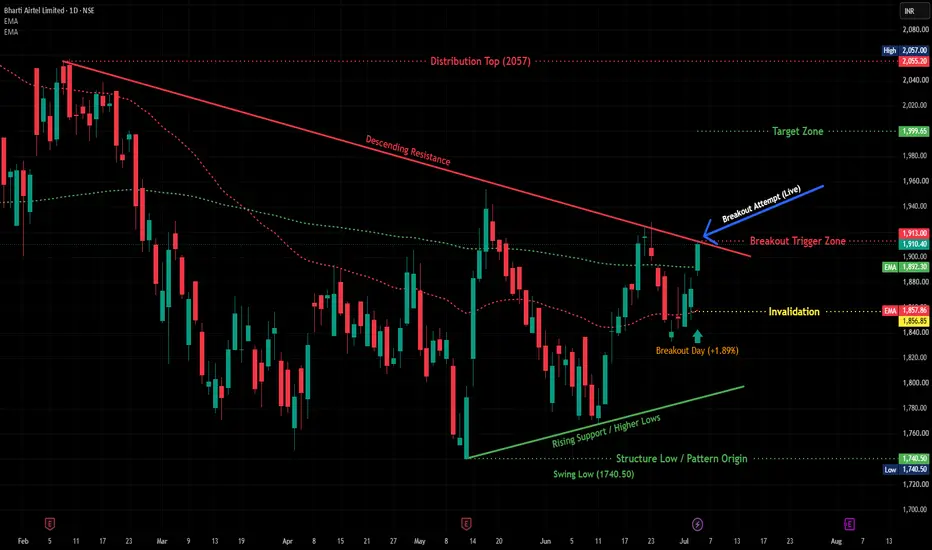
BHARTIARTL — Descending Triangle Testing Breakout on Daily ChartOverview
Bharti Airtel has spent the last five months carving out a textbook descending triangle on the daily chart, and today's session is where it starts getting interesting. Price rallied 1.89% off a strong base, pushing right into the resistance line that's been capping every rally since February. If this holds, we could be looking at the start of a fresh leg higher after months of range-bound grinding.
Pattern Explanation
The structure here is clean: a descending resistance line connecting the February high (2057) down through a series of lower highs, meeting a rising support line built off higher lows since the May bottom (1740.50). That's a classic descending triangle — lower highs compressing into a flat-ish floor, which usually resolves in the direction of the prevailing higher-low structure once broken.
Today's candle closed right at the confluence of that resistance line and the 1910-1913 zone, which has acted as a pivot multiple times since June. This is the first real test of the trendline with strong volume and price momentum behind it, not just a wick poking through.
Key Levels
Breakout Trigger Zone: 1910–1913
Invalidation: 1856.85 (below recent swing structure)
Target Zone: 1999.65
Structure Low / Pattern Origin: 1740.50
Distribution Top: 2057
Risk-to-reward from current levels works out to roughly 1:1.7, which is a reasonable setup for anyone tracking this on the daily timeframe.
Scenarios
Bullish scenario: A daily close above 1913 with follow-through volume opens the door toward 1980, and eventually the 1999–2000 target zone. Watch how price behaves around the 1940-1960 area — that's where the 200 EMA region previously acted as resistance during the March-April decline, so some hesitation there wouldn't be surprising.
Bearish scenario: If price fails to hold above 1910 and slips back under the rising support line (currently tracking near 1885-1890), the triangle thesis weakens and a retest of 1856-1860 becomes likely. A break below 1856.85 would invalidate the setup entirely and put the May-June range lows back in play.
Beginner's Lesson
A descending triangle is one of the more reliable continuation/reversal patterns to learn because it tells you two things at once: sellers are getting weaker (lower highs, but shallower each time) while buyers are getting stronger (higher lows). When those two lines converge, it's usually a sign that a decisive move is close. The key skill isn't spotting the pattern — it's waiting for the actual break with volume, rather than jumping in on the first touch of the resistance line. Airtel gave several false pokes at this trendline back in May and June that faded; today's move has more conviction behind it, which is what separates a real breakout attempt from noise.
Conclusion
Bharti Airtel is at a genuine decision point after months of consolidation. The structure is clean, the levels are well-defined, and today's price action gives the bulls their strongest case yet. As always, this is for educational and analytical purposes — confirm with your own risk management and position sizing before acting, and keep an eye on the 1910-1913 zone over the next couple of sessions to see if this breakout has legs.
Not investment advice. For educational purposes only. Please consult your financial advisor before making any trading decisions.
PRAVEG | Weekly Base Formation — Confirmation PendingPraveg Ltd — Weekly Chart Study
BSE: PRAVEG
PRAVEG is showing an early recovery attempt after a long corrective phase from higher levels. Price has taken support near the lower zone and is now trying to form a base, but the broader structure still needs confirmation.
On the weekly chart, the stock is trading near the lower end of its correction range and is attempting to move back toward the first important recovery zone. The falling trendline still shows that the broader downtrend has not fully reversed yet.
The key level to track now is the ₹270–275 zone. A sustained weekly close above this area can improve the recovery structure. However, stronger confirmation will come only if price moves above the ₹300–320 zone with healthy volume.
On the downside, ₹230–240 remains the near support zone, while ₹200–215 is an important broader support area.
Key levels:
Support: ₹230–240
Major support: ₹200–215
First recovery zone: ₹270–275
Stronger confirmation zone: ₹300–320
Higher resistance: ₹400–405 / ₹600
For now, PRAVEG looks like a base formation / early recovery setup, not a confirmed breakout. Sustained weekly closing above resistance zones will be important for better confirmation.
Shared only for educational study and chart-tracking purpose. This is not a buy/sell recommendation or investment advice. I am not a SEBI registered advisor. Please do your own research or consult a qualified financial advisor before taking any investment decision. I am not responsible for any profit or loss based on this post.
"reconnect people by a futuristic way of travel,"🟢 Olectra Greentech Ltd – Positional Breakout Setup in EV Segment ⚡
CMP: ₹1280.90 | NSE: OLECTRA
🔹 Strong trendline support maintained for over 2 years
🔹 Multiple MACD (6/19, 13/55, 20/89) showing early crossover signals
🔹 RSI breakout above 50, now forming higher lows – momentum picking up
🔹 Ichimoku cloud breakout confirmation awaited – early signs of reversal
🔹 Volume holding well, OBV flat – potential accumulation zone
📈 Price breaking out from a long-term triangle pattern; if sustained, targets could open up toward ₹1450–₹1600 in coming months.
📊 Sector tailwind: EV, battery, and green mobility themes remain strong
🌱 Fundamentals supported by order book visibility, policy tailwinds, and infrastructure push
🎯 Ideal for positional traders & long-term investors with a medium-term view.
📝 Note: Please do your own due diligence. This is not a recommendation, just a view based on charts and fundamentals.
🧠 Disclaimer: For educational and research purposes only. No buy/sell advice.
📝 Chart Purpose & Disclaimer:
This chart is shared purely for educational and personal tracking purposes. I use this space to record my views and improve decision-making over time.
Investment Style:
All stocks posted are for long-term investment or minimum positional trades only. No intraday or speculative trades are intended.
⚠️ Disclaimer:
I am not a SEBI registered advisor. These are not buy/sell recommendations. Please consult a qualified financial advisor before taking any investment decision. I do not take responsibility for any profit or loss incurred based on this content.
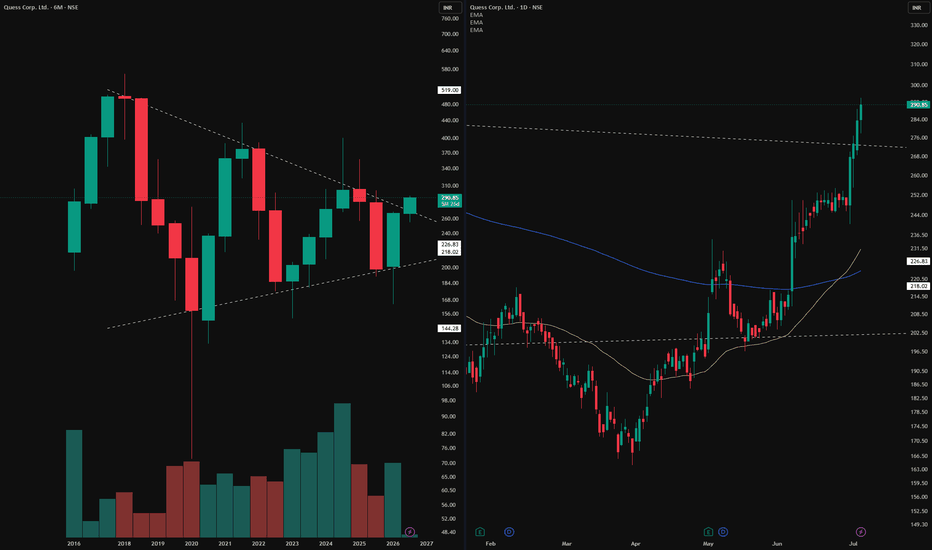
You Found the X. But How Big Is the Canvas?The Trap of Looking at One Timeframe
It does not matter how clean the setup looks. It does not matter if the market structure on the daily is textbook perfect, higher highs, higher lows, clean breakouts, a beautiful EMA crossover. None of that context matters in isolation if you have not asked one simple question first.
Where is this on the bigger canvas?
What the Daily Shows
The daily chart tells a confident story. Market structure is healthy. Higher lows are forming. Maybe a breakout has occurred. Maybe the EMAs have crossed in the right direction. From this lens, everything looks constructive. A trader looking only here would feel justified in their read.
What the 6 Month Reveals
Switch to the left side of this post. The monthly chart. Zoom out and suddenly the same price area that looked like open space on the daily is sitting directly beneath a major counter trendline. Or inside a symmetrical triangle pattern that has been compressing for years. Or approaching a resistance zone that has rejected price multiple times across a decade.
The X that looked like opportunity on the daily is sitting at the edge of a wall on the monthly. Same price. Completely different story depending on which canvas you are reading it from.
The Multi Timeframe Habit
This is not about ignoring the daily. It is not about only trading the monthly. It is about making sure that whatever you observe on your working timeframe, you have visited the higher timeframe first to understand the location of that observation within the broader structure.
Disclaimer: This post is purely educational and observational in nature based on historical price action across multiple timeframes. It does not constitute financial advice, a forecast, or a recommendation to buy, sell, or hold any security. Multi timeframe analysis is a personal observational approach and does not guarantee future price behavior.
BAJAJHFL | Karein Har Ghar Mumkin — Weekly Recovery AttemptBajaj Housing Finance Ltd — Weekly Chart Study
NSE: BAJAJHFL
BAJAJHFL is showing an early recovery attempt after a long corrective phase from post-listing levels. Price has taken support near the lower base zone and is now trying to sustain above the recent consolidation range.
The weekly structure is gradually improving. RSI has moved back above the mid-zone, showing better momentum, while MACD is turning positive, indicating that downside pressure is reducing.
The key area to track now is the ₹88–91 zone. Sustained price action above this zone can strengthen the recovery structure. On the upside, important resistance areas are visible near ₹96–100, followed by ₹116.90, ₹130.57, and ₹144.25.
This is still a recovery attempt, not a confirmed breakout. Stronger confirmation will depend on sustained weekly closing above resistance zones with healthy volume.
Key levels:
Support: ₹83.18
Major risk zone: ₹75.85
Resistance: ₹96–100 / ₹116.90 / ₹130.57 / ₹144.25
Shared only for educational study and chart-tracking purpose. This is not a buy/sell recommendation or investment advice. I am not a SEBI registered advisor. Please do your own research or consult a qualified financial advisor before taking any investment decision. I am not responsible for any profit or loss based on this post.