• Products
  • Community
  • Markets
  • Brokers
  • More
Get started
  • Markets
  • /World stocks
  • /Ideas
Good LTF trade on the lineif global cues support, its going on a fine line of upside move. just the gap up on the weekly char is not goo, other wise it a good trade, i entered on 209, now it 201, before that i booked on 323 something, now entered again, lets see where it goes
NSE:LTFLong
by RedBullBlueBull
Updated
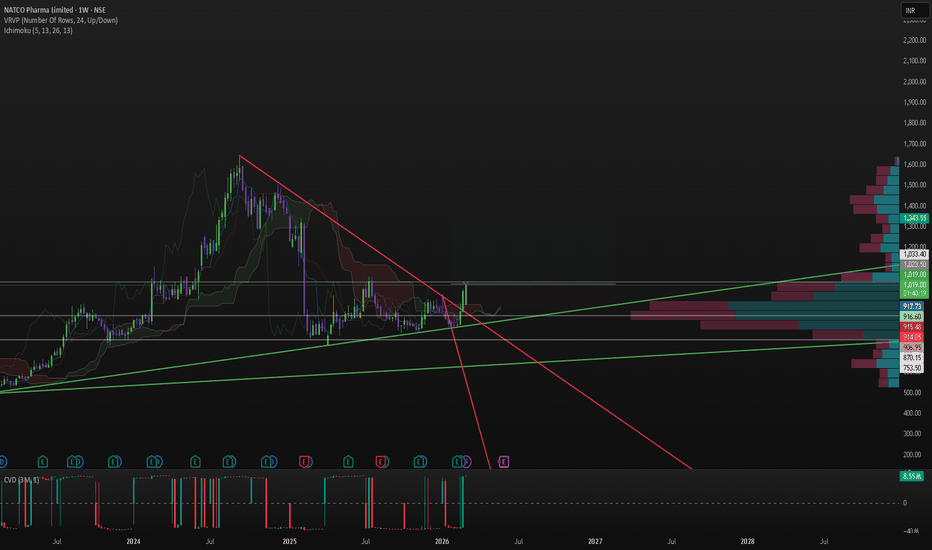
Seems like a good trade45-50 days of trade can give you 25-30%. dont invest too much in this period of crisis, just 40-50 shares, that is the minimum risk you should take, tp 1350-1400, sl- 750-820
NSE:NATCOPHARMLong
by RedBullBlueBull
Updated
DPABHUSHAN Weekly Breakout Supported by Exceptional VolumeD. P. Abhushan Ltd. has staged a powerful bullish breakout on the weekly timeframe. The price action shows that the stock had been forming a broad consolidation base over the last couple of years, facing strict overhead resistance near the 1,900 level (indicated by the horizontal red line). The most recent weekly candle decisively shattered this resistance, closing at 2,153.2 and registering a substantial gain of +14.90%. This breakout is heavily validated by the volume; a towering green volume
NSE:DPABHUSHAN
by ParamjitMahapatro
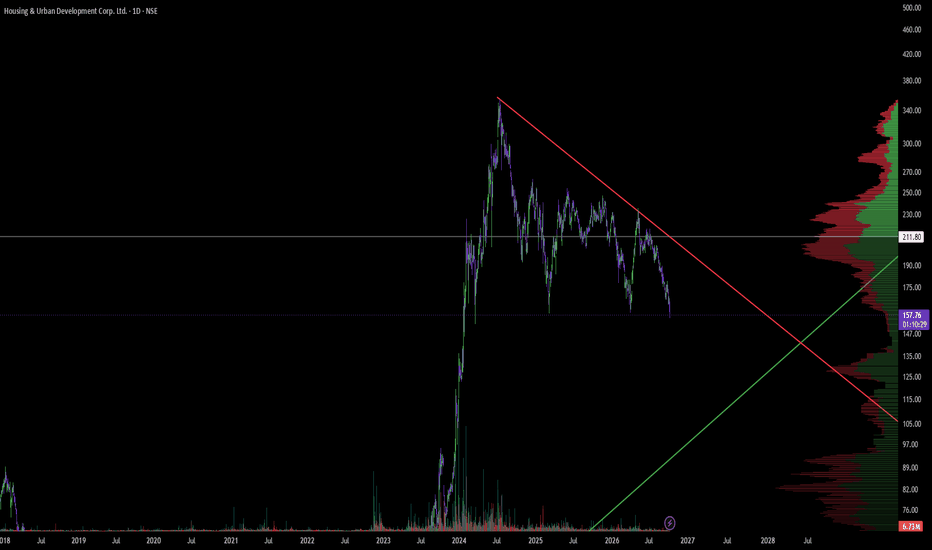
AS MARKETS COOL OFFAs the markets cool off, this trade on HUDCO can be good as this is a good support level, but i won't take big risk personally as it can go to 90-100 also from here. Good levels, I'd personally aim for a 4-5 % pull back and then a 20-25 % gain. ENtry- 155-150 Tp- 194-195 sl- 90-100
NSE:HUDCOLong
by RedBullBlueBull
SMCGLOBAL Multi-Year Resistance Breakout by Massive VolumeOn the weekly timeframe, SMC Global Securities Ltd. has executed a textbook technical breakout from a prolonged consolidation base. The stock had been battling a stiff horizontal resistance ceiling around the 90.78 mark for an extended period. Recently, the price shattered this level with a strong bullish weekly candle, touching a high of 120.00 before settling at its current level of 109.90. Crucially, this price action is validated by remarkably high trading volume—indicated by the towering
NSE:SMCGLOBAL
by ParamjitMahapatro
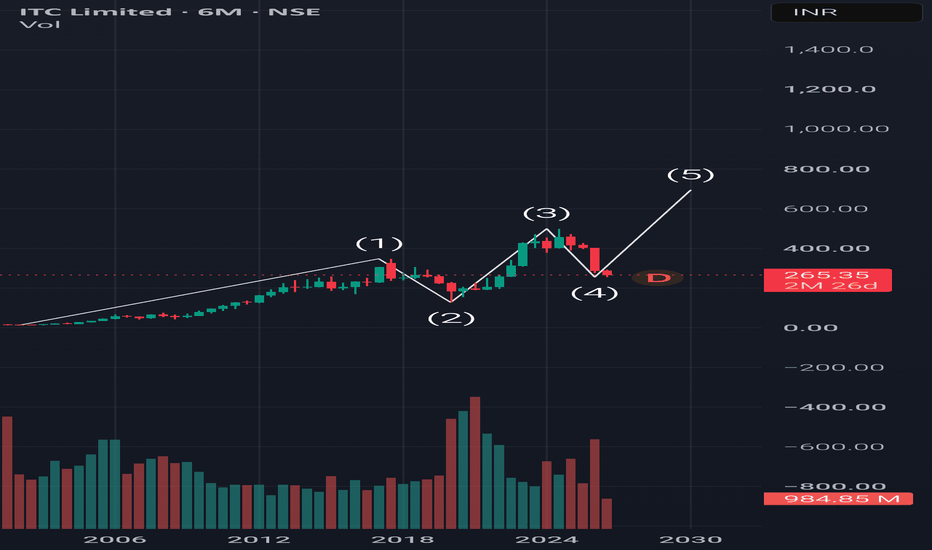
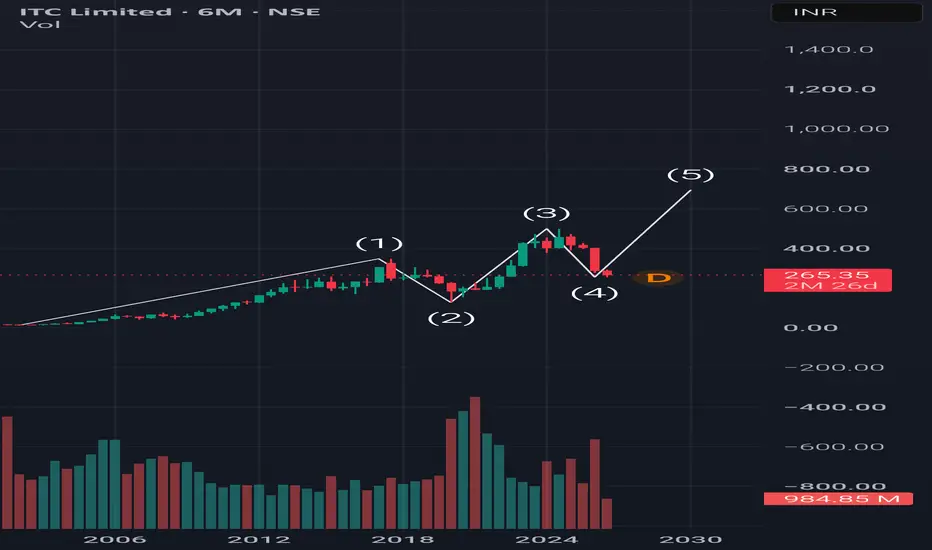
ITC Bullish Reversal It's now or Never, Elliot Wave Theory suggests a new set rally for the stock fundamentally the company has become very agressive with the target to become biggest FMCG player . Company being absolutely debt free LIC major holding excellent divends for the buyers it's like everything is becoming too good to be true. This is the best value for long term investors hold in cash allocate 25% portfolio. Do your own research I am not a financial advisor.
NSE:ITCLong
by anujmehra2012
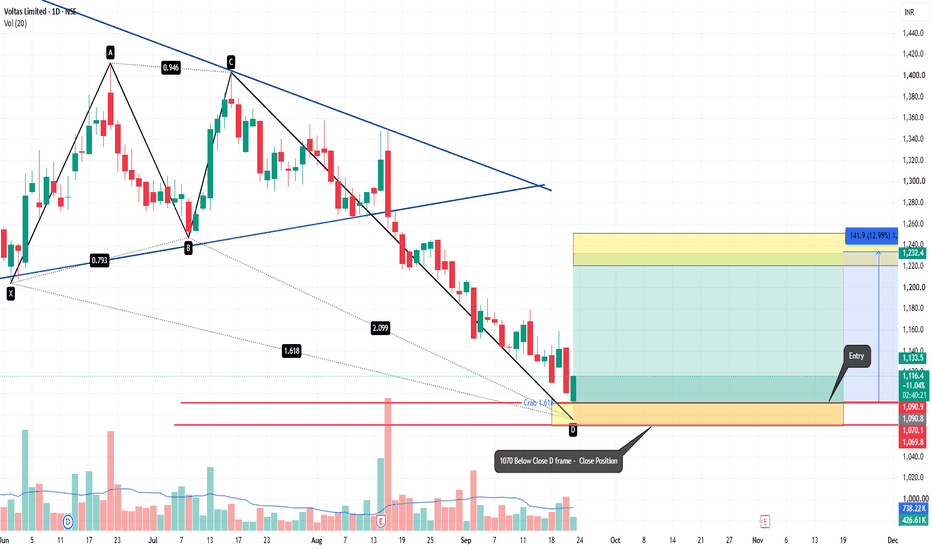
Voltas Ltd - Harmonic XABCD Crab pattern -Bullish Reversal setup## 📈 Voltas Ltd. — Technical Setup Voltas is showing a **potential bullish reversal setup** after a prolonged decline. The chart highlights a **PRZ / Crab 1.618 harmonic zone** around the ₹1,070–₹1,095 area, where price has started showing a reaction. ### 🔑 Key Levels * **CMP:** ₹1,116 * 🟢 **Entry / Support Zone:** ₹1,080–₹1,095 * 🔴 **Invalidation / SL:** ₹1,070 * 🎯 **First upside zone:** ₹1,232–₹1,240 * 🚀 **Extended target:** ₹1,416 ### 📊 Setup View Price has reached the marked harmonic co
NSE:VOLTASLong
by KMKB
Updated
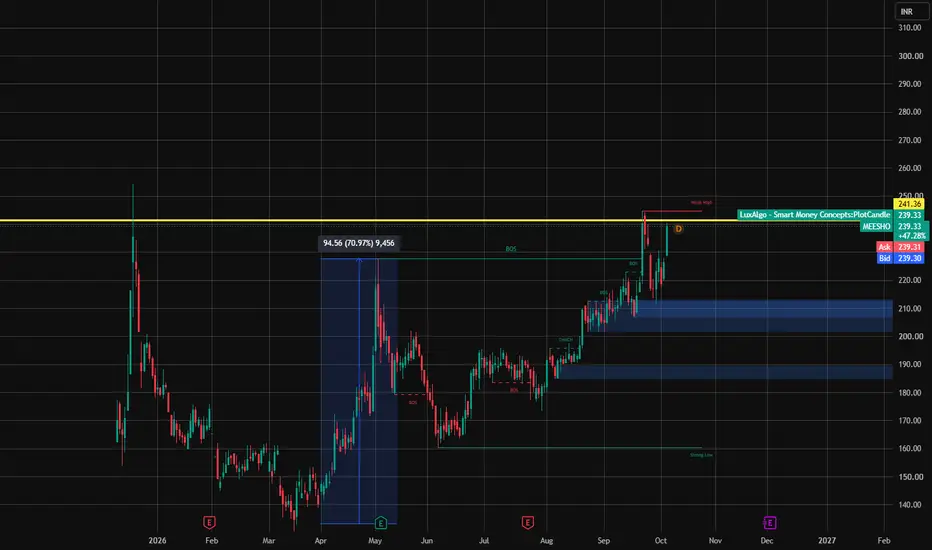
Meesho: Growth is strong, but profit is still far awayI went through Meesho's ratios and financials. One thing first: if you look only at headline numbers, the picture will be incomplete. What looks good ✅ → FY26 net sales of ₹12,626 cr, up 34.5% → Almost no debt, with interest of only ~₹9 cr → Current ratio of 1.55, and cash up from ₹147 cr to ₹620 cr → Asset-light model: asset turnover of ~1.7 and near-zero receivables What needs a closer look ⚠️ → FY26 expenses grew 41.6% against 34.5% sales growth, so costs outpaced revenue → PBIDT went from
NSE:MEESHO
by NismResearchAnalyst-AYUSHI
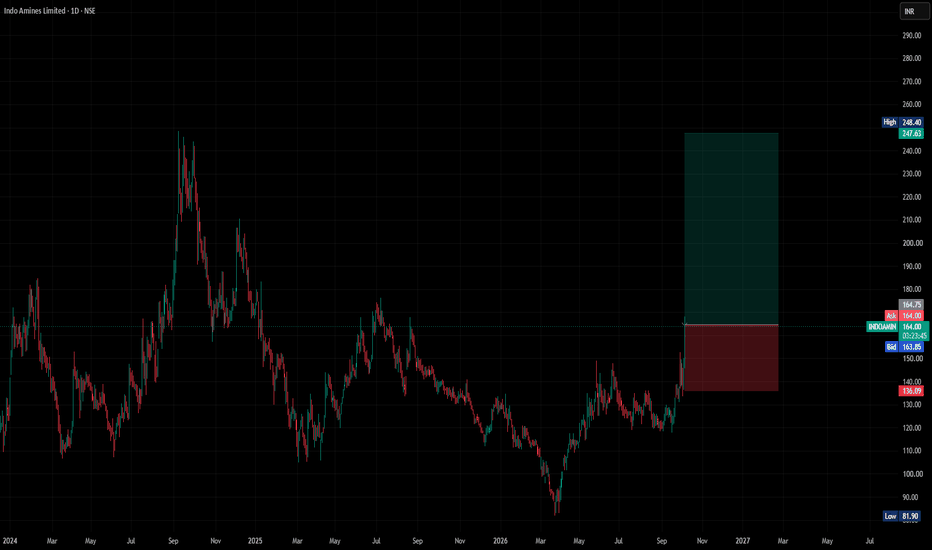
INDOAMIN Technical Analysis & Trade Setup Symbol: INDOAMIN (Indo Amines Limited) — Daily Timeframe (NSE) Current Price: ₹165.20 (+3.17% intraday surge) Market Structure: Following an extended corrective cycle down to its macro structural low near ₹81.90, the stock formed a rounded double-bottom accumulation base and printed a clear sequence of higher lows. Price has logged a strong bullish momentum candle, breaking out above its local base resistance. Key Technical Trade Levels Entry Zone: ~₹164.75
NSE:INDOAMINLong
by QuantumX-Pro
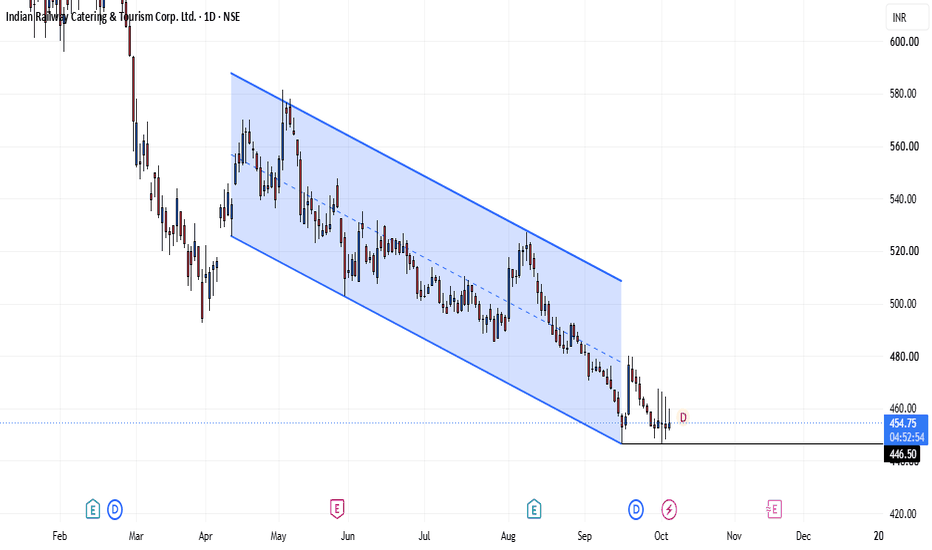
IRCTC - Falling Channel | Reversal From SupportPrice is moving into a falling channel and showing a reversal from support. doing average at this level advisable sir. 🔹 Demand zone + channel support: ₹445-455 🔹 Resistance: ₹480-490, then ₹560 DISCLAIMER This channel is for educational and self-analysis purposes only. We share technical levels, charts, and market insights based on publicly available information and multiple sources. These are not financial or investment recommendations. I am not a SEBI-registered analyst. Please consult your
NSE:IRCTCLong
by Digital_Trading_Floor
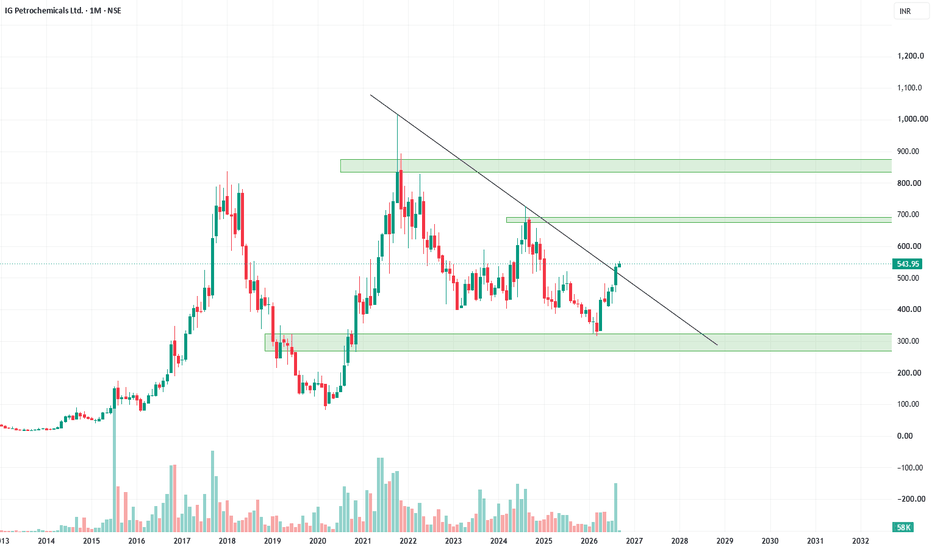
IG Petrochemicals, 1MIG petrochemicals is showing increase in volumes at trendline breakout. Use dips for entry. Currently running from strong support. looks for for medium to long term.
NSE:IGPLLong
by VinitaNaiduAndra
Updated
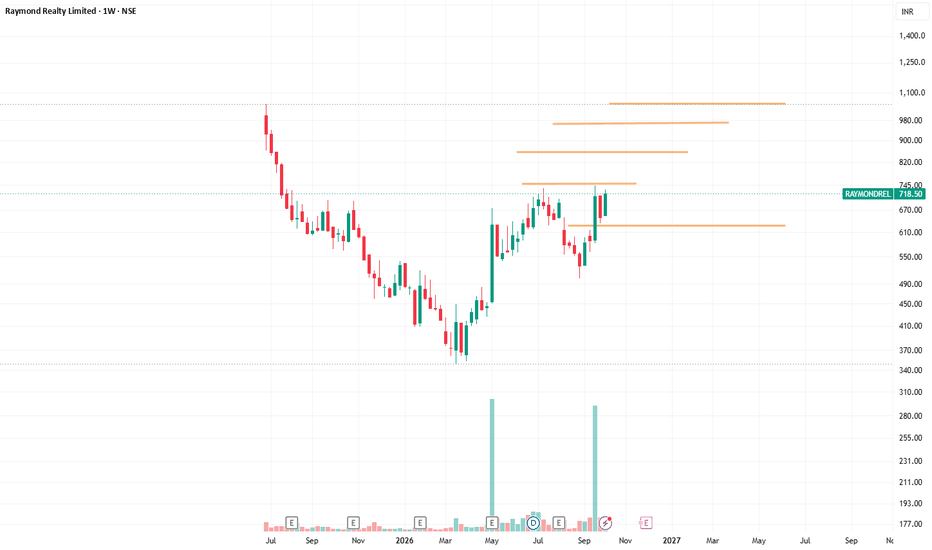
Raymond Realty Ltd (RAYMONDREL)as per diwali coming up people invest in reality as well. and in weekly time frame the stock is about to break a very strong resistance zone so it can looked for good breakout.
NSE:RAYMONDRELLong
by piyushtripathi382
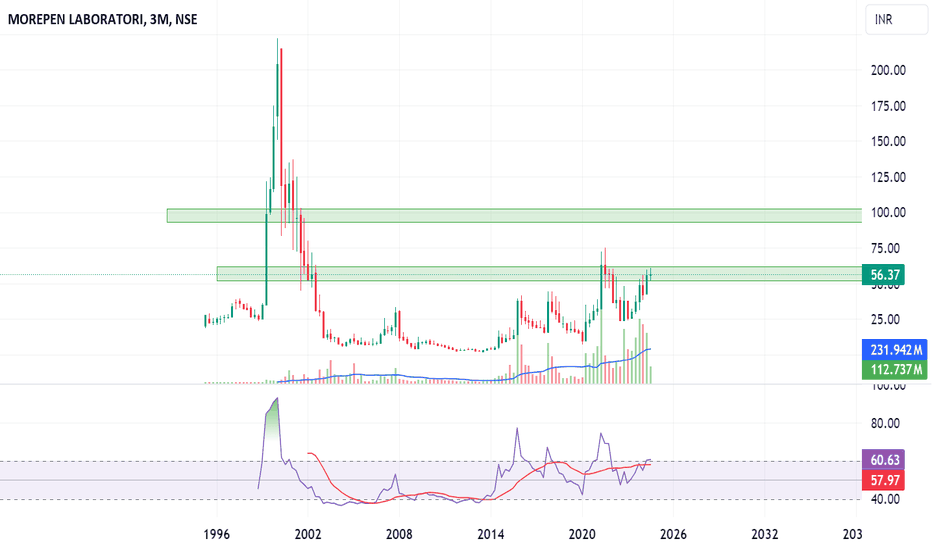
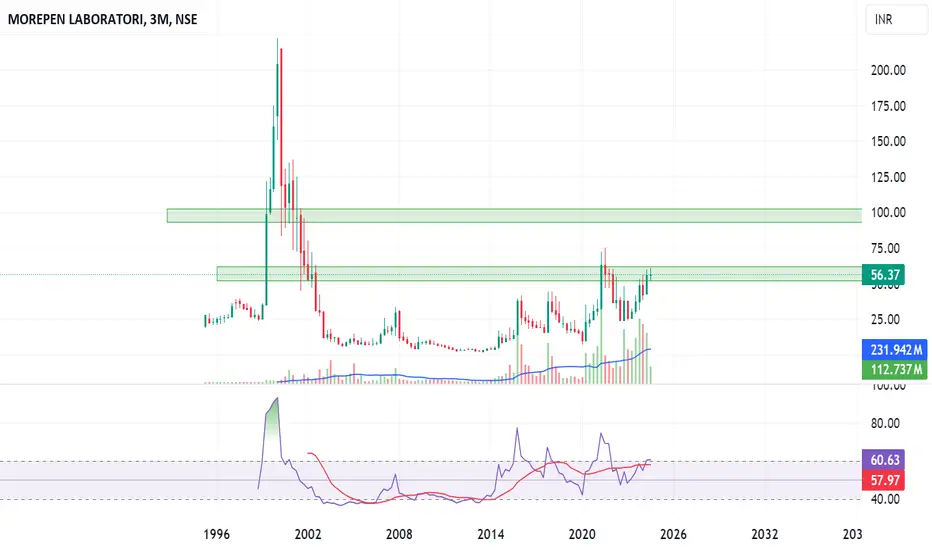
Morepen labs, quaterly chart, long term viewA leader in anti asthamatic drugs, bp monitors, blood glucose monitors. Technically, sitting at multi year breakout above 45, formed base,volumes increased. Looking good for investment pick, with 2-3 years view.
NSE:MOREPENLABLong
by VinitaNaiduAndra
Updated
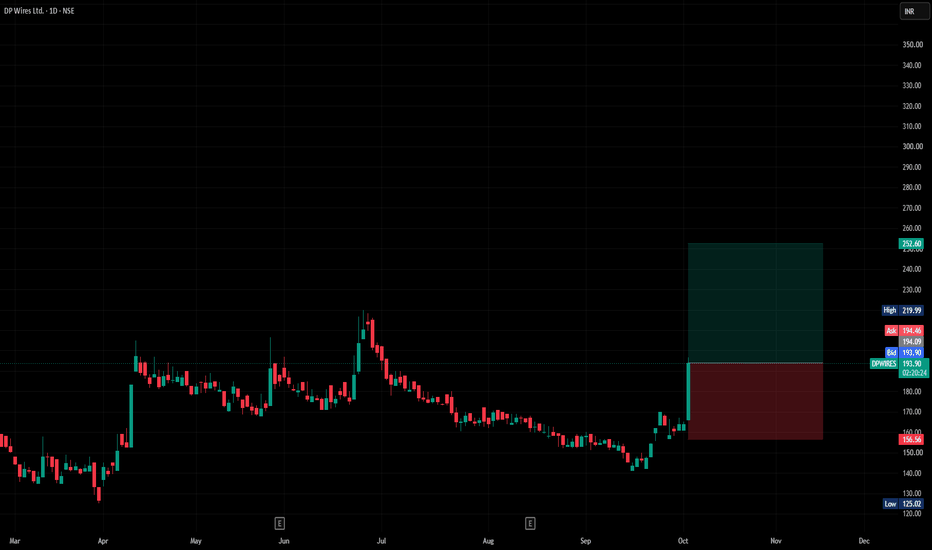
DPWIRES Technical Analysis & Trade Setup Symbol: DPWIRES (DP Wires Limited) — Daily Timeframe (NSE) Current Price: ₹194.20 (+3.07% intraday surge) Market Structure: Following an extended corrective sequence down to the structural low near ₹125.02, the stock executed a multi-month rounding accumulation base and printed a series of higher lows. Price has logged a strong expansion candle, breaking out above its dynamic horizontal base resistance. Key Technical Trade Levels Entry Zone: ~₹194.09 – ₹194.
NSE:DPWIRESLong
by QuantumX-Pro
Updated
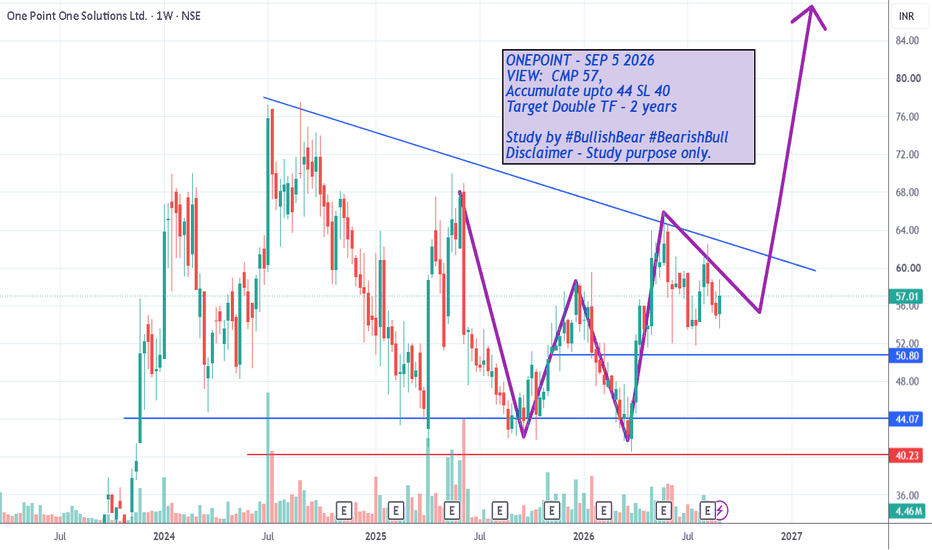
ONE POINT ONE SOLUTIONS LTD — ELLIOTT WAVE & PRICE STRUCTUREOne Point One Solutions is currently showing a potentially important Elliott Wave completion and accumulation structure. The larger price structure appears to have completed a corrective W-X-Y pattern, with the recent price action developing from the ₹40–52 support/accumulation region. The stock has subsequently broken above the descending corrective trendline, indicating improving bullish momentum. 🔹 Key Technical Structure The larger corrective structure appears to form a W-X-Y three-wave co
NSE:ONEPOINT
by hardeepssethi
2
Uptrend Stock has been in an uptrend for quite a long time on the 2-hour chart. We see it went to an all-time high and then took a downward journey towards the 200 EMA. Now it took support at the 200 EMA and filled the last bearish fair value gap that was formed during the downtrend. Now it can start its upward journey again.
NSE:MOTILALOFS
by drmukur
2
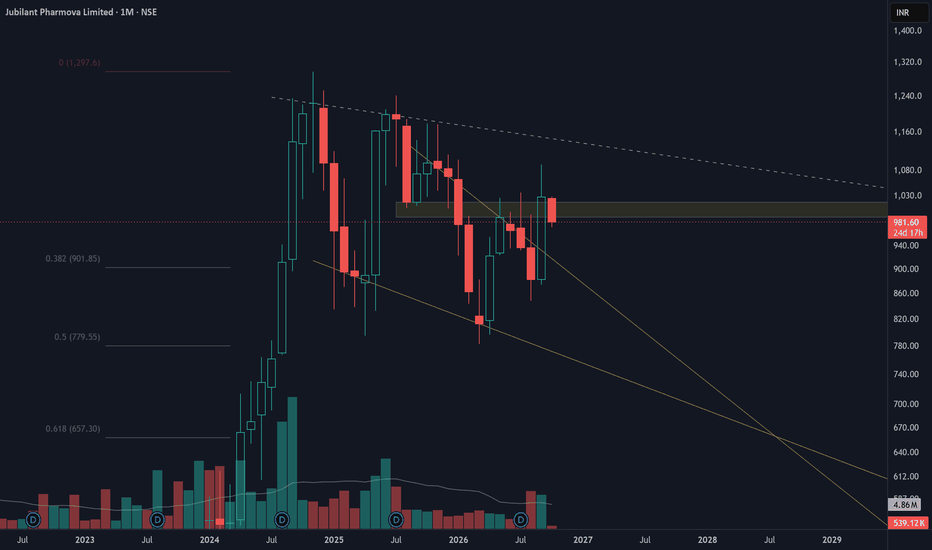
Shattering the Downtrend!Pattern Structure: The price action reveals a maturing descending wedge, compressing volatility toward a decisive resolution and signaling a major shift in market structure. Volume Analysis: Notable spikes in volume during the trendline breach confirm strong institutional conviction, validating the breakout and reducing the risk of false breakouts. Supply and Demand: A robust horizontal support zone provides a reliable demand floor, successfully absorbing selling pressure to fuel the upside m
NSE:JUBLPHARMALong
by Knox1411
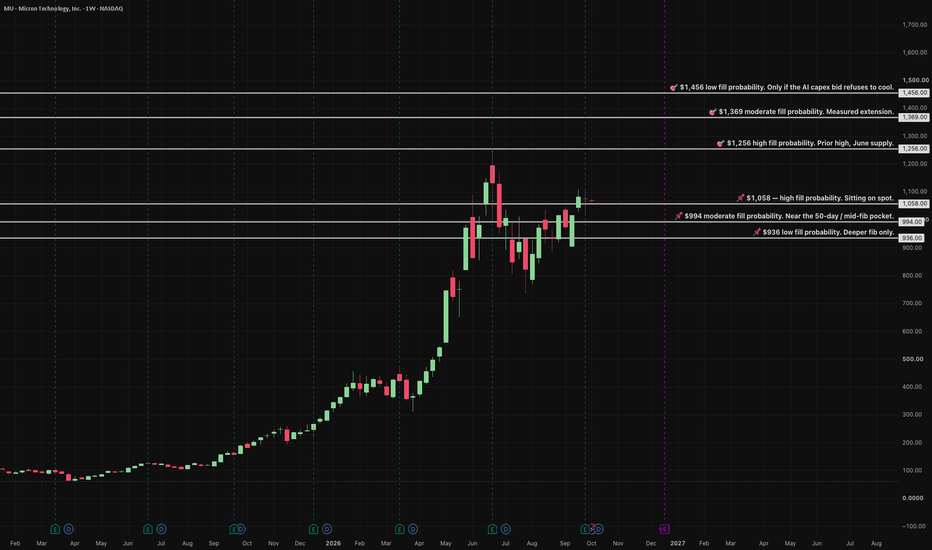
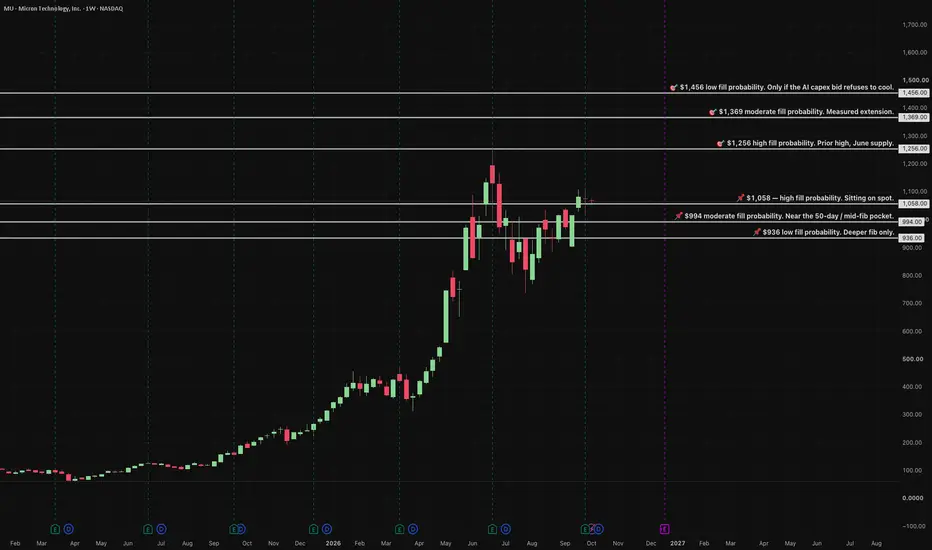
MU: Buy the Cloud Hold. Scale the Dip.GPUs get the headlines. Memory moves the tokens. Micron is the only U.S. HBM name inside that choke point. Q4 revenue $54.23B, up 31% quarter on quarter and 379% year on year. Adjusted EPS $33.42. FY2026 revenue $133.2B. Q1 guide about $61.5B and $38.15 EPS. Customer commitments roughly $32B. Most 2027 HBM already contracted, deals out toward 2030–2031. Management expects tight supply through FY2027–28. New fabs take years. Demand is outrunning supply. June 25 high $1,255. Pullback tested the I
NASDAQ:MULong
by archtaqi
1
ONEPOINT- Multi-Year Base Formation Hinting at a Structural TrenAfter spending nearly two years under a declining trendline, the stock has gradually stopped making lower lows and started building a series of higher lows and higher highs. ✅ Multi-Year Descending Trendline Under Pressure The stock has remained below a falling trendline since the 2024 peak. Every rally during this period faced rejection at lower levels. Today, price is once again approaching the same trendline, but under very different conditions. Instead of rising from weakness, it is adva
NSE:ONEPOINTLong
by SKGSpace
Updated
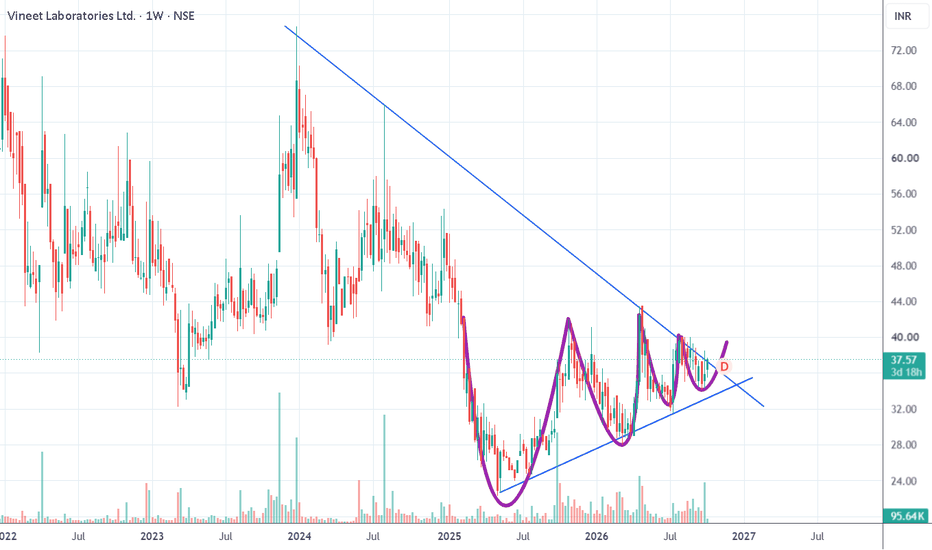
Vineet Lab(VINYLAB)–3 Failed Rallies,A nice setup worth watchingSome charts tell a story of momentum. Others tell a story of persistence. Vineet Laboratories belongs to the second category. For nearly three years, the stock has remained trapped beneath a relentless descending trendline, with every recovery eventually meeting supply and fading away. What makes the current setup interesting is not the rally itself, but the pattern that has developed beneath that resistance. ✅ Three Distinct Bottoming Cycles Since the 2025 lows, the stock has gone through mul
NSE:VINEETLABLong
by SKGSpace
Accenture (ACN) Bullish Setup — Watching $269 Upside TargetAccenture NYSE:ACN is consolidating along a rising structural retest after a strong summer recovery from its cyclical low. Price continues to hold constructive positioning around the $186.50 key horizontal support zone, with ACN currently trading near $196 on the daily timeframe. From a technical perspective, the setup remains bullish while the $183.50–$186.50 support area holds. Sustained strength above this zone could support another expansion higher, with $227 acting as the first major up
NYSE:ACNLong
by Richtv_official
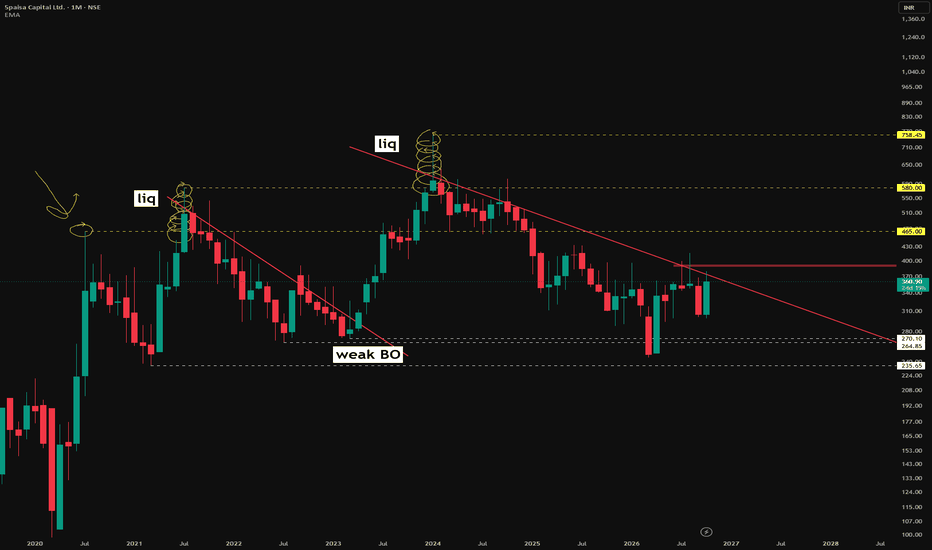
Liquidity, Market Structure and Fake Breakouts in Swing TradingLiquidity, market structure and fake breakouts are often interconnected—and understanding that relationship can change how you read a chart. In this video, I explain how I study these concepts together from a swing trader’s perspective, focusing on structure rather than reacting to every breakout. For educational purposes only. No investment recommendation or assurance of returns.
NSE:5PAISA
16:40
by Apoorv-Dubey_SEBI-RA
2
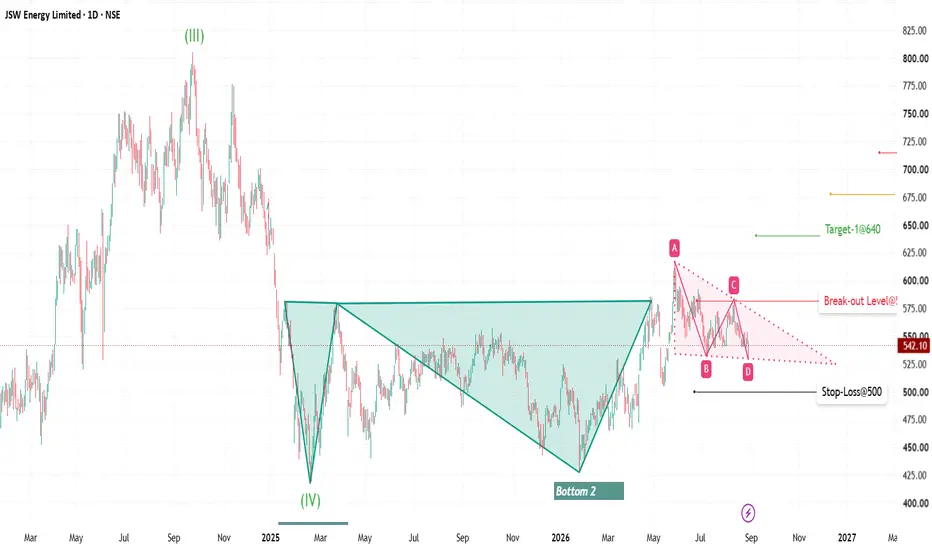
JSW Energy – Elliott Wave + Breakout Setup JSW Energy – Elliott Wave + Breakout Setup ⚡CMP: ₹542 JSW Energy is shaping up for a bullish Elliott Wave structure, supported by the price action on both the Daily, Weekly and Monthly charts. 📈 Elliott Wave View :The larger structure appears to have completed Wave (2) around the ₹179-181 zone & rise toward ₹800+ is indicative of Wave (3), followed by the current corrective/consolidation phase. The present falling-wedge formation can potentially represent the completion of Wave (4). A break
NSE:JSWENERGYLong
by DrPrashantVerma
Updated
NVDA Technical Setup: Breakout Signals 11% Upside PotentialNVDA Technical Setup: Breakout Signals 11% Upside Potential NVIDIA ( NASDAQ:NVDA ) is demonstrating a strong bullish breakout on the daily chart at current price levels. Price action indicates robust buying momentum, setting up a high-probability trade opportunity for short-to-medium-term traders. Key Trade Parameters Current Market Price (LTP): $212.00 Upside Target: $236.00 (~11% projected gain) Stop Loss (SL): $205.00 Risk-to-Reward Ratio (R:R): 1:4 Expected Timeframe: 10–15 Trading Ses
NASDAQ:NVDALong
by ChartsBoltahai
Updated
123456789101112131415161718192021222324252627282930313233343536373839404142
…999

Made by humans

Select market data provided by ICE Data Services. Select reference data provided by FactSet. Copyright © 2026 FactSet Research Systems Inc.Copyright © 2026, American Bankers Association. CUSIP Database provided by FactSet Research Systems Inc. All rights reserved. SEC filings and other documents provided by Quartr.© 2026 TradingView, Inc.

SOC 2 CompliantGDPR Compliant
More than a product
  • Supercharts
Screeners
  • Stocks
  • ETFs
  • Bonds
  • Crypto coins
  • CEX pairs
  • DEX pairs
  • Pine
Heatmaps
  • Stocks
  • ETFs
  • Crypto coins
Calendars
  • Economic
  • Earnings
  • Dividends
  • IPOs
More products
  • News Flow
  • Portfolios
  • Fundamental Graphs
  • Yield Curves
  • Options
  • Macro Maps
  • Pine Script®
  • MCP Server
Apps
  • Mobile
  • Desktop
Community
  • Social network
  • Wall of Love
  • Refer a friend
  • Creator program
  • House Rules
  • Moderators
Ideas
  • Trading
  • Education
  • Editors' picks
Pine Script
  • Indicators & strategies
  • Wizards
  • Freelancers
  • Marketplace
Tools & subscriptions
  • Features
  • Pricing
  • Market data
  • Gift plans
Trading
  • Overview
  • Brokers
  • Brokers comparison
  • The Leap
Special offers
  • CME Group futures
  • Eurex futures
  • US stocks bundle
About company
  • Who we are
  • Space mission
  • Blog
  • Help Center
  • Careers
  • Media kit
Merch
  • Tarot cards for traders
  • The C63 TradeTime
Policies & security
  • Terms of Use
  • Disclaimer
  • Privacy Policy
  • Cookies Policy
  • Accessibility Statement
  • Trust Center
  • Security tips
  • Bug Bounty program
  • Status page
Business solutions
  • Widgets
  • Charting libraries
  • Lightweight Charts™
  • Advanced Charts
  • Trading Platform
Growth opportunities
  • Advertising
  • Brokerage integration
  • Partner program
  • Education program
Community
  • Social network
  • Wall of Love
  • Refer a friend
  • Creator program
  • House Rules
  • Moderators
Ideas
  • Trading
  • Education
  • Editors' picks
Pine Script
  • Indicators & strategies
  • Wizards
  • Freelancers
  • Marketplace
Business solutions
  • Widgets
  • Charting libraries
  • Lightweight Charts™
  • Advanced Charts
  • Trading Platform
Growth opportunities
  • Advertising
  • Brokerage integration
  • Partner program
  • Education program
Look FirstLook First