This Support Has Started Major Rallies Before
LTTS is once again sitting near the 3000-3100 zone and this is not an ordinary support. The same area became a major turning point in 2022 and price later rallied towards 5800-6000. After spending years at higher levels the stock has now completed another deep correction and returned to this historical demand zone. Buyers already defended it strongly once in early 2026 and price is again approaching the same area. This is where the psychology becomes interesting. After such a long correction s
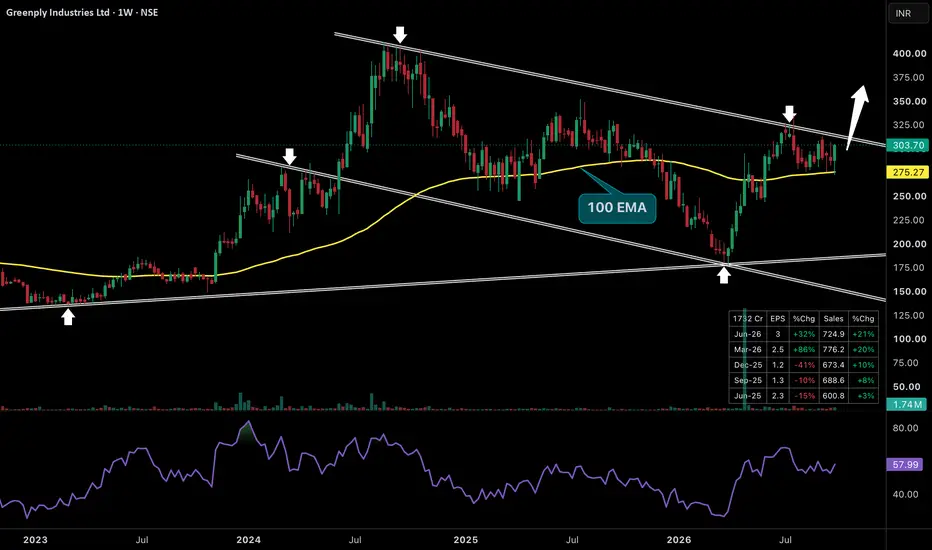
Greenply Is Quietly Preparing For Its Next ExpansionGreenply is sitting at a very important point in its long-term structure. After topping near 400 the stock spent almost two years under a falling trendline with every major recovery facing supply near this resistance. But the correction towards 180-190 in 2026 changed the character completely. Price reversed aggressively from the major rising support and recovered back above the 100 EMA around 275. Since then every dip near this moving average has attracted buyers and price is again pressing aga
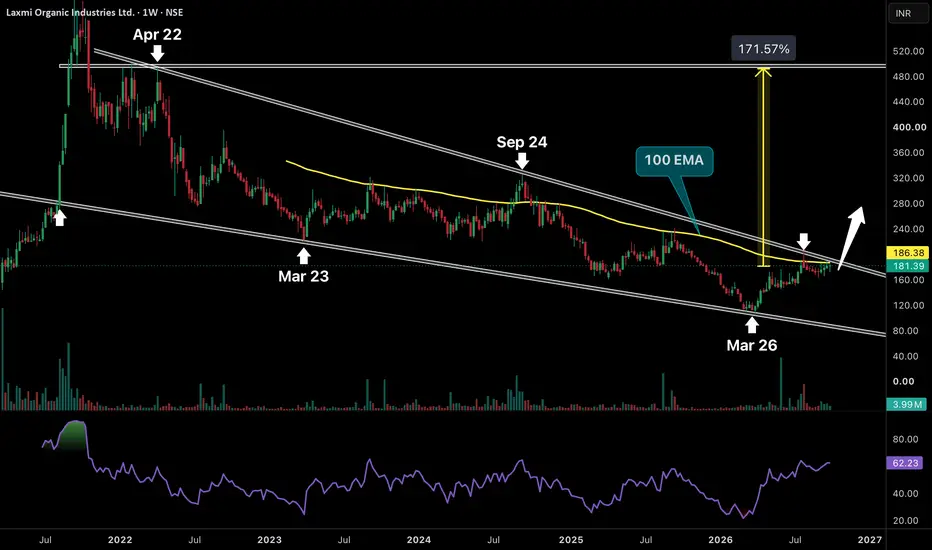
This Four-Year Downtrend Is Running Out Of SpaceLaxmi Organic has been trapped inside a massive falling channel since the Apr 2022 rejection near 500. For almost four years every meaningful recovery has eventually failed below the same declining structure while price continued forming lower highs and lower lows. But the Mar 2026 low around 110-120 is showing a different character. Buyers stepped in aggressively from the lower boundary and since then price has started building higher lows instead of immediately collapsing again. RSI has recove
A Four-Year Downtrend Is Reaching Its Breaking PointTarsons has spent almost its entire listed history inside a falling structure. From the 900+ zone price kept making lower highs and lower lows with every recovery getting rejected from the same descending trendline. But something important has changed in 2026. After forming a major bottom around 170-180 the stock reversed sharply with strong participation and has now reclaimed its long-term moving average around 280. RSI has also shifted back above 60 which shows momentum is no longer behaving l
This Long Compression Is Getting Closer To Its ExpansionThe stock is sitting inside a very large multi-year compression structure. After peaking above 800 the stock entered a long corrective phase but sellers have continuously failed to break the rising structural support underneath. At the same time every recovery is getting capped by the falling trendline. This has created a huge contracting structure with price now getting squeezed between roughly 420-450 support and the falling resistance around 520-550. The interesting part is that this base has
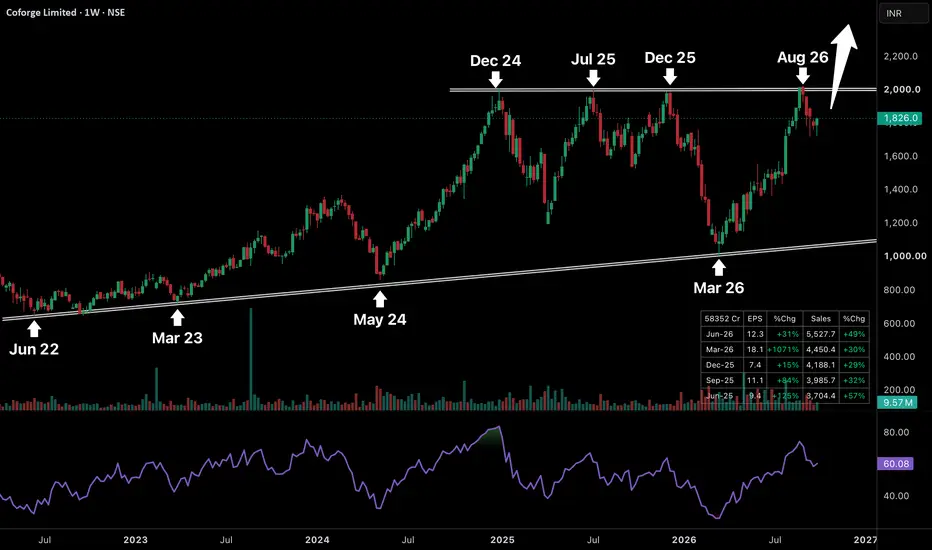
Four Rejections Later, Coforge Is Knocking AgainCoforge is building one of those structures where the longer resistance survives the more important the eventual breakout becomes. The 1980-2020 zone has rejected price repeatedly since Dec 2024 with fresh attempts in Jul 2025, Dec 2025 and again Aug 2026. But every rejection has failed to destroy the larger uptrend. The rising support that started around Jun 2022 has continued to attract buyers with major reversals around Mar 2023, May 2024 and most recently Mar 2026. That last reversal from ne
Four Years Of Compression Is Building Toward A Major MoveMphasis is sitting inside a massive multi-year compression structure that has been developing since the 2021 peak. The upper trendline has controlled every major rally since Oct 2021 and again rejected price around Dec 2024. But the important part is what has been happening underneath. Every major correction has found buyers around the rising long-term support. We saw it near Apr 2023 and once again around Mar 2026 near the 2000 zone. This means price is getting squeezed between falling long-ter
This Compression Can Turn Into A Powerful ExpansionThe stock is building a very interesting bullish structure after its massive rally. Instead of giving back the entire move price has been consolidating inside a falling resistance while the broader rising structure remains intact. The 1200-1220 area is getting defended and price has now moved back above the short-term averages with RSI also recovering. This looks more like healthy compression after a strong rally rather than complete trend exhaustion. Sellers are trying to control every bounce b
PAKOXY in great position to go up - A 70% up potentialPSX:PAKOXY Pakistan Oxygen is showing a strong fundamental turnaround, with revenue, margins and earnings accelerating significantly. FY2025 PAT increased sharply, while 1H2026 continued the trend with 22% sales growth and 87% PAT growth. The balance sheet is also strengthening as borrowings decline and liquidity improves. Most importantly, operating cash flow and free cash flow have turned strongly positive, providing support for continued investment and debt reduction.
Technicals ar
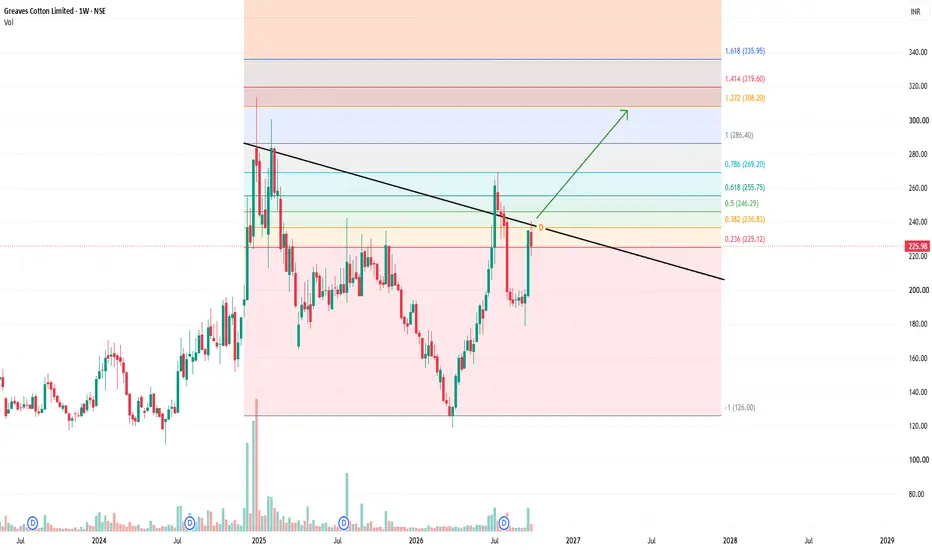
EV Turnaround Setup, Breakout PendingIdea summary: Greaves Cotton has bounced hard from its ~₹120 base and is now testing a falling trendline that has capped price since the early-2025 peak. It is trading around ₹226, just under the trendline and the 0.382 Fib at ₹236.83. A weekly close above this zone would confirm a trend reversal.
What the chart shows:
Price made a clear higher low (~₹180-190) after the ₹120 bottom, ending the series of lower lows.
The recent weekly impulse (~₹190 to ~₹238) came on a visible volume expansion,
Cochin Shipyard: Ready for Big Reversal from Strong Support?Here is my technical view on Cochin Shipyard (Weekly Chart):
• Current Price: Trading around 1,287 level.
• Support Zone: Stock is approaching a strong historic demand zone around 1,000 - 1,260.
• Expected Move: After a small consolidation/dip in this buy zone, a solid bullish bounce is expected.
• Target: Looking for a long-term target of 2,975+.
• Stop Loss: Below 796.
• Risk/Reward: Very favorable setup (RR ~ 3.69).
What are your thoughts on Cochin Shipyard?
(Disclaimer:
Cummins India – Watching the Wave 4 ReboundThe current decline appears to be progressing through a five-wave structure, with Wave (3) producing the strongest part of the move lower.
Price has now bounced into the 0.382 Fibonacci retracement near ₹4,858, with 0.5 around ₹4,894 acting as the next reference. This rebound could represent Wave (4) before the final Wave (5) decline.
A rejection from the ₹4,858–₹4,894 region would strengthen the bearish count and keep the Wave (5) scenario in play.
Breakout Beckons!Price Dynamics: The price action reveals a maturing descending wedge, compressing volatility toward a decisive resolution and signaling a major shift in market structure.
Supply and Demand: A robust horizontal support zone provides a reliable demand floor, successfully absorbing selling pressure to fuel the upside move.
Volume Surge: A notable spike in volume during the trendline breach confirms strong institutional conviction, validating the breakout and reducing the risk of false breakdown
RELIANCE — Weekly Harmonic Structure | Potential Reversal ZoneReliance is approaching an important long-term technical area after completing a large XABCD harmonic structure on the weekly timeframe.
Harmonic measurements
The structure shown on the chart has the following Fibonacci relationships:
AB / XA ≈ 0.482
BC / AB ≈ 1.289
CD / BC ≈ 1.663
AD / XA ≈ 0.895
The most technically interesting feature is the BC → CD extension of ~1.663, which sits very close to the commonly watched 1.618 Fibonacci extension. At the same time, D is returning toward the
Weekly Analysis and Stocks to Watch | October 1st week | 2026In this weeks weekly market analysis , we discuss the latest market trends about Nifty
We also discussed 2 stocks to watch, including a stock with Highest volumes ever since its listing.
Video is about how you can pick your own stocks and do your own analysis . Understanding Price action and Market structure .
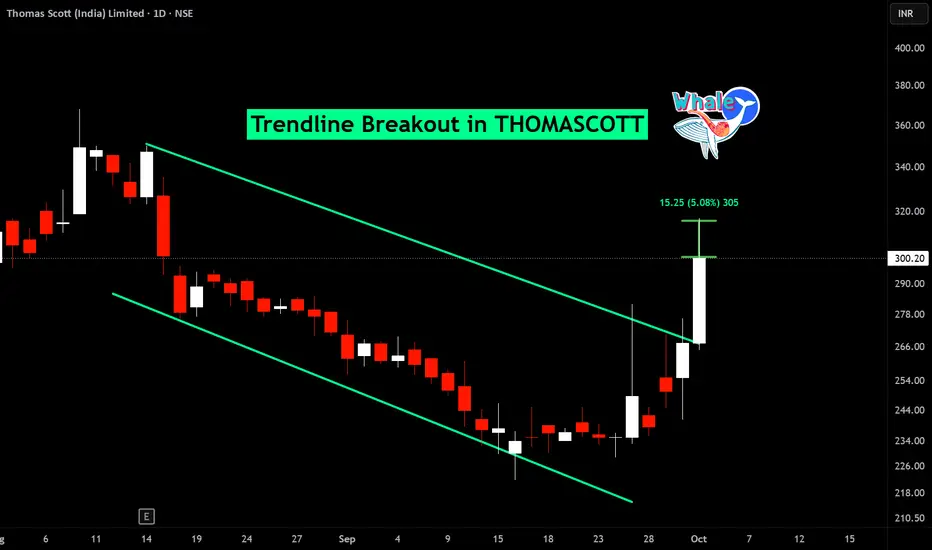
BUY TODAY SELL TOMORROW for 5%DON’T HAVE TIME TO MANAGE YOUR TRADES?
- Take BTST trades at 3:25 pm every day
- Try to exit by taking 4-7% profit of each trade
- SL can also be maintained as closing below the low of the breakout candle
Now, why do I prefer BTST over swing trades? The primary reason is that I have observed that 90% of the stocks give most of the movement in just 1-2 days and the rest of the time they either consolidate or fall
Trendline breakout in THOMASCOTT
BUY TODAY SELL TOMORROW for 5%
CHOLAFIN – Bullish Harmonic Reversal SetupThe chart shows a potential XABCD harmonic reversal structure developing on the daily timeframe, with D forming inside a major demand/PRZ zone around ₹1,480–₹1,520.
🔹 Harmonic structure
X: ~₹1,445 — major swing low
A: ~₹1,875 — first major impulsive high
B: ~₹1,650 — retracement
C: ~₹1,955 — higher swing high
D: ~₹1,480 — projected reversal area
The displayed Fibonacci relationships are approximately:
AB/XA = 0.499
BC/AB = 1.361
CD/BC = 1.571
AD/XA = 0.886
The 0.886 XA retracement
Reliance - Weekly - HARMONIC PATTERNSpotted- Bullish harmonic pattern in Reliance on the Weekly time frame
Observe whether it respects the harmonic levels.
Study-Practice-sharing
Educational purpose only.
This is not a recommendation.
I am not SEBI registered - Do not TRADE/INVEST based on what I publish here.
I am not responsible for your loss or gain.
NESTLEIND - DAILY - HARMONIC PATTERNSpotted- Bullish harmonic pattern in NESTLEIND on the daily time frame
Observe whether it respects the harmonic levels.
Study-Practice-sharing
Educational purpose only.
This is not a recommendation.
I am not SEBI registered - Do not TRADE/INVEST based on what I publish here.
I am not responsible for your loss or gain.
LTF - DAILY - HARMONIC PATTERNSpotted- Bullish harmonic pattern in LTF on the daily time frame
Observe whether it respects the harmonic levels.
Study-Practice-sharing
Educational purpose only.
This is not a recommendation.
I am not SEBI registered - Do not TRADE/INVEST based on what I publish here.
I am not responsible for your loss or gain.
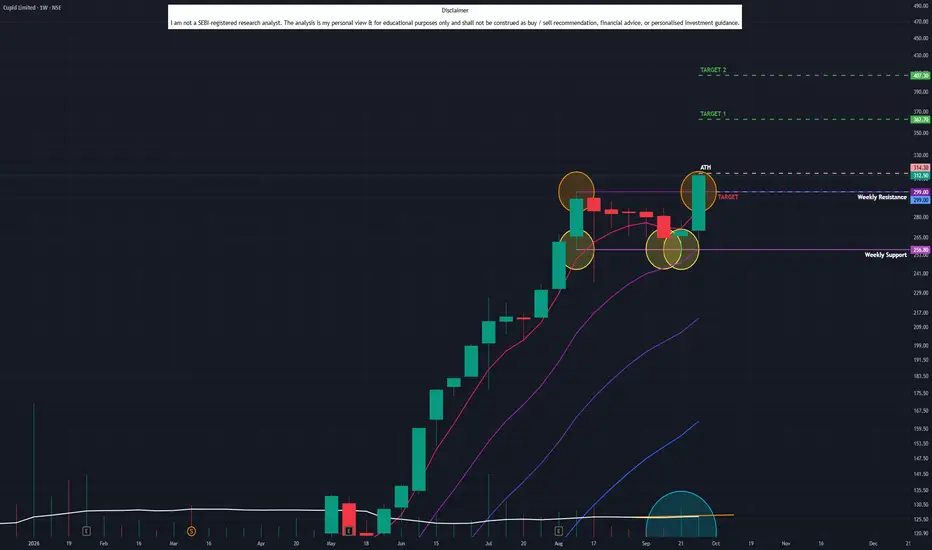
Cupid Ltd (W): ALL-TIME HIGH BREAKOUTTimeframe: Weekly | Chart Scale: Logarithmic
Explosive +15.74% weekly surge hitting a new A TH of 314.30! 🔥
Technical Highlights:
✅ Breakout: Cleared & closed above short-term horizontal resistance (active since Aug '26).
✅ Volume Reversal: Massive 141.76M volume spike confirming the breakout!
✅ Momentum: Short-term EMAs in positive crossover (Daily/Weekly/Monthly). MACD & RSI rising. 🚀
Key Levels to Watch:
🎯 Target 1: 362
🎯 Target 2: 407 (Extended momentum)
🛡️ Suppor