• Products
  • Community
  • Markets
  • Brokers
  • More
Get started
  • Markets
  • /World stocks
  • /Ideas
SMSPHARMA Multi-Month Resistance Breakout on Weekly TimeframeSMS Pharmaceuticals Limited has demonstrated a strong bullish market structure on the weekly timeframe. After an extended period of upward momentum, the price has successfully broken out and closed above a critical multi-month resistance zone marked at 431.70. The recent bullish candles are accompanied by significant volume spikes, validating the strength of the breakout and indicating strong institutional or market interest. The previous swing resistance around 387.10 was successfully flippe
NSE:SMSPHARMA
by ParamjitMahapatro
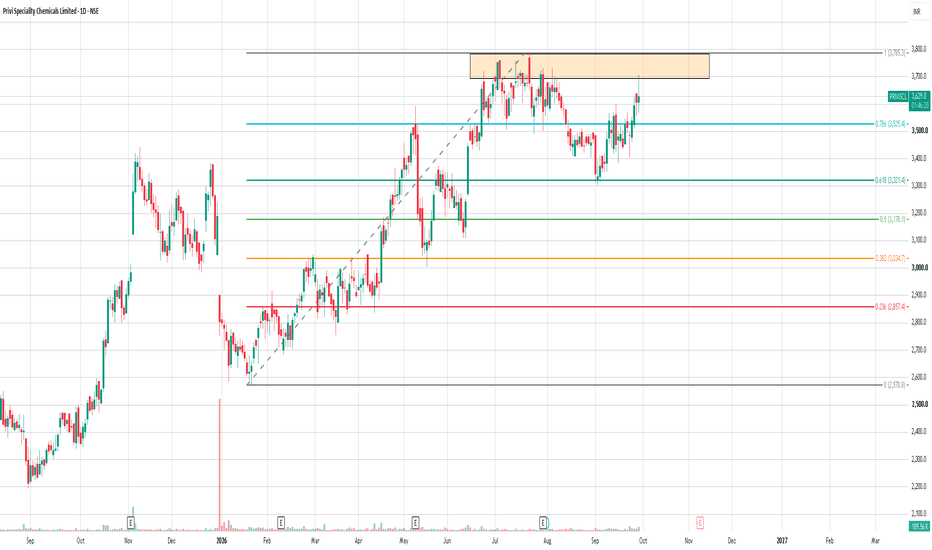
Privi Specialty Chemicals — Weekly Fibonacci AnalysisThe stock has maintained a strong recovery structure after finding support near the lower Fibonacci zones. Price has moved back above the 0.618 Fib at ₹3,321 and has now reclaimed the important 0.786 Fib at ₹3,525, indicating improving bullish momentum. However, price is now approaching a major supply/resistance zone between ₹3,700–₹3,785, which also aligns with the 1.0 Fibonacci level at ₹3,785. This is the key area to watch. 🔼 Bullish scenario: A strong weekly close above ₹3,785, follo
NSE:PRIVISCLLong
by LogicTradeRoom
SUNFLAG Multi-Month Rectangle Breakout with Volume ConfirmationAs seen on the daily timeframe, Sunflag Iron & Steel Co. Ltd. has just staged a powerful breakout from a prolonged consolidation phase. Since early May, the stock has been trapped in a distinct rectangle pattern, oscillating between a solid support zone around the 320-330 levels and a strict resistance ceiling near 420. Over the last few trading sessions, price action has aggressively breached the 420 resistance level, currently trading around 462.60. What makes this breakout highly reliable
NSE:SUNFLAG
by ParamjitMahapatro
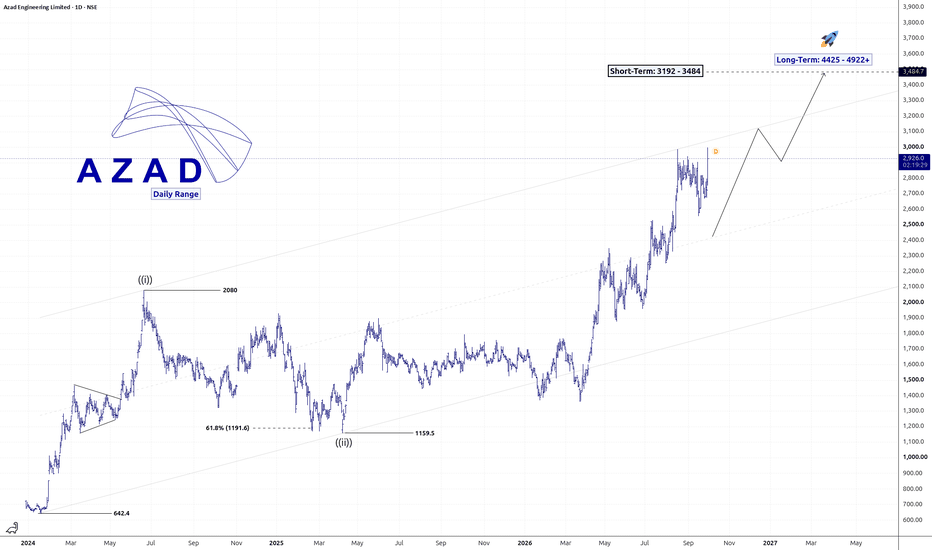
AZAD: 3000 Breakout Could Test 3192 – 3484📊️ NSE Azad Engineering Stock: Wave (iii) in Progress NSE:AZAD appears to be developing a potentially larger impulsive advance on the daily chart. Wave (i): 642.40 → 2080 Wave (ii): 2080 → 1159.50 The decline into 1159.50 held well above the origin of Wave (i), keeping the larger bullish impulse structure technically intact. The current advance from 1159.50 is being considered as a potential Wave (iii). Price is now approaching an important resistance area around 2900–3000. Recent
NSE:AZADLong
by moneymunch
Syncom Formulation (SYNCOMF): TECHNICAL + FUNDAMENTAL ANALYSISNSE:SYNCOMF | Timeframe: 1W | Type: Long / Educational 📌 Technical view Syncom Formulation is on the weekly chart at ₹25.23, up about 25.8% for the week. Price has broken above the falling trendline that has capped it since the Aug 2024 peak. Wave 1: rally from about ₹5.5 to the Aug 2024 high near ₹28. Wave 2: a long, corrective drift lower into the early-2026 low near ₹10.5. The move lasted about 76 bars and formed a lower-highs structure. Wave 3 (in progress?): a strong reversal from the wa
NSE:SYNCOMF
by hardeepssethi
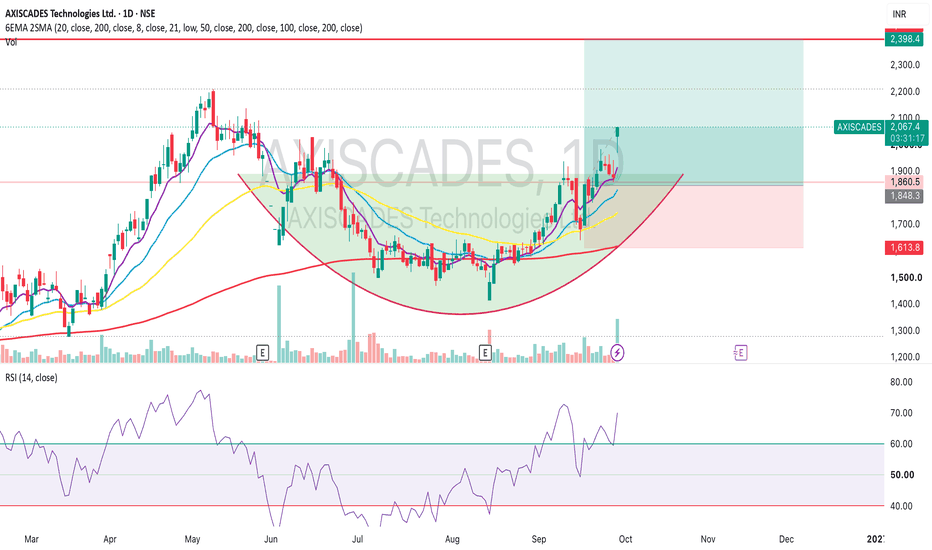
AXISCADES - Bullish Pick from the Defense spaceNIFTY DEFENSE is one of the thematic sectors which seem to be doing well despite a struggling market. AXISCADES is one such stock which falls under the Small - Micro cap space. The stock is having an extremely good Bullish momentum on the higher time frames like Monthly & Weekly charts. After the peak formed in May 2026, there has been a good consolidation since the last 3-4 months and now the stock is breaking out from a base. In fact today it has hit a 10% upper circuit as well! A pot
NSE:AXISCADESLong
by Sky_Tracer
#DCAL1. Price Action & Current Status Current Close: ₹163.65 (−0.62 / −0.38%) Session Range: Opened at ₹164.30, touched a high of ₹166.49, and pulled back to an intraday low of ₹163.65, closing near the low of the session. Structure: After a sharp breakdown candle from the ₹174+ zone, the stock has printed a small continuation candle, testing immediate support levels as sellers maintain pressure. 2. Key Technical Levels Immediate Resistance: ₹166.49: Today's session high and immediate intraday hu
NSE:DCAL
by krishnakhanna
#GRAUWEIL1. Price Action & Current Status Current Close: ₹82.70 (−5.32 / −6.04%) Session Range: Opened at ₹88.60, touched a high of ₹88.75, and pulled back sharply to a low of ₹82.26, closing near the bottom of the range. Structure: After a strong impulsive rally from the ₹70–₹74 base, the stock has printed a wide-range red continuation/reversal candle, signaling immediate profit booking and a cooling-off period near recent highs. 2. Key Technical Levels Immediate Resistance: ₹88.75: Today's session
NSE:GRAUWEIL
by krishnakhanna
#RELIANCE1. Price Action & Current Status Current Close: ₹1,191.00 (−35.00 / −2.85%) Session Range: Opened at ₹1,218.00, touched a high of ₹1,219.70, and slipped to a low of ₹1,190.50, closing near the bottom of the range. Structure: The stock has printed a solid red continuation candle following a series of lower highs and lower lows, breaking cleanly below recent consolidation bands. 2. Key Technical Levels Immediate Resistance: ₹1,218.00 – ₹1,219.70: Today's open and immediate intraday supply hurd
NSE:RELIANCE
by krishnakhanna
#KABRAEXTRU1. Price Action & Current Status Current Close: ₹820.00 (+219.70 / +36.60%) Session Range: Opened at ₹603.30, surged aggressively to an intraday high of ₹888.70, pulled back to a low of ₹552.35, and settled firmly in the upper half of the range. Structure: The stock has printed a massive impulsive green expansion candle, breaking out sharply from the consolidation base established over the previous months. 2. Key Technical Levels Immediate Resistance: ₹888.70: Today's session high and immedi
NSE:KABRAEXTRU
by krishnakhanna
#BBTCImmediate Resistance: ₹1,435.20 – ₹1,435.30: Today's open/high and immediate intraday supply hurdle. ₹1,500.00 – ₹1,550.00: Major overhead resistance zone marking the previous range floor. Key Support Levels: ₹1,388.00: Current session low and immediate critical defense level. ₹1,350.00 – ₹1,300.00: Deeper structural support zone established earlier in the year.
NSE:BBTC
by krishnakhanna
#GUJAPOLLO1. Price Action & Current Status Current Close: ₹341.45 (+12.35 / +3.75%) Session Range: Opened at ₹331.15, climbed to a high of ₹362.00, dipped to a low of ₹327.85, and settled in the upper half of the range. Structure: After drifting lower from earlier swing peaks above the ₹440–₹460 zone, the stock has printed a solid green recovery candle off the recent lower support area, reflecting short-term buying interest. 2. Key Technical Levels Immediate Resistance: ₹362.00: Today's session high a
NSE:GUJAPOLLO
by krishnakhanna
#AVALON1. Price Action & Current Status Current Close: ₹2,253.30 (−120.00 / −5.06%) Session Range: Opened at ₹2,370.10, surged to a high of ₹2,618.00, but faced heavy selling pressure down to a low of ₹1,980.00 before closing near the middle of the range. Structure: After a steep multi-week impulsive rally, the stock has printed a wide-range red candle with a long lower shadow, highlighting intense intraday volatility and profit-taking at higher levels. 2. Key Technical Levels Immediate Resistance:
NSE:AVALON
by krishnakhanna
#ALKALI1. Price Action & Current Status Current Price: ₹89.85 (down approximately −4.34% to −4.97%) Session Range: Opened at ₹93.70, touched a high of ₹96.20, and pulled back to a low of ₹89.24. Structure: After a sharp impulsive rally from the ₹64.00 base in early September, the stock has formed consecutive red correction candles, signaling profit-taking and a cooling-off period near psychological support. 2. Key Technical Levels Immediate Resistance: ₹96.20: Today's session high and immediate int
NSE:ALKALI
by krishnakhanna
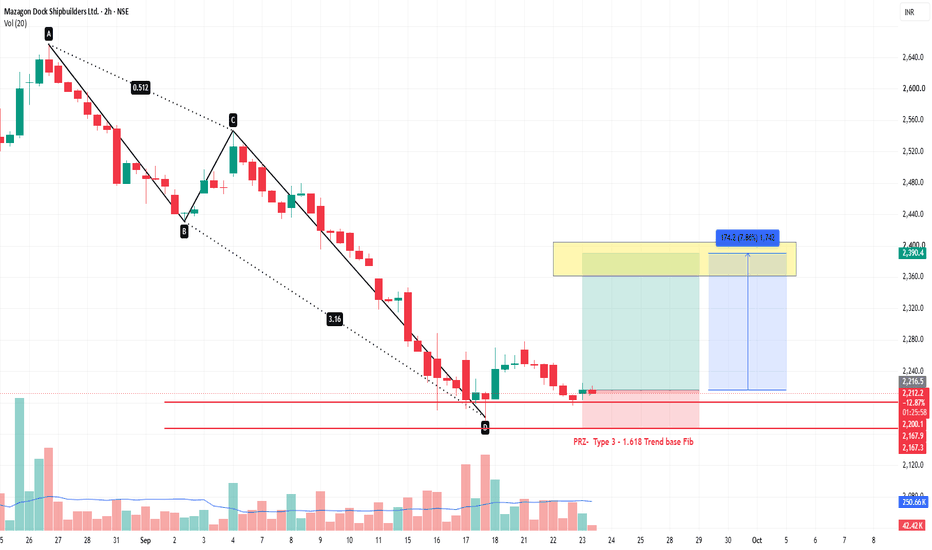
Mazagon Dock Shipbuilders Ltd — 2HTF HARMONIC Setup ABCD Pattern## 🚢 Mazagon Dock Shipbuilders Ltd. — 2H Technical Setup Mazagon Dock is showing a **potential bullish reversal setup** after a prolonged decline. The chart marks a **PRZ / Type-3 harmonic zone** around the ₹2,200–₹2,217 area, where price has started consolidating. ### 📊 Key Levels * **CMP:** ₹2,217 * 🟢 **Entry Zone / PRZ:** ₹2,200–₹2,217 * 🟢 **Reversal Support ZONE / PRZ:** ₹2,200 – ₹2,167 * 🔴 **Major support:** ₹2,167–₹2,168 * 🎯 **Resistance / Target Zone:** ₹2,360–₹2,400 * **Projected move
NSE:MAZDOCKLong
by KMKB
Updated
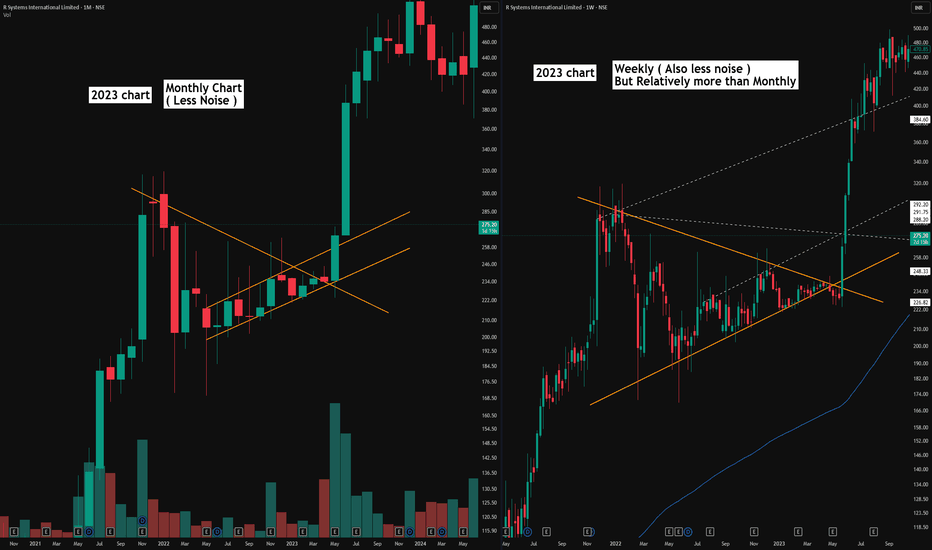
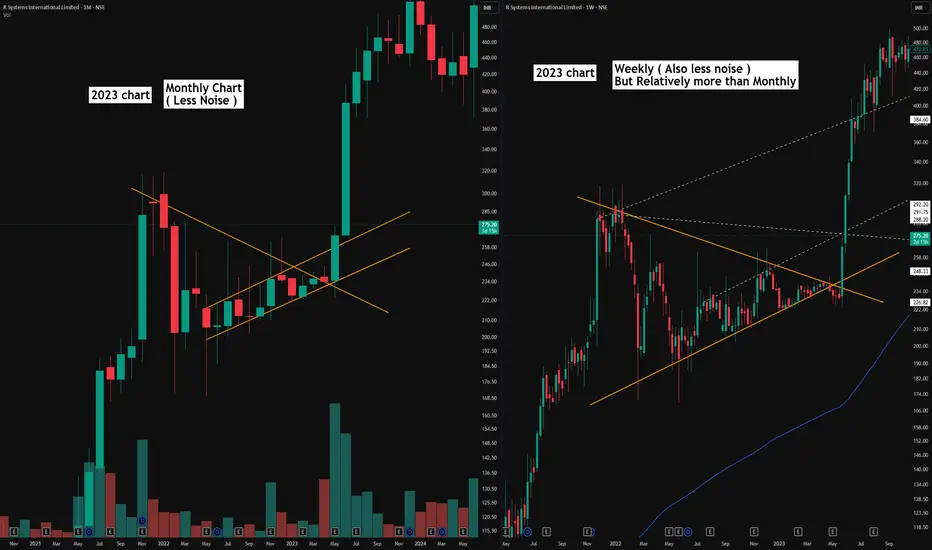
Your Chart Isn’t Difficult - Your Timeframe Might BeHistorical 2023 chart shared strictly for educational purposes to explain multi-timeframe technical analysis. No current market view or recommendation is being expressed. Sometimes the problem isn't the chart. It’s the timeframe you're trying to read it on. This historical 2023 example shows the same market structure from two different perspectives.. Weekly vs Monthly. On the Weekly chart , there is naturally more information. More candles create more visible swings, potential support/resis
NSE:RSYSTEMSLong
by Apoorv-Dubey_SEBI-RA
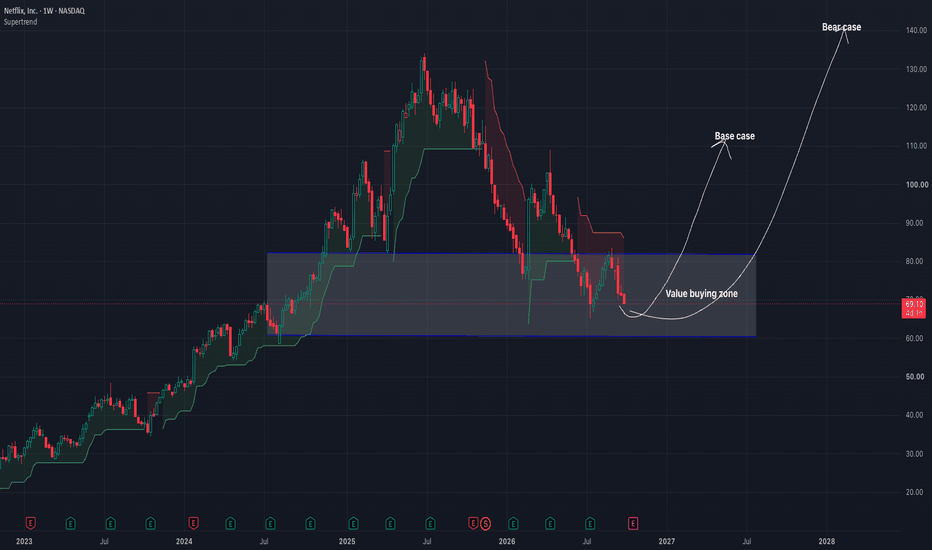
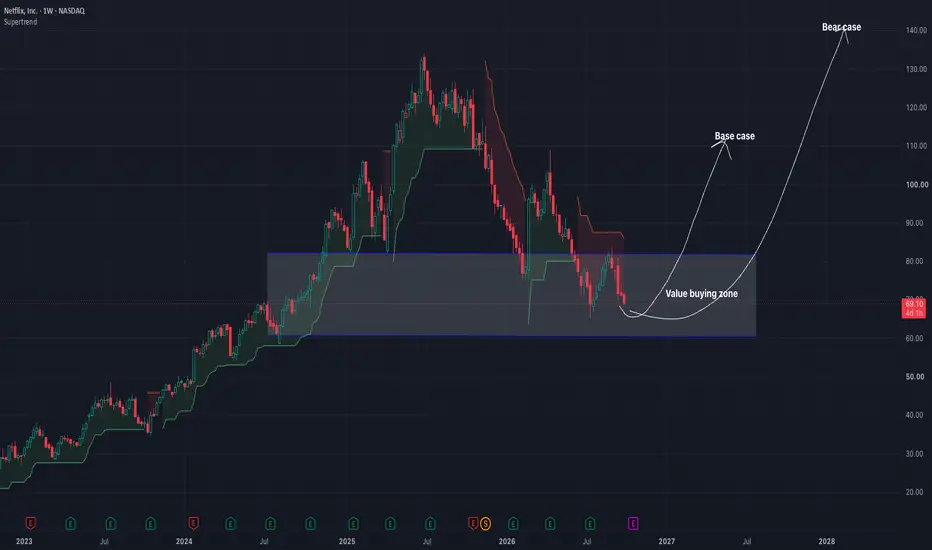
NFLX: Robust Content Slate and Value Zone Rebound Signal Strong Keeping our market focus exclusively on Netflix (NFLX), the stock presents a highly attractive risk-reward profile that reinforces our strong bull bias. The weekly chart illustrates a well-defined "Value buying zone" spanning the $60 to $80 region. This heavy consolidation block establishes a formidable technical floor, signaling sustained accumulation. Fundamentally, the company's growth engine remains exceptionally strong. The recent massive streaming debut of Monster: The Lizzie Borden Sto
NASDAQ:NFLXLong
by aditya_biswas
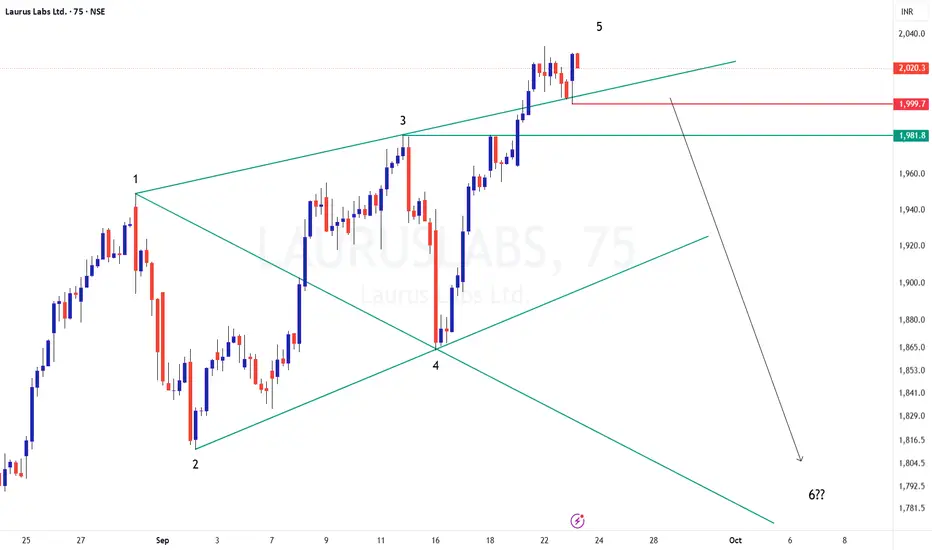
WOLFEWAVE FORMATION in LAURUSLABSCMP: 2022 TF: 75 minutes Drawings are self explanatory. Will have to wait for the price to come back inside the upper trendline to take the trade... with SL at price closing above that TL or Swing high Could be a good set up for Oct series Disclaimer: I am not a SEBI registered Analyst and this is not a trading advise. Views are personal and for educational purpose only. Please consult your Financial Advisor for any investment decisions. Please consider my views only to get a different per
NSE:LAURUSLABS
by Murthy_Santhosh
Updated
2
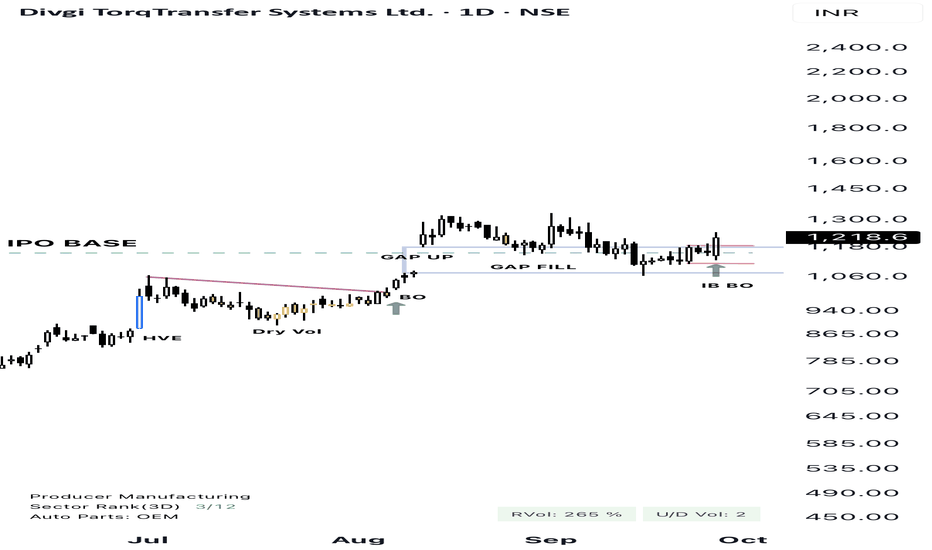
DIVGIITTS IPO base breakoutStock broke out of base to ATH with high volume and gap up followed by consolidation on low volumes. Bouncing off 40ma with an inside bar breakout.
NSE:DIVGIITTSLong
by SP9070
SMCGLOBALSMCGLOBAL is showing a bullish market structure with a clear Higher High–Higher Low (HH-HL) formation. After making a low near 54, the stock gradually recovered and faced resistance around the 74 zone. It eventually gave a strong breakout with volume, followed by a controlled pullback, which is a healthy sign in an uptrend. Price has successfully taken support above the previous resistance, indicating that resistance has now turned into support. The EMAs are well aligned, and today's bullish
NSE:SMCGLOBAL
by SatpalS
Updated
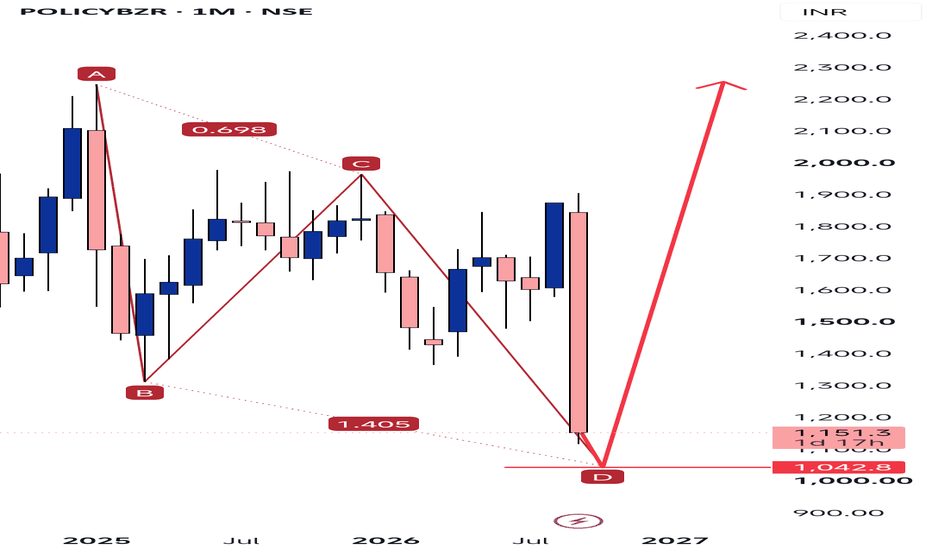
POLICYBZR — Monthly Technical Analysis POLICYBZR | 1M | NSE | CMP: ₹1,151 The monthly chart is approaching a major long-term structural support around ₹1,043, marked as D on the chart. The price action from A → B → C → D shows a large corrective structure, and the current zone is important for determining whether a long-term reversal develops. 🔹 1. A–B–C–D Structure A: ~₹2,300 B: ~₹1,300 C: ~₹1,950 D: ~₹1,043 Current price: ₹1,151 The decline from A → B was followed by a substantial recovery toward C, but the subsequent C
NSE:POLICYBZRLong
by Imdx_HKR
Elecon Engineering — 4H Technical Setup Current price: ₹479 Chart: 4H | NSE What the chart shows: Price has made a strong recovery from the ₹402–420 zone. A sharp bullish move has taken price back toward the ₹458–486 demand/resistance area. Price is currently around ₹479, sitting inside this zone, so confirmation is important before calling a breakout. The next major resistance/supply zone is approximately ₹540–556. The chart also marks the previous high around ₹576. 🎯 Levels shown on the chart Level Significance ₹458–486 Cu
NSE:ELECON
by DattuAtp
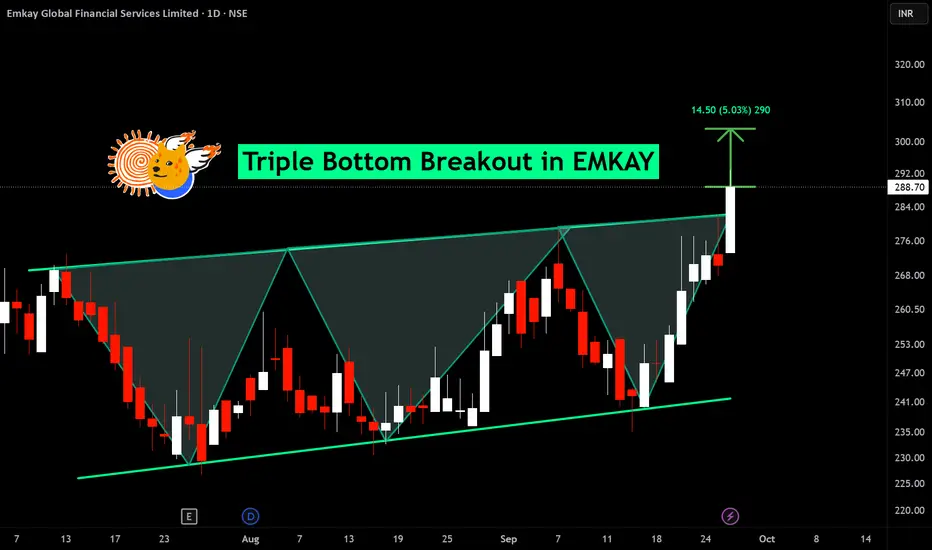
BUY TODAY SELL TOMORROW for 5%DON’T HAVE TIME TO MANAGE YOUR TRADES? - Take BTST trades at 3:25 pm every day - Try to exit by taking 4-7% profit of each trade - SL can also be maintained as closing below the low of the breakout candle Now, why do I prefer BTST over swing trades? The primary reason is that I have observed that 90% of the stocks give most of the movement in just 1-2 days and the rest of the time they either consolidate or fall Triple bottom breakout in EMKAY BUY TODAY SELL TOMORROW for 5%
NSE:EMKAY
by Kapil-Mittal
2
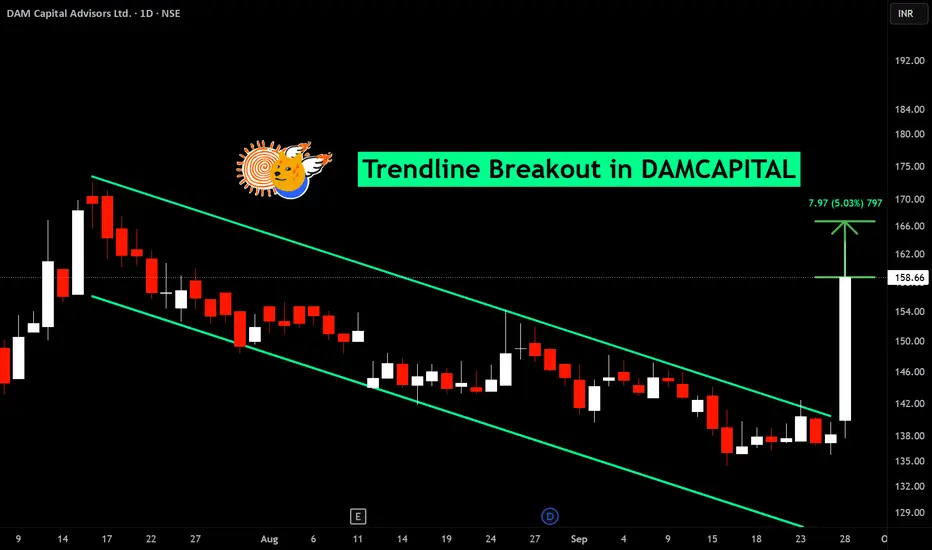
BUY TODAY SELL TOMORROW for 5%DON’T HAVE TIME TO MANAGE YOUR TRADES? - Take BTST trades at 3:25 pm every day - Try to exit by taking 4-7% profit of each trade - SL can also be maintained as closing below the low of the breakout candle Now, why do I prefer BTST over swing trades? The primary reason is that I have observed that 90% of the stocks give most of the movement in just 1-2 days and the rest of the time they either consolidate or fall Trendline breakout in DAMCAPITAL BUY TODAY SELL TOMORROW for 5%
NSE:DAMCAPITAL
by Kapil-Mittal
2
123456789101112131415161718192021222324252627282930313233343536373839404142
…999

Made by humans

Select market data provided by ICE Data Services. Select reference data provided by FactSet. Copyright © 2026 FactSet Research Systems Inc.Copyright © 2026, American Bankers Association. CUSIP Database provided by FactSet Research Systems Inc. All rights reserved. SEC filings and other documents provided by Quartr.© 2026 TradingView, Inc.

SOC 2 CompliantGDPR Compliant
More than a product
  • Supercharts
Screeners
  • Stocks
  • ETFs
  • Bonds
  • Crypto coins
  • CEX pairs
  • DEX pairs
  • Pine
Heatmaps
  • Stocks
  • ETFs
  • Crypto coins
Calendars
  • Economic
  • Earnings
  • Dividends
  • IPOs
More products
  • News Flow
  • Portfolios
  • Fundamental Graphs
  • Yield Curves
  • Options
  • Macro Maps
  • Pine Script®
  • MCP Server
Apps
  • Mobile
  • Desktop
Community
  • Social network
  • Wall of Love
  • Refer a friend
  • Creator program
  • House Rules
  • Moderators
Ideas
  • Trading
  • Education
  • Editors' picks
Pine Script
  • Indicators & strategies
  • Wizards
  • Freelancers
  • Marketplace
Tools & subscriptions
  • Features
  • Pricing
  • Market data
  • Gift plans
Trading
  • Overview
  • Brokers
  • Brokers comparison
  • The Leap
Special offers
  • CME Group futures
  • Eurex futures
  • US stocks bundle
About company
  • Who we are
  • Space mission
  • Blog
  • Help Center
  • Careers
  • Media kit
Merch
  • Tarot cards for traders
  • The C63 TradeTime
Policies & security
  • Terms of Use
  • Disclaimer
  • Privacy Policy
  • Cookies Policy
  • Accessibility Statement
  • Trust Center
  • Security tips
  • Bug Bounty program
  • Status page
Business solutions
  • Widgets
  • Charting libraries
  • Lightweight Charts™
  • Advanced Charts
  • Trading Platform
Growth opportunities
  • Advertising
  • Brokerage integration
  • Partner program
  • Education program
Community
  • Social network
  • Wall of Love
  • Refer a friend
  • Creator program
  • House Rules
  • Moderators
Ideas
  • Trading
  • Education
  • Editors' picks
Pine Script
  • Indicators & strategies
  • Wizards
  • Freelancers
  • Marketplace
Business solutions
  • Widgets
  • Charting libraries
  • Lightweight Charts™
  • Advanced Charts
  • Trading Platform
Growth opportunities
  • Advertising
  • Brokerage integration
  • Partner program
  • Education program
Look FirstLook First