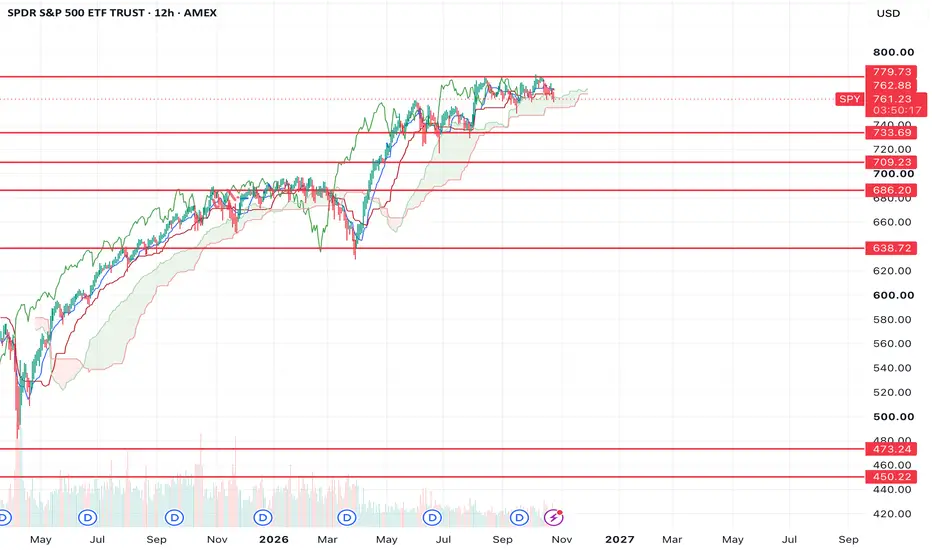
$SPY path for correctionSPY looks to be starting a larger correction here.
I think the first leg will take us down to the $638-686 support levels which would setup a larger bounce (needs to break below $733 for this to play out).
Then if we can't break above the 733 level on a bounce higher, it sets up a trap for a move lower down to the lower support levels down in the $473-450 for the final bottom.
A break above the recent highs would invalidate the idea.
In order for this idea to play out, I think we need to s
ETF market
Cross first, print second: MU, TSLA, and the AAPL spikeDay three of the flush, and the indices spent the morning testing demand. Three prints fired across the watchlist. Two paid, one was a trap — and the difference was never the print. It was the 5m SMI golden cross underneath it.
The rule this tape keeps teaching: the print marks the zone. The cross is the entry — and only when the cross comes out of a genuine cool-off at the lows. A cross that arrives any other way is decoration.
MU — the real cross. Micron's flush finished overnight: a Thursda
Opening: UNG April 17th 6C/December 18th -11C Long Call Diagonal... for a 3.32 debit.
Comments: Seasonal natty gas play around peak injection with plenty of time to work out. Buying the 90 delta back month and selling the front month such that it pays for all of the extrinsic in the long and results in a break even that is at or slightly below where the underlying is currently trading.
Metrics:
Max Profit: 1.68 ($168)
Max Loss/Buying Power Effect: 3.32 ($332)
ROC at Max: 50.6%
Will generally look to roll out the short call on approaching worthless to r
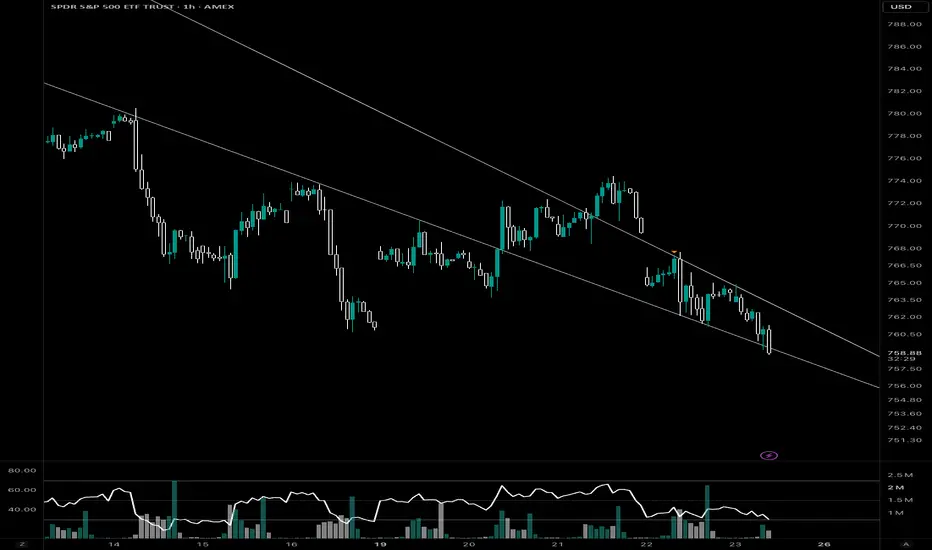
Spy WedgeNeutral 1h read on SPY:
**Structure:** Price is trading inside a well-defined descending channel since the high near 780. You have a series of lower highs along the upper trendline and lower lows - classic downtrend structure on this timeframe.
**Recent action:** After the bounce to ~774 that failed at the upper trendline, price broke back below it and has been stair-stepping down. The last 3 sessions show rejection near 767 and now price is pressing the lower boundary of the channel.
**Momen
GLD: four closes under its October pivot, monthly target nextGLD closed Thursday at 369.02, its fourth daily close in a row under the October and Q4 pivot at 381.91, so the monthly, quarterly and yearly bias all point down. Thursday’s drop also took it under the bottom of its short-term range. The next level below is the monthly target at 358.55. On my side the trend reading is bearish, so I’m not trying to catch this one: a daily close back above 381.91 is what would change my mind. Gold has been trading with tech this month rather than against it, which
SPY Is Testing 762.57 After Losing 765.52.SPY Is Testing 762.57 After Losing 765.52.
SPY closed Thursday at 763.96, under 765.52, and is trading near 762.30 premarket - just under the 762.57 shelf and above Thursday's 761.17 low. The hourly structure has turned back up to a transitional bull read while its traffic light stays red, and the 4H light is green while its structure has turned down. The timeframes have traded places overnight, and premarket prices are not closes.
Resistance: 763.96 - Thursday's close
Key resistance: 765.52 -
I PAID FOR THE SIGNALS. THE MARKET MADE ME PAY FOR THE LESSONS.I PAID FOR THE SIGNALS. THE MARKET MADE ME PAY FOR THE LESSONS.
Paid trading rooms. Options lottos. Social-media hype. Hundreds of discarded indicators. And the surprisingly difficult process of learning to become a better trader.
I'm beginning to see some real progress in my trading.
Not the kind of progress that makes for exciting social-media screenshots. I'm talking about making $90 on a 25-share swing trade over two days and feeling genuinely good about it.
Or taking a $42 loss across t
$SPY & $SPX — Levels for Friday, October 23, 2026🔮 AMEX:SPY & SP:SPX — Levels for Friday, October 23, 2026
📊 Key U.S. Economic Data (ET)
9:45 AM | Flash Manufacturing PMI | Forecast: 55.4 | Previous: 55.9
9:45 AM | Flash Services PMI | Forecast: 57.9 | Previous: 58.8
10:00 AM | Revised UoM Consumer Sentiment | Forecast: 46.3 | Previous: 46.3
10:00 AM | Revised UoM Inflation Expectations | Previous: 4.7%
⚠️ For informational purposes only. Not financial advice.
📌 #SPY #SPX #PMI #ConsumerSentiment #InflationExpectations
$SOX: Green Volume Illusion & The Trap DoorHigher time frame candles can be outright deceptive if you only look at the color. This goes for Monthly, weekly, daily, etc,. Take today on the one hour chart. You see a massive green volume bar right at the opening bell. Looks like heavy buying at first glance, right?
Drop down to the one minute chart and the real story appears. That volume was selling, with big players hitting bids and unloading right into the open. The hourly candle only printed green because price closed a hair above a ste
Stochastic Divergence in MAGS = Broadening?Breadth has looked terrible over the last couple months, with 50-day and 200-day breadth both under a bullish bias since early-mid September. As it stands today, 34.8% of stocks are trading above their 50-day moving average while 44% are above their 200-day moving average.
Over this same period, megacap tech stocks (MAGS) hit new highs and pulled the index up alongside it. There were headlines about extreme concentration in names like MSFT while the average stock fared much worse.
What we're
SPY coiled at 762: rich premium, flat path. Fade or flush?When options price a bigger move than the chart expects, the whole trade changes shape. 👇
📊 The read: SPY sits near 762 on the 1H chart. The pinned model path drifts sideways to about 764.4 by Oct 23, 10 AM, a range of only -0.21% to +0.10%. The shaded band (about ±0.58% per hourly step) is the honest part: it shows how wide things can get.
🧭 Why it matters: into mega-cap earnings, the at-the-money straddle tells you the implied move. Hold it up against the band. If the implied move is far wid
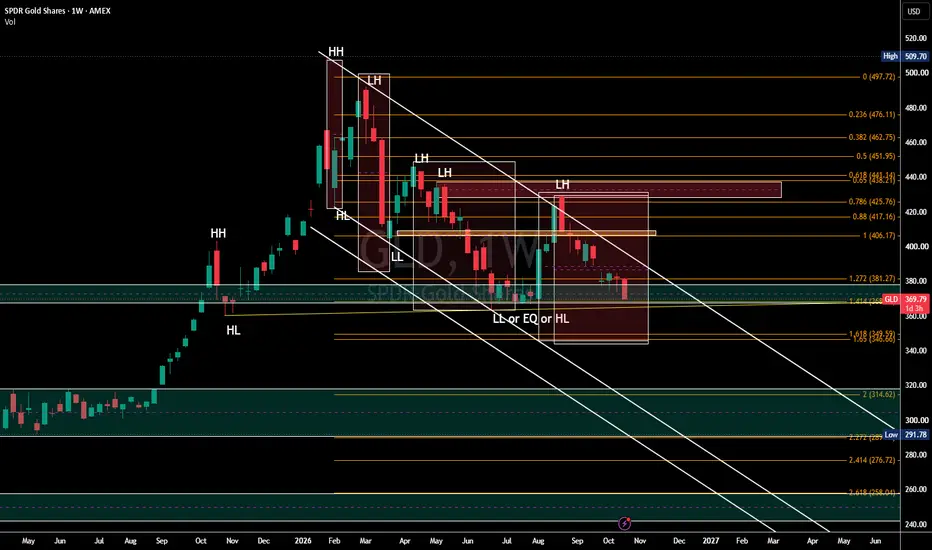
GLD | Gold's Weekly Structure Is Deteriorating ?GLD | Gold's Weekly Structure Is Deteriorating — Is Another Major Leg Down Coming?
**Ticker:** AMEX:GLD
**Timeframe:** Weekly (1W)
**Bias:** Bearish — Watching for Support Breakdown
Gold has been under sustained selling pressure, and the weekly chart is beginning to tell a compelling story.
Following its major peak near **$509.70**, GLD has established a sequence of **Lower Highs (LH)**, with price repeatedly failing to reclaim previous supply zones.
The descending trendline continues t
Biotech Bubble?🧬 Biotech Bubble? 🫧
Is the biotech sector putting in a generational top?
The long-term 3W chart of AMEX:XBI suggests that possibility, and I've taken a long position in AMEX:LABD to capitalize on a potential downturn.
There's more to this trade than a bearish chart pattern. Between AMEX:LABD 's extraordinary volume, elevated short interest, and a developing reversal formation, the setup is becoming increasingly compelling.
1. AMEX:XBI — A Generational Double Top?
The headline cha
QQQ back at its monthly target downQQQ closed Friday at 709.80, under its monthly target down at 718.40 and well under its October and Q4 pivot at 742.58, so the monthly and quarterly bias point down while the yearly bias is still up. At the time of writing it popped back above 718.40 at the open, reached 720.22, and is now sitting right on that level. On my side the trend reading is neutral, not bearish yet, and price sits near the bottom of its short-term range. What I watch is the daily close: back above 718.40 and Friday’s br
Research 22.10.2026🌏 Markets:
AMEX:SPY -6.89 -0.89%(pre/m)
NASDAQ:QQQ -10.84 -1.50%(pre/m)
🆕 Economic News:
Stock futures slide as Meta and Tesla lead the AI trade lower; oil climbs to a five-month high
08:30 USA – Initial Jobless Claims
08:30 USA – Continuing Jobless Claims
10:00 USA – CB Leading Index
10:30 USA – EIA Natural Gas Storage
13:00 USA – 5-Year TIPS Auction
Fed in blackout period ahead of the Oct. 27–28 FOMC meeting
After the close: NASDAQ:WDC , NYSE:NEM , NYSE:BE , NYSE:FIX
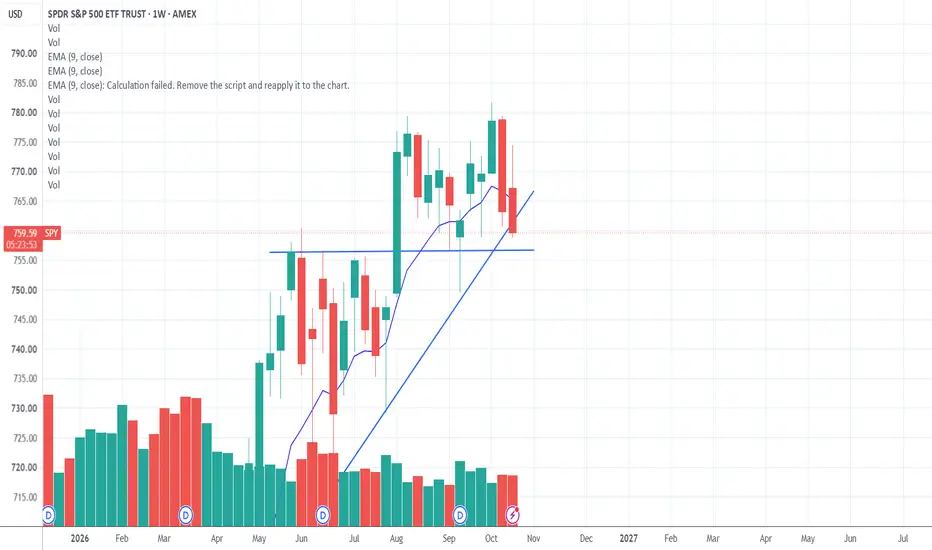
SPY breakdownNeutral 1h read on SPY:
**Structure:** Price made a high around the 780.50 level, then went into a sideways distribution, followed by a sharp impulsive drop to the ~760 area.
**Recovery:** Since that low, price has been forming a rising channel - higher lows along the two ascending trendlines you have drawn. It tried to climb back but kept getting sold around 774-775.
**Current:** The last push failed to hold above the ~769 gray level / channel mid, and price is now trading below the channel
XLE: seven closes above its second monthly target, quarterly tarEnergy (XLE) closed Wednesday at 68.16, its seventh daily close in a row above the second October monthly target at 66.38. The monthly, quarterly and yearly biases all point up, and our trend reading is bullish with momentum up. The next level is the quarterly target at 72.95, which sits above the current short-term range (top near 70.18), so a long-side process holds here rather than adding. The line to hold is 66.38 on a daily close: a close back under it would cancel the move. Energy and heal
SPY Is Testing 765.52 After Closing Above 770.09.SPY Is Testing 765.52 After Closing Above 770.09.
SPY closed yesterday at 773.09, its first close above 770.09 since October 15, but is trading near 765.80 premarket - back under the line and sitting on 765.52 support. The hourly structure is bearish and transitional, with a fresh bearish announcement printed premarket at a mid-range quartile. The 4H light is green with a top-quartile bull read. The timeframes disagree, and the premarket move is not a close.
Resistance: 769.05 - Tuesday's clos
DRAM: This is a great exchange traded fund to considerHello,
We believe that memory will remain a critical bottleneck for the AI revolution.
We believe memory makers are set to keep earning outsized profits as AI scales.
Bigger models and much longer context windows require higher bandwidth
memory (HBM) and more server DRAM (Dynamic Random-Access Memory)
per accelerator. The shift to agents will intensify this: agentic workloads
typically consume far more tokens than single-turn reasoning or chat because
they repeatedly ingest growing context, cal
PSQ: Fundamental OutlookProShares Short QQQ (PSQ) is an inverse ETF designed to deliver returns approximately opposite to the daily performance of the Nasdaq-100 Index, before fees and expenses. It provides a way to hedge a portfolio or gain tactical exposure to declines in large-cap technology and growth stocks. However, PSQ is not a conventional long-term investment in a business or sector. Its annual expense ratio is approximately 0.95%. Because the fund resets its exposure daily, compounding and market volatility c