Cross first, then the signal: MU & NVDAOvernight every name recovered and faded from the high into the open. The overnight rally was not the trade — the trade was the retest: hold the overnight low, or reclaim the overnight high. Today the sequence ran in the other order from the usual script: the 5m golden cross completed first, then the TREND signal printed into the already-confirmed cross, then the spike.
MU printed the TREND diamond at 09:31 at ~890, with a 1m bull divergence just before it. The spike ran to ~908 — the morning b
ETF market
SOXL 87$ AMEX:SOXL Saw it drop when was 150's+ saw TSM top + NVDA and SOXL was at 168$... And was bullish 120-110$ where I saw it go next, now at 87$ didn'T expect it to drop that much. Now getting wayy to oversold, short term bounce up to 135$ would be expected after that could selloff more... all depend if make higher low or higher high on the daily chart...
How the 5-minute cool-off cycle actually worksA 0DTE session is not one continuous trend. Read as a series of cool-off cycles, it becomes a sequence you can wait on — and waiting is the whole discipline.
A cycle opens when the 5-minute SMI washes below -40. That washout is the cool-off: momentum has flushed, and the tape is now allowed to turn. It does not mean the turn has happened. Inside the cycle, structure has to form first — an RSI divergence, a W-shape, or a higher low on the 5-minute or a higher timeframe. Then the 1-minute trigger
XLY closes above its monthly target, quarterly target nextConsumer discretionary (XLY) closed Monday at 114.46, its first close above the October monthly target at 113.44. It sits well above the October and Q4 pivot at 109.21, so the monthly and quarterly bias point up, while the yearly bias still points down with price under the 2026 pivot at 120.08. The next level is the quarterly target at 115.28; the high since October 1 is 114.69, so it has not printed yet. Our trend reading is neutral with momentum turning up, and the upside left in the short-ter
Research 26.10.2026🌏 Markets:
AMEX:SPY +0.90 +0.12%(pre/m)
NASDAQ:QQQ +1.12 +0.16%(pre/m)
🆕 Economic News:
US stock futures edge up as oil falls heading into earnings barrage (Reuters); U.S.-listed Brazilian shares slump after Lula's shock election win
08:30 USA – Chicago Fed National Activity Index
10:30 USA – Dallas Fed Manufacturing Index
11:30 USA – 3-Month and 6-Month Bill Auctions
13:00 USA – 2-Year Note Auction
Fed in blackout period ahead of the Oct. 27–28 FOMC meeting; decision due Wed
SPY Is Back Above 762.57 After Closing Under 760.80.SPY Is Back Above 762.57 After Closing Under 760.80.
SPY closed Friday at 759.97, under 760.80, and is trading near 763.10 premarket - back above 762.57 and just under Thursday's 763.96 close. Both timeframes show a bearish impulse structure, the hourly traffic light is red and the last hourly announcement was to the downside, while the 4H light stays green. Premarket prices are not closes, and the Fed decision lands Wednesday.
Resistance: 763.96 - Thursday's close
Key resistance: 765.52 - the
Bearish thesis for XLCThe Communication Services Select Sector SPDR Fund (NYSE Arca: XLC) offers investors exposure to some of the most influential businesses in the digital economy, including Meta Platforms, Alphabet, Netflix and major telecommunications companies. These businesses benefit from powerful brands, global distribution, network effects and, in several cases, highly profitable advertising platforms.
However, a strong business does not automatically make an attractive investment.
The bearish case for XLC
Head and shoulders triggers on SPX! Can we confirm tomorrow?Hello folks I have been busy this weekend, but I still wanted to get a video out for you folks even though its midnight at the time of recording. Lets get ready for next week!
We have officially triggered the head and shoulders pattern we were talking about in our previous video! BUT we have NOT YET CONFIRMED! If you have been a subscriber of mine for the past months you know me well enough that I always wait for confirmation. Am I risking profits on the short side? Yes but in a case like thi
SPY Weekly Outlook Oct. 26–30: Fed, Big Tech Earnings and $760
Catalysts: This is one of the busiest weeks of the quarter. The Fed announces its rate decision Wednesday, followed by earnings from Microsoft and Alphabet after the close. GDP and PCE inflation arrive Thursday morning, while Amazon and Intel report after the close. About 36% of S&P 500 companies are scheduled to report this week, so earnings reactions could strongly influence SPY.
Daily Chart: SPY closed at $759.97 after declining from the $781 area. Price broke below its rising support trend
SPY Sunday Night Market Prep - October 25This week could give us plenty to work with, but it could also punish anyone who decides they already know how it ends.
I’m leaning Green, with Yellow my second choice. I still don’t feel like the market is ready to commit to a major correction, and I see room for a recovery. The hourly chart still has to prove it, though. We have lower highs and several levels the bulls need to reclaim before that recovery becomes convincing.
I’m using the hourly candles to show the bigger battlefield. All th
Potential outside week and bullish potential for BUGEntry conditions:
(i) higher share price for NASDAQ:BUG above the level of the potential outside week noted on 2nd October (i.e.: above the level of $47.54).
Stop loss for the trade would be:
(i) below the low of the outside week on 28th September (i.e.: below $43.72), should the trade activate.
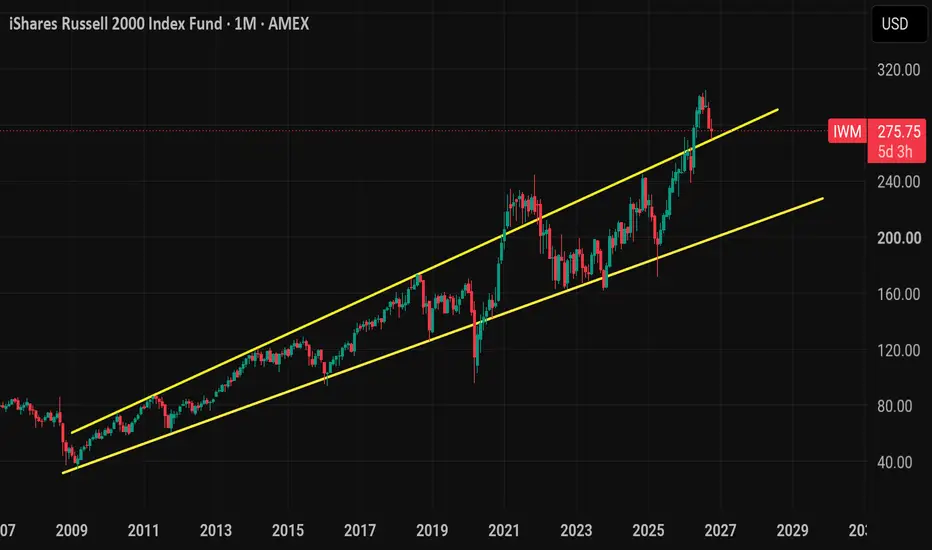
IWMInteresting setup here
Long term, we retesting our previous monthly resistance. A breakout like this happened back during COVID with the stimulus money, but it didn't last. I think after this seasonal run up back to 295-300 we will begin a decline back inside long term channel
Here's a close up of August reversal monthly candle. August closed around 295 and that is where Sellers will be waiting for iwm up there
Now zooming into the weekly , and this is why I think Iwm will bounce.
Since 20
Opening (IRA): SPY October 16th -625P... for a 6.25 credit.
Comments: Continuing to ladder out in time, targeting the strike paying around 1% of the strike price in credit.
Will generally look to roll up intervals to the strike paying around 1% of the strike price in credit, assuming there are greater than 45 DTE and that strike is at less than the 25 delta.
$CNDX , NASDAQ 100 UCITS ETFCNDX is the iShares NASDAQ 100 UCITS ETF, providing exposure to major non-financial companies listed on the Nasdaq Stock Market.
The weekly chart shows a sustained long-term advance, with price now around $1,672.80 following the latest expansion.
The current structure identifies two potential correction zones:
Premium: around $1,300, representing a potential retracement of approximately 22.44%.
Ultra Premium: around $601.10, representing a deeper potential retracement of approximately 64.48%.
Trade in QQQ 23-10-26📈 IN-MARKET**
I identified a potential mean-reversion scenario on a daily timeframe; as the price moved outside its Bollinger Bands and reached a significant technical support level, I decided to enter a long position.
The 10, 20, and 50 SMAs are currently above the price, while the 200 SMA sits nearby, serving as a key support level.
My core thesis for this trade is that the price may undergo a mean reversion and subsequently resume its uptrend. This position in the QQQ is intended as a long-te
QQQ
My primary scenario for Monday is a sweep of the previous session's highs, followed by rejection and a move lower, provided volume and price action confirm the setup.
A major unmitigated weekly order block sits below current price and could act as a potential draw on liquidity.
• 695.76: Initial profit-taking area near the beginning of the order block.
• 691.08: Potential downside target at a previous untouched New York low.
I'll be watching how price reacts at the order block before deter
MAGS: Bullish Trend ContinuesThe Roundhill Magnificent Seven ETF (MAGS) closed the session down 0.54% at $70.07 on October 24, 2026, amid recent tech sector focus on Nvidia's AI infrastructure demand, Microsoft's rising AI spending, Meta's planned share class structure, and upcoming earnings reports.
Technical outlook:
MAGS is still situated in ascending channel structure, roaming partially on higher highs and lows pattern, for a couple of months now. Price is heading down towards the trend support line, as we expect a lon
$VHYL , Vanguard FTSE All-World High Dividend Yield UCITS ETFThe monthly chart shows a long-term advance from the 2011–2012 lows, with price now trading near the recent highs.
The current structure identifies two potential correction areas:
Premium: the first major correction zone, around £58.50.
Ultra Premium: a deeper correction area, with liquidity identified around £45.46.
These are potential areas of interest within the broader structure. Their relevance will depend on how price reacts as the correction develops.
The long-term projections identif