CPI + 4 megabanks same 8:30 Tue; last open Fed windowTuesday morning is the sequencing binary of the week. June CPI drops at 08:30 ET the same second as JPM, Goldman, Wells and Citi report before the open; PPI drops at 08:30 ET Wednesday alongside Morgan Stanley, BlackRock and ASML.
Then the FOMC blackout begins Saturday July 18. Under Warsh the base case is silence between meetings, so this week is the last open Fed window before the July 28-29 decision. The July 8 minutes deleted the easing-bias language, staffed five outside-led task forces on the conduct of policy, and named Hormuz as a driver of inflation persistence.
Behind the tape, the Hormuz situation re-escalated over the weekend: the IRGC struck a container ship and declared the Strait closed while the US struck ~140 targets and calls it open, two claims at once with transit volume the only referee, and Qatar has now suspended all maritime activity. Crude opened the week bid (Brent ~$79.16, up 4.1%, WTI ~$74.38), so energy is a two-front trade: the Northwest Europe diesel crack at an all-time record $60.77 over Brent on Russia's enacted export ban (July 8 through 31), and the barrel back in play on the closure and the Qatar suspension.
The highest-leverage catalyst is whether Saudi Arabia, the UAE or Kuwait follow Qatar; if they do, the closure turns real and Brent takes out $85. The OFAC GL-X wind-down cliff lands Friday July 17 with ~63M bbl of Iranian crude stranded on the water and no buyers, the bearish crude tail the products melt-up has been masking.
Signals scorecard sits low-conviction on the count (BULL 5 / BEAR 4) with three factors past kill lines: P/E 27.2x over 25, CPI 4.2% over 4.0, junk spreads 2.70 under the 3.0 contrarian line (credit pricing zero risk premium). Own cheap optionality over the directional bet.
Cheers,
Ivan Labrie. XLF — financial sector structure ahead of bank earningsFinancials have quietly climbed for two years, and this week brings the real test — JPMorgan, Goldman Sachs, Wells Fargo, Bank of America, and Citigroup all report earnings, with the sector ETF sitting near its highs going in.
Through most of this stretch the bundle held as support underneath a steady uptrend, pullbacks respected along the way. Like any market, there were stretches where the bundle compressed and the read got murky — no method reads a pause perfectly, and financials had a few of their own around rate-hike fears and banking-sector jitters.
Right now price sits near the top of its range, right before a week that could reset the sector's structure one way or another depending on what the banks report.
This is a visualization/analysis tool, not a signal service — not financial advice. Method: tendency planimetry (Insen / OpenTraders).  Education
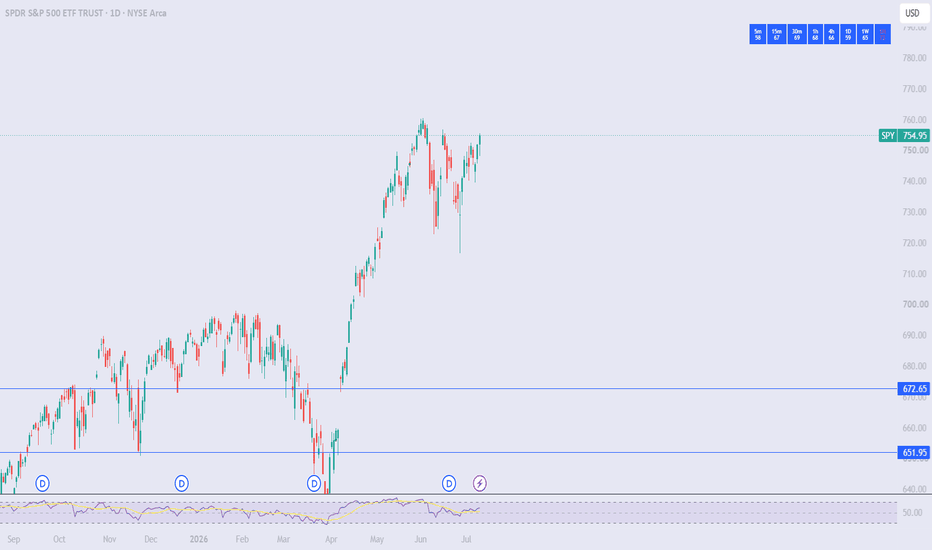
SPY 760 Breakout or 750 Retest? July 13
SPY is coming into the week with the daily trend still bullish, but price is sitting directly below an important resistance zone around 755.65–760.
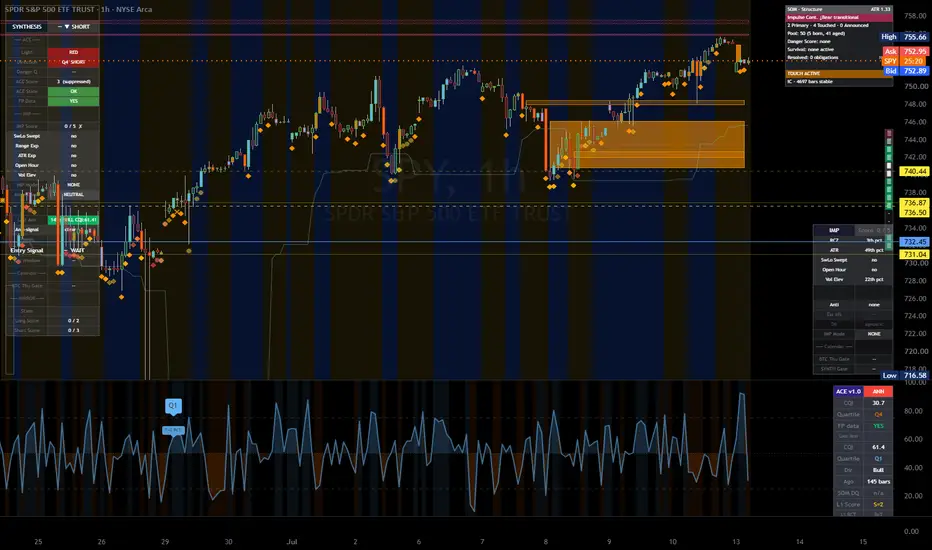
The 15-minute chart shows a strong move from 748.10 into 755.65, followed by tight consolidation near the highs. That is constructive, but I would not chase calls directly into several stacked GEX resistance levels.
For me, the main question is whether SPY can accept above 755–756 and continue toward 758–760, or reject and rotate back toward the 753–750 support zone.
Daily Chart
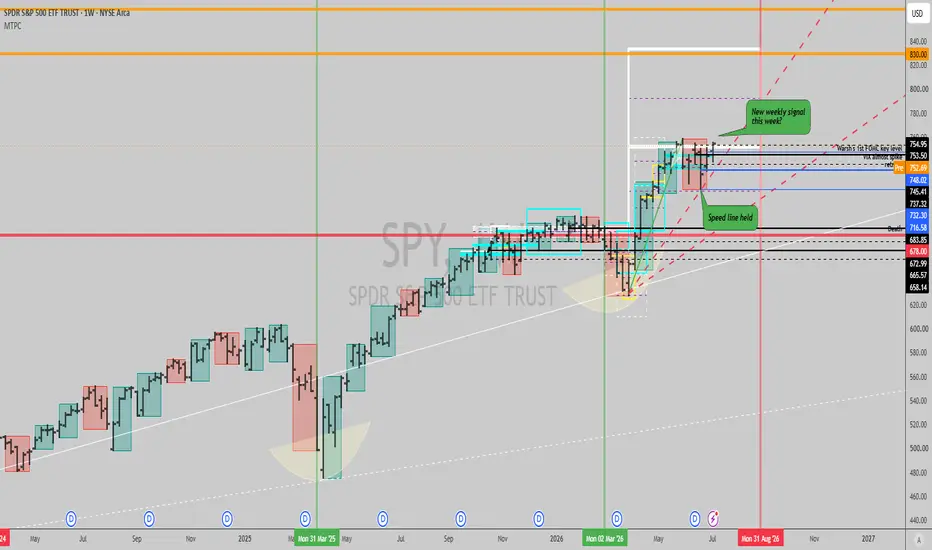
The daily structure remains bullish with price continuing to form higher lows above the rising trendline from the April low.
SPY recently recovered from the 720 area and is now retesting the upper part of the larger rising structure. The previous high around 758.45 is the first major daily resistance.
A daily close above 758.45–760 would confirm another breakout and could allow SPY to continue making new highs.
The larger trend remains healthy while price stays above the recent rising support structure. The first major daily support is around 720, followed by 695. The larger chart would only begin showing meaningful weakness if those areas start failing.
15-Minute Chart
The 15-minute chart shows SPY recovering from 748.10 and trending higher into 755.65.
After reaching the high, price began consolidating around 754.80–755 instead of selling off sharply. That tells me buyers are still holding the move, but they have not cleared resistance yet.
The immediate pivot is 755.
A clean break above 755.65–756 could push SPY toward 757, 758 and the stronger 759–760 resistance area.
If SPY continues rejecting near 755–756 and loses 753, the next downside test would be the overnight level around 751.88 and then 750.
Key Levels
Resistance: 755, 755.65–756, 757, 758, 758.45, 759, 760
Support: 754, 753, 751.88, 750, 748.10, 746, 745.59, 740
GEX Positioning
The GEX chart shows several call levels stacked closely between 755 and 760.
The first nearby level is 755, followed by 756, 757 and 758. The largest visible call concentration appears around 759, making 758–760 the most important upside resistance zone.
Because GEX is positive, SPY could remain pinned near 755 unless buyers bring enough volume to push through the call walls. This can create slow movement, failed breakouts and premium decay while price stays inside the range.
The main support and high-volume level is around 750.
That makes 750 the most important downside pivot. As long as SPY stays above it, the broader intraday structure remains constructive.
Below 750, the next put levels are around 746 and 740. A confirmed break under 750 could allow volatility to increase as price moves away from the positive gamma area.
Bullish Scenario
For the bullish setup, I want SPY to hold above 754–755 and break 755.65–756 with volume.
A 15-minute close above 756 followed by a successful retest would give buyers a better chance of pushing toward 757 and 758.
The stronger breakout confirmation would come above 758.45.
Above 758.45, I will watch 759 and 760.
If SPY accepts above 760, the market could begin another price-discovery move into new highs.
Bearish Scenario
For the bearish setup, I will watch for repeated rejection between 755.65 and 758.
If SPY rejects this area and then loses 754, the short-term momentum would begin weakening.
Below 753, I will watch the overnight level around 751.88 and then the main 750 high-volume level.
A confirmed 15-minute close below 750 could open the move toward 748.10 and 746.
If 746 fails, the next downside levels would be 745.59 and the larger 740 put wall.
Trade Considerations
SPY is currently trading directly below several GEX resistance levels, so I would avoid chasing the first move above 755.
For calls, I want to see a clean break, hold and retest above 755.65–756.
For puts, I want to see rejection from 756–758 followed by a loss of 753 and 751.88.
The opening range and VWAP will be important. If SPY breaks resistance but immediately loses VWAP, the move could become a failed breakout. If SPY pulls back but continues holding above VWAP and 753, buyers may still be building for another attempt.
Options Outlook
The chart shows IV Rank around 28.6 and average implied volatility near 15.1, so SPY options are not carrying extremely elevated volatility.
However, positive GEX and the closely stacked levels between 755 and 760 could still create slow price movement and 0DTE premium decay.
The cleaner directional opportunity may come after SPY confirms above 756 or breaks below 750 rather than while it remains trapped between those levels.
Conclusion
SPY remains bullish on the daily chart, but price is approaching an important resistance cluster.
Above 756, I will watch 757, 758, 759 and 760.
Below 753, I will watch 751.88, 750, 748.10 and 746.
The main decision range this week is 750–760. A confirmed break above 760 could continue the larger uptrend, while losing 750 could create a deeper rotation toward the lower GEX support levels.  Long
Long
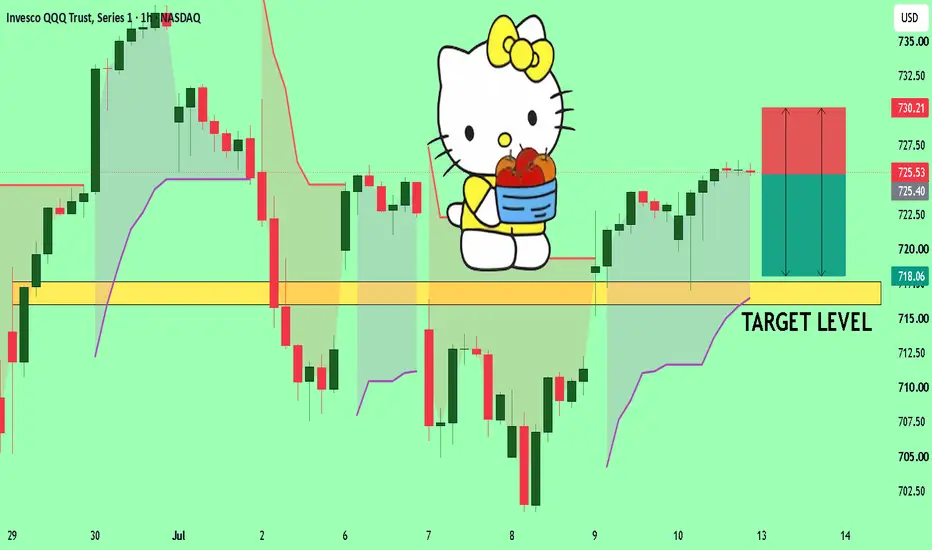
Weekly Bias — 13 JulyNASDAQ:QQQ is still in balance, but AMEX:SPY is closer to breaking out
NASDAQ:QQQ is sitting almost exactly at fair value ($720–$726)
Upside becomes harder without new buyers
Downside becomes harder without aggressive sellers
This explains why NASDAQ:QQQ has felt "stuck"
The 50d EMA is major confluence support
Previous swing lows
Prior liquidity sweep
Lower Bollinger band
Psychological $700
Neither a bearish or bullish trend, but in balance
The larger pool is below & that's why I still think a downside sweep remains possible before earnings
If bulls finally reclaim $730, price can move quickly
If $705 breaks, there may not be much demand until the the 100d EMA
Bullish
Only if $730 closes → $735 → $741 → $748
I would use $725–$730 calls with 17 July expiration only after confirmation above $730
Initial stop/invalidation would be back below $725
Bearish
If $719 fails → $705 → $700 → $685
I would look at $720 or $715 puts (depending on where NASDAQ:QQQ opens) with 17 July expiration, but only after a confirmed loss of $719 or a rejection from $730
My first profit target would be $705–$700 because that is where buyers are most likely to respond
I'd be watching the bond market just as much as price this week
If the 10Y yield pushes decisively above 4.6%, it would increase the odds of NASDAQ:QQQ breaking below the $719–$705 support cluster, particularly given the lack of momentum
Conversely, if yields retreat back toward 4.4%–4.5% while NASDAQ:QQQ reclaims $730, the bearish case weakens significantly because the macro headwind for large-cap growth would ease just as price escapes its month-long compression
This is probably the highest-event-risk week we've had in several months given 3 volatility catalysts that all interact
Mid-East escalation (oil & yields)
CPI (inflation/rates)
Warsh testimony (Fed reaction function), with major bank earnings also beginning
Mid-East
The geopolitical news matters primarily through oil
If the conflict remains contained, oil may initially gap higher Monday, but fade
Equities often recover quickly after the first reaction
If the conflict expands & energy infrastructure or the Strait of Hormuz becomes materially disrupted, oil likely rises further
Inflation expectations increase
Yields could remain elevated or move higher
Growth stocks face additional valuation pressure
CPI
This is probably more important than the geopolitical headlines for the week's trend
If headline & core both come in cooler than expected, yields likely fall
NASDAQ:QQQ should outperform
Descending range likely resolves higher
$725 → $730 → $741 → $748
If inflation surprises higher
The market immediately asks, is Warsh becoming more hawkish?
This is dangerous for tech
Likely path:
$725 → $719 → $710 → $705
A hot CPI combined with elevated oil prices would reinforce the narrative that inflation is proving sticky
Warsh
Warsh matters because markets are still learning his policy reaction function
His testimony comes shortly after CPI, so the 2 events can reinforce, or offset each other
Soft CPI + balanced testimony = very bullish
Hot CPI + hawkish testimony = probably the worst outcome for NASDAQ:QQQ
NASDAQ:QQQ is still sitting almost exactly at the high-volume acceptance area, $725 — why it's been so frustrating because it's sitting at fair value
Above $730, very little resistance
If buyers can reclaim $730 → $735 → $741
Price could move surprisingly quickly
Below $705, there is another air pocket
$705 → $690 could happen faster than many expect if support fails
I don't actually think CPI is the only risk
It's oil → inflation expectations → Warsh → 10Y yield → NASDAQ:QQQ
If oil spikes & the 10Y pushes above its recent highs, NASDAQ:QQQ 's technical support becomes much more vulnerable
Initial downside sweep to $705–$710, then recovery (40%)
Fits the technical compression & support picture
Upside breakout above $730 toward $741–$748 (30%)
Requires cooler inflation or a drop in yields
Continued $720–$730 chop into earnings (20%)
Dealers keep the market pinned despite catalysts
Breakdown below $705 toward the 100d EMA ~$685 (10%)
Needs multiple bearish factors to align like hotter inflation, sustained higher yields & poor market reaction
This is one of those weeks where the reaction is more important than the headline
A hot CPI followed by NASDAQ:QQQ holding $719–$720 would suggest much of the bad news was already priced in
A soft CPI followed by NASDAQ:QQQ failing at $730 would tell you buyers still lack conviction despite favorable news
With 3 major catalysts clustered together, I'd let the first 15–30 minutes after the cash open establish whether institutions are accepting or rejecting the move before committing to short-dated premium since on event-heavy weeks, confirmation often provides a better edge than trying to predict the initial direction  Long
Long
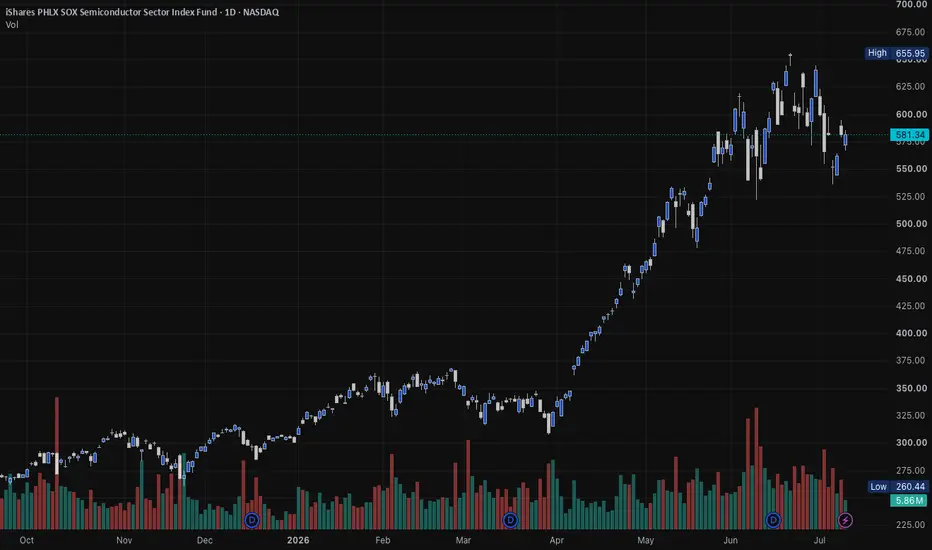
The semis melt-up the blocks did not confirmThe options tape screamed AI and semis all week - aggressive, one-sided call buying, the crowd chasing hard in names like SNDK, NBIS, MRVL, and MDB. But DarkFlow's institutional block read tells the opposite story in the same complex: the equipment and index names, the AMAT and SOXX group, were net distributed off-exchange all week, sold into every bit of that strength. The single largest block sale on the entire tape was not even a chip name. It was JPM, quietly hitting the exit while headlines pointed elsewhere.
The single-name tells sharpen it. AAPL looked call-heavy on the surface, but those calls were being sold, not bought - supply dressed up as demand. NFLX was the mirror image: the crowd was dumping it while the blocks quietly accumulated.
That divergence is the whole story. When the crowd is chasing calls while institutions quietly sell the complex into that strength, it is distribution into euphoria, not accumulation. The macro agrees: tightening financial conditions - firmer yields, a stronger dollar, weaker gold - are a direct headwind to exactly these high-multiple names.
The read: this looks like a late, crowded move in the semis, with the patient money using strength as an exit rather than an entry. Fading strength is favored over chasing it here; a genuine turn in the block distribution would be the tell that this read is wrong.
Not financial advice. A flow-and-blocks observation from DarkFlow's own record.  Short
Short
Top IVR/IV Underlyings in Broad Market, ETF's This WeekI've really been incredibly lazy of late screening the market for top IVR/IV underlyings to sell premium in, so thought I'd get off my duff for a change and do some "work" ... .
Here are the underlyings in broad market and the ETF space with highly liquid options ranked in descending order by IVR (implied volatility rank, i.e., where IV is relative to where it's been over the past 52 weeks):
Broad Market:
QQQ (60.1 IVR/25.0% IV)
EFA (31.1/13.9%)
SPY (27.8/14.9%)
IWM (20.0/20.3%)
DIA (19.5/13.6%)
For broad market premium selling, I generally look to sell premium where IVR>50 and 30-day IV is >21, so I'd probably only consider selling premium in the Q's here.
Illustration: QQQ August 28th (47 DTE), 676/786/2 x 790/795, 3.22 credit on a buying power effect (BPE) of 6.78, 47.5% ROC at max, 23.7% at 50% max. Generally, I'm looking to get one-third the width of the widest wing in credit, so this would be a marginal trade here.
ETF's:
SMH (Semiconductors) (88.1/58.5%)
EEM (Emerging Market) (83.6/38.9%)
EWY (Japan) (81.0/81.0%)
URA (Uranium) (61.1/52.5%)
XLE (Energy) (57.2/25.8%)
With ETF's, my cut-off's are >50 IVR, >35% 30-day IV, so SMH, EEM, EWY, and URA would be viable candidates; XLE would not because its IV is <35.
Illustrations:
SMH August 21st (40 DTE), 520/530/720/730 iron condor, 3.37 credit on BPE of 6.63, 50.8% ROC at max, 25.4% at 50% max. 20 delta short option legs.
EWY August 21st (40 DTE), 145/155/230/240 iron condor, 3.75 credit on BPE of 6.25, 60.0% ROC at max, 30.0% at 50% max. 23 delta short option legs.
Naturally, after hours quotes are showing wide bid/mid/ask, so will have to price these out during regular market hours.  Short
Short
Short 
 Education
XLB: Large Consolidation Is Building a Higher-Low StructureSniper Alpha has identified a large consolidation developing in XLB, the Materials Select Sector SPDR ETF.
Although price remains inside a broad sideways structure, the internal structure is beginning to improve. XLB has already formed a higher low, followed by a higher high, while the latest pullback is still holding above the major horizontal support area.
This suggests that buyers may be gradually gaining control beneath the descending resistance line.
The main areas to watch are:
Descending trendline resistance
Recent swing-high zone around $52–$53
Major structural support near $49.50–$50.00
A confirmed breakout above the descending resistance, followed by acceptance above the recent highs, could allow XLB to attempt a move toward higher price levels.
Sniper Alpha Framework
Sniper Alpha starts with the sector, reads the price structure, and waits for confirmation before taking action. Improving higher lows and higher highs put XLB on the watchlist, but the breakout still needs to be confirmed.
If XLB continues strengthening, Sniper Alpha will look for individual Materials stocks showing stronger momentum and cleaner setups than the ETF.
No confirmation, no trade. Wait for structure. Respect risk. Long