SPY Is Trading Under 764.76 - Today's Close Decides The Long.SPY Is Trading Under 764.76 - Today's Close Decides The Long.
The long taken Wednesday on the reclaim of 765.52 is under pressure. SPY is at 763.21 in premarket, below the 764.76 level that ends it. That level is judged on the regular-session close, not on a premarket print, so the long stands until 4 PM ET. A close below 764.76 today takes it off and returns the read to Neutral. The surface is not supporting it: the 4H structure has turned bearish, conviction is middling on both timeframes, an
ETF market
Buy Limit executed with phases using multi-timeframe confluenceI used multiple time frames to find trend, structure, phases and key levels. I made sure to look for confluence before finding my zones on a lower time frame. I found my second target on my intermediate time frame. I set a Buy Limit Order with two targets and a Stop Loss. The details are screen shots on my phone because I do not know how to publish such details yet...
Thanks for looking,
-Reese
GLD Analysis: Gold Breaks 395 on Low Volume, Gap Down Fade in PlCONTEXT
For the last 5-6 days, 400 has been the key level on GLD:
- Long over 400
- Choppy between 395-400
- Bearish under 395
The market has now broken 395.
For CFDs, search XAUUSD. For futures, GC1!
KEY LEVELS
- 400: key level
- 395: breakdown level now being watched
- Downside targets: 390, 385, 382
WHAT THE CHART SHOWS
The break of 395 came with average volume much lower, less than 30%. Volume is not supporting the trend. For today's session, the setups on watch were a Gap Down Fade or a
SPY Daily: Bouncing From 5/12 EMA, 766.5 Low Is the Level
SPY's Sept 23 session went up, then choppy, then down. Banks are the reason SPY is much weaker than QQQ.
KEY LEVELS
- Sept 23 low: 766.5
- Downside targets below it: 762 and 760
WHAT THE CHART SHOWS
The down move came on volume 32% higher than average: 54M vs 41.5M. On the daily chart, price is bouncing from the 5/12 EMA, which makes the 766.5 low the big level to watch.
SCENARIOS
Bullish case: If 766.5 holds, I will look for a long on smaller timeframe curls.
Bearish case: If 766.5 breaks,
QQQ Analysis: Profit Taking After ATH Test, PDL Decides Sept 24After testing the all-time high, QQQ's move in the Sept 23 session reads as profit taking. That was the expected reaction at the ATH, and it puts the previous day low (PDL) in focus for Sept 24.
KEY LEVELS
- PDL (Sept 23 low):
- All-time high:
- Levels below the PDL: 734, 732, 730
WHAT THE CHART SHOWS
Price tested the ATH and pulled back. That pullback looks like profit taking at a major level, not a confirmed reversal yet. The PDL is the line between a normal pullback and a deeper move.
$DRAM: Tight Supply, Trigger at 62CBOE:DRAM has held a higher-low structure since late July. Price is above the 57.69-58.31 AVWAP cluster (anchored to the April low and June high) and testing VAH near 62. RSI is printing a matching higher low.
Trigger: Volume-backed daily acceptance above 62, opening the path to 68.69-71.33 Primary Supply.
Overhead: 77.70-81.34 Major Supply.
Extension: 95.75-103.27, the 1.272-1.414 extension of the April-June swing; only active above 81.34.
Profile: POC 55 / VAL 48
Invalidation: Daily close bel
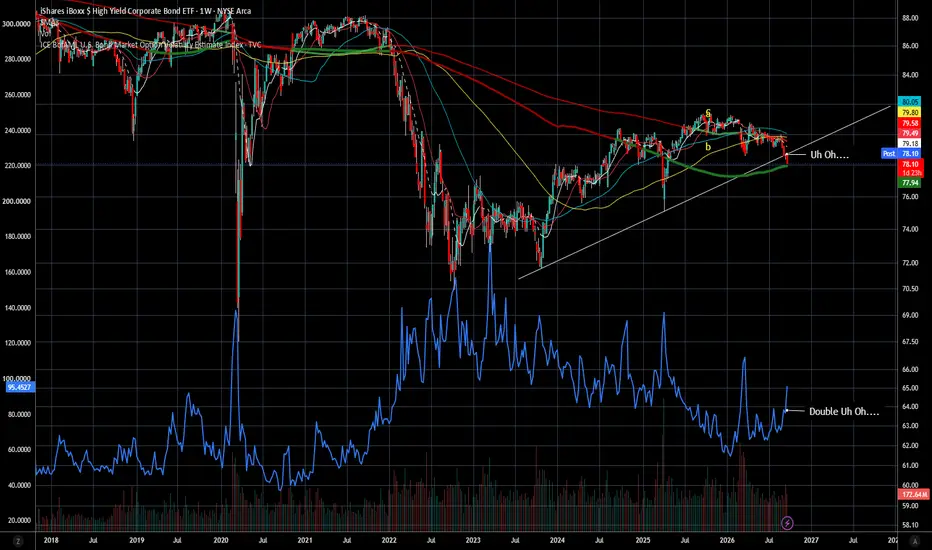
Risk OFFPain is here and more pain is in the forecast.
The MOVE index Exploded upward today, indicating large bond market volatility. This mirrors (inversely) the sell-off seen in HYG.
Fun Fact: Cannabis stocks were surprisingly resilient today. Trulieve and MSOS were actually green today while the broader market was selling off with bonds. I'm still expecting a recommendation from the judge on reclassification to come soon. This sector could be a place to hide. It is extremely undervalued in my opin
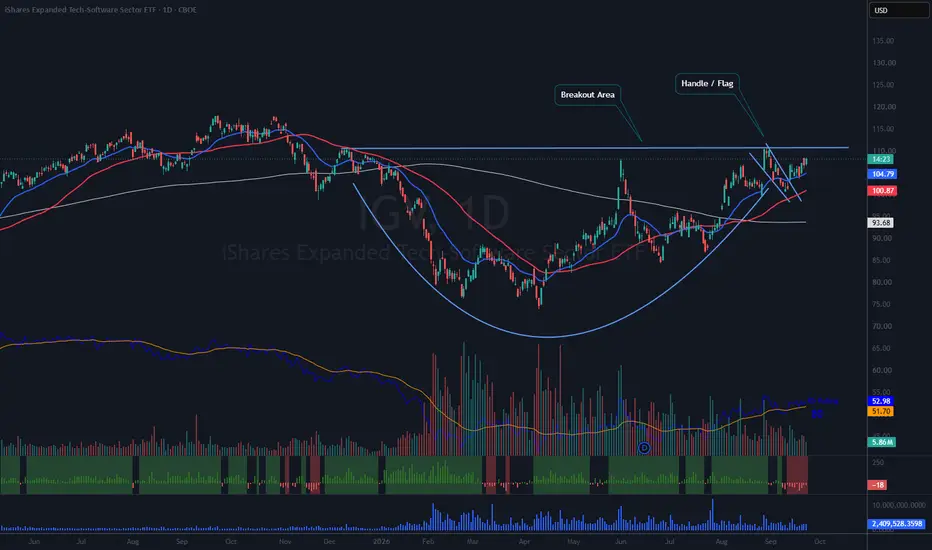
$IGV: Potential Cup-with-Handle PatternOverview
IGV is the Expanded Tech-Software Sector ETF. Software has lagged while AI chips, hardware, optics, and other AI-related stocks have surged. Recent price action suggests that software names may be returning to investors’ radar, making IGV a useful indicator of the broader move.
Selected Top Holdings
• NASDAQ:PANW
• NASDAQ:PLTR
• NASDAQ:CRWD
• NASDAQ:MSFT
• NYSE:ORCL
• NYSE:NOW
• NYSE:CRM
• NASDAQ:FTNT
Technical Setup
The chart appears to be forming a cup-with-handle p
ATR: Bigger Moves Don’t Always Mean Higher PricesA rising indicator doesn’t always mean a rising market.
Average True Range, or ATR, can rise while prices fall.
That’s because ATR measures the size of price movement, not its direction.
Welcome to today’s Investrade Chart Basics.
What goes into ATR?
ATR averages a measure called “true range,” which considers each bar’s high and low as well as gaps from the previous close.
Our chart uses a 14-period ATR. Higher readings reflect larger recent ranges; lower readings reflect smaller ones.
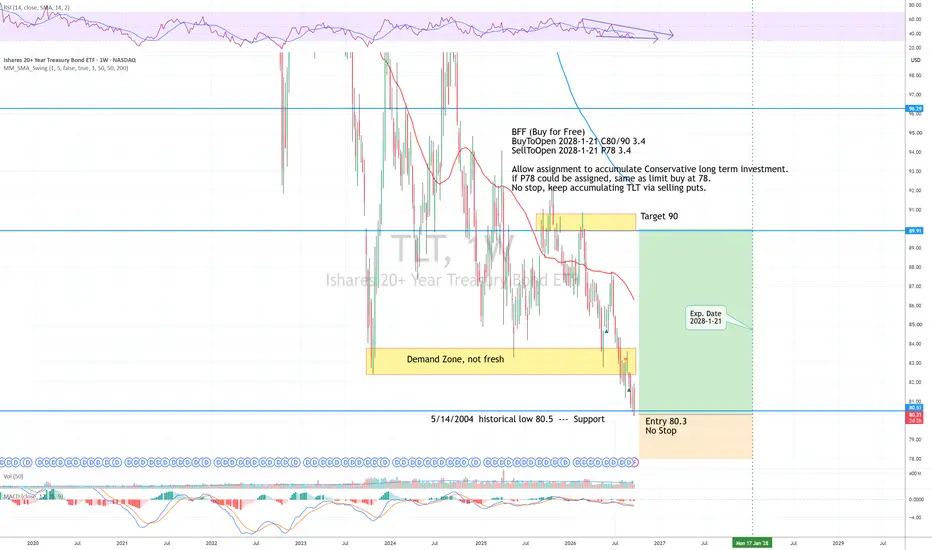
TLT LongAround Historical Low. keep accumulating TLT via selling puts.
Entry 80.3
no Stop
Target 90
Risk management is much more important than a good entry point.
I am not a PRO trader. About 25% of my trades had been stopped quickly.
TLT BFF (buy for Free)
SellToOpen 2028-1-21 P78, 3.4 (Delta=-0.30)
BuyToOpen 2028-1-21 C80/90, 3.4 (C80 Delta= 0.88)
Total cost 0.00
Allow assignment to accumulate Conservative long term investment.
if P78 could be assigned, same as limit buy a
QQQ GEX – Rejected at 745–750, Watching the 730 HVLQQQ has been rejected from the 745–750 call-wall zone. The October 2 cumulative profile places C1 at 745 and C2 at 750, making this a layered resistance area rather than a single level.
At the 740.84 profile reference, price is back below cTrans at 742 and inside the 730–742 transition zone. It nevertheless remains above the 730 HVL, so the positive side of the regime pivot has not yet failed.
🔶 Regime Context 🔶
GEX History remains mixed: two of the five tracked expiries have turned negative,
HOW-TO: Read M🜁rketMind in Under 60 SecondsThis is a quick example of how I read M🜁rketMind in under 60 seconds.
The goal is not to turn every chart into a trade. The goal is to understand whether the market’s current evidence is coherent, mixed, or conflicted before making your own decision.
1) Start with SETUP
On this XLE 15-minute chart, SETUP = SHORT · AUTO .
That is M🜁rketMind’s resolved directional reading. It is not a buy or sell command, and it does not mean every component agrees.
2) Read the context
Here, CONTEXT
Procure Space ETF ($UFO) | Bias: Bullish / Watchlist📈 1. Technical Structure & Volume Profile Key Support:
NASDAQ:UFO has completed its correction from the $67.00–$68.00 highs and is currently compressing right above major structural support at $40.67 – $42.81.
Volume Profile Alignment: The primary High Volume Node (HVN) / Value Area POC sits directly overhead at $46.00.
Patient Accumulation Setup:
Price is testing the lower bound of the broader multi-month consolidation structure established earlier in 2026.
🎯 2. Execution Leve
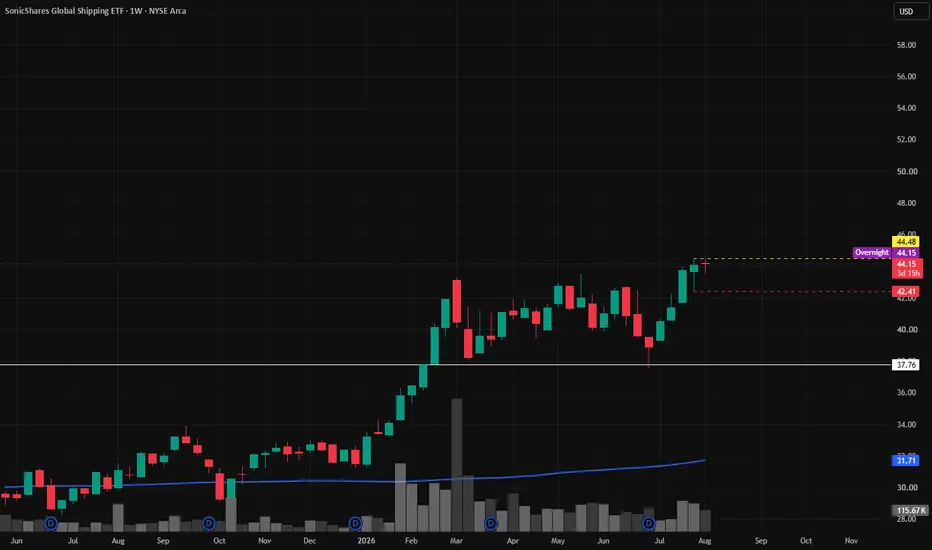
BOAT | Continued growth ETF- Timeframe: Weekly
- Trade type: Buy stop order
- Price: 44.48
- Take Profit: Open
- Stop Loss: 42.41 (-4.70 %)
Idea: Long on a breakout above last week's high - bullish momentum continuation.
Entry: Buy stop above last week’s high.
Stop-loss: Below the low of the same candle.
If the weekly candle closes below this level, the trade is invalidated.
Take Profit: Trailing stop following the lows of new weekly candles.
QQQ: 50 SMA Cross with Reverse Head-and-Shoulders💡 Swing setup idea
50 SMA Strategy
🔎 Analysis summary:
The technology ETF is reaching resistance while closing a reverse head-and-shoulders pattern. We can also see the crossing of the 50-day moving average, confirming the bullish shift. This alignment of trend, pattern and level makes the breakout area key to watch. The upside potential is projected by the depth of the reverse head-and-shoulders from the breakout point.
👀 Levels to watch:
Entry trigger: Break above $748.65
Target: $836.
Research 23.09.2026🌏 Markets:
AMEX:SPY -2.23 -0.30%(pre/m)
NASDAQ:QQQ -0.80 -0.10%(pre/m)
🆕 Economic News:
10:05 USA – Fed Barr Speech
10:05 USA – EIA Gasoline Stocks Change
20:00 USA – President Trump and President Xi Summit
20:00 USA – UN General Assembly
📈 Gap Ups
Reaction to earnings/guidance:
NYSE:WOR NASDAQ:CTAS NASDAQ:PAYX NYSE:GIS
Other news:
Quantum stocks are rising on NYSE:IONQ Development of first Real-Time Quantum Error Correction Decoder : NASDAQ:QNT NAS
SPY Is Holding The 765.52 Reclaim For A Third Session.SPY Is Holding The 765.52 Reclaim For A Third Session.
SPY is trading near 772.65, a third consecutive session above the shelf that capped it for three sessions before that. The reclaim above 766.33 confirmed on Monday's close and held on Tuesday's close at 773.28, with no close back below at any point - a two-session confirmation sequence completed as written, which is the condition this study requires before it will take a side on a break. The surface is soft into it: the hourly reads Choppy
S&P 500 CAUTION!!🚨 The S&P 500 may look strong—but underneath the hood, market breadth just hit a 23-year extreme.
The RSP/SPY ratio—equal-weight S&P 500 vs. cap-weighted S&P 500—has fallen back to levels last seen around 2003.
That means the index is becoming increasingly dependent on a small group of mega-cap stocks while the average stock continues to lag.
Historically, extremes like this don’t stay stretched forever.
Two ways this resolves:
1. Rotation: money flows out of the leaders and into the broade
Buy Now. All of it. As Much As Possible.Cannabis is about to make a comeback in the equities market.
The Judge is going to come out soon with his announcement.
This judge was nominated under Biden and did his masters degree in international human rights. All of the other government offices are advocating for it now, and Trump wants it, because it will help him calm the public and he can make a bunch of money off of it.
The long-term moving averages are now active as support and supporting price movements upward. The bulls are in ful
How to leverage on the rise of AI and invest From watching short form videos to the TV news and digital papers, one cannot escape the topic of Artificial Intelligence. Some teens are strongly opposing the idea of schools using AI while many private organisations and governments worldwide are rushing on this bandwagon to take advantage of it.
It is accelerating so fast that some industry players are asking the government to intervene and slow it down for the benefit of mankind. Other activists are voicing their concern over environmental d