Research 12.06.2026🌏 Markets:
AMEX:SPY +3.76 +0.51%(pre/m)
NASDAQ:QQQ +2.58 +0.36%(pre/m)
🆕 Economic News:
Today is SpaceX's IPO
10:00 USA – Michigan Consumer Sentiment
📈 Gap Ups
Reaction to earnings/guidance:
Other news:
The following five companies will be added to the Nasdaq-100 Index: NASDAQ:CRWV NASDAQ:NBIS NASDAQ:ALAB NASDAQ:RKLB NASDAQ:TER (At the close of markets on Friday, June 19th)
Space sector rises on SpaceX IPO: NASDAQ:SATS NASDAQ:ASTS NASDAQ:RKLB
NASDAQ:GOOG considering using Samsung Electronics to manufacture part of a future artificial intelligence (AI) chip, a move that would mark a notable shift in the US tech group's supply chain as demand for advanced AI silicon strains capacity at TSMC.
Bank of America said agentic AI could open a market worth more than $170 billion for server CPUs by 2030, lifting outlooks for NASDAQ:NVDA , NASDAQ:AMD , NASDAQ:INTC and NASDAQ:ARM
Pre-market risers (pump&dump) : NASDAQ:BYAH NASDAQ:DSY NASDAQ:UBXG
📉 Gap Downs
Reaction to earnings/guidance:
NASDAQ:ADBE NYSE:LEN NYSE:RH
Other news:
The following five companies will be removed from the Nasdaq-100 Index: NASDAQ:CHTR NASDAQ:CTSH NASDAQ:INSM NASDAQ:VRSK NASDAQ:ZS (At the close of markets on Friday, June 19th)
‼️ Additional
SpaceX NASDAQ:SPCX is currently valued at $2.2 trillion on Hyperliquid and Binance, with futures trading around $165 per share — BBG.
Oil and gas stocks are falling on insider information that a peace deal between Iran and the US will be signed this weekend ahead of the G7 meeting.
🏢 IPO
NASDAQ:SPCX – SpaceX / Space Exploration Technologies Corp.
Nasdaq reported that SpaceX shares, ticker NASDAQ:SPCX , will begin trading at 9:50 AM ET.
Company builds rockets, spacecraft, satellite internet infrastructure and AI systems. Core businesses include Falcon/Starship launches, Starlink broadband and mobile satellite connectivity, and xAI/Grok after the xAI acquisition. Main thesis is vertically integrated space + connectivity + AI infrastructure, with SpaceX already carrying the majority of global mass to orbit and operating one of the largest satellite networks in the world.
Price: $135.00
Shares: 555.6M
Raised: $75.0B
LTM:
Revenue: $19.30B
Net Income: -$8.69B
Comparable public companies: NASDAQ:RKLB , NASDAQ:ASTS , NASDAQ:IRDM , NYSE:PL , NYSE:LMT , NASDAQ:NVDA
📋 List of tickers involved:
NASDAQ:CRWV NASDAQ:NBIS NASDAQ:ALAB NASDAQ:RKLB NASDAQ:TER NASDAQ:SATS NASDAQ:ASTS NASDAQ:GOOG NASDAQ:NVDA NASDAQ:AMD NASDAQ:INTC NASDAQ:ARM NASDAQ:BYAH NASDAQ:DSY NASDAQ:UBXG NASDAQ:ADBE NYSE:LEN NYSE:RH NASDAQ:CHTR NASDAQ:CTSH NASDAQ:INSM NASDAQ:VRSK NASDAQ:ZS NASDAQ:SPCX
Best regards – hi2morrow team.
 Long
Long
 Short
Short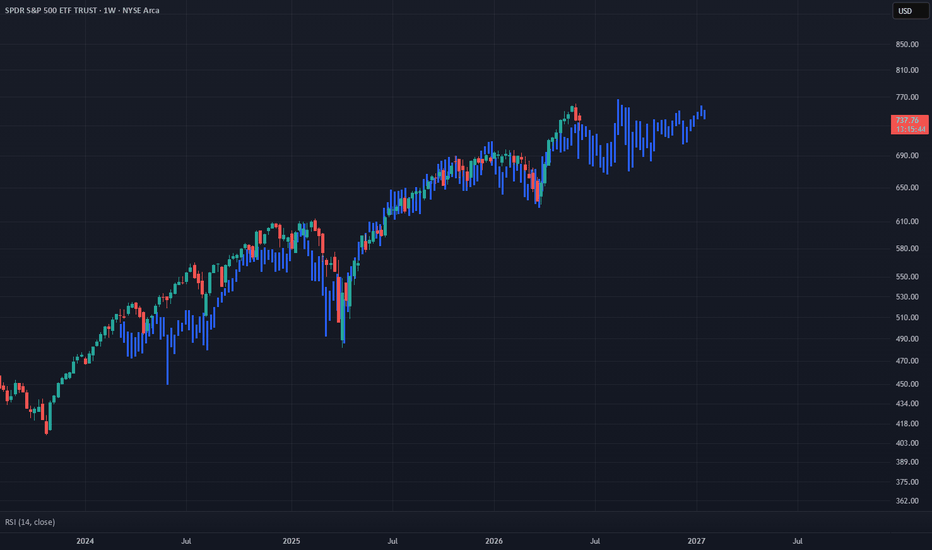
 Short
Short

# SPY June 12: Bulls Pressing Against 740 While Dealers Watch 74
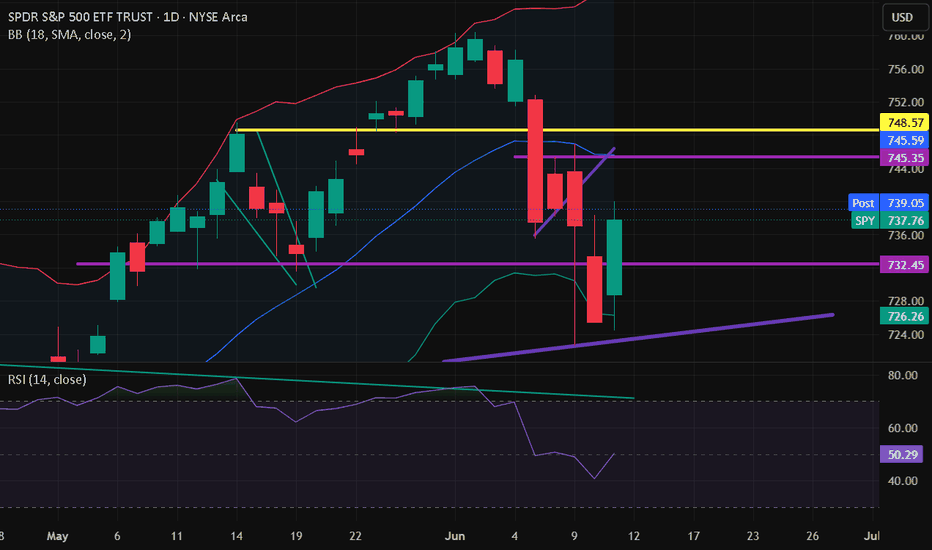
SPY spent the entire afternoon doing exactly what bulls wanted to see. After reclaiming the 730 area earlier in the session, buyers never gave sellers a meaningful opportunity to regain control and continued grinding higher into the close.
The 15-minute chart remains firmly bullish. Price broke out of the recent consolidation range, reclaimed multiple resistance levels, and finished the session sitting just beneath the 740 area. More importantly, every pullback throughout the afternoon was shallow and quickly bought.
The next challenge is whether SPY can finally push through 740 and begin working toward the larger call walls stacked overhead.
## Key Levels
Support
$739
$733
$730
$725
$715
Resistance
$740
$744 HVL
$745
$750
$753
$755
$760
## GEX Positioning
The options map continues favoring buyers as long as SPY remains above the 733-730 support zone.
The first battle sits directly at 740 where price closed the session. A clean move above this area would place the HVL at 744 directly into focus.
Above the HVL, call positioning expands significantly at 750, 753, 755, and 760. The largest nearby call concentration sits around 750, making it the primary upside magnet if buyers gain acceptance above 744.
Dealer positioning becomes increasingly supportive above the HVL as hedging flows could help accelerate upside momentum toward those higher strikes.
On the downside, support begins at 733 followed by the larger put wall at 730. If SPY loses 730, downside pressure could increase toward 725 and eventually 715.
One thing that stands out is the heavy put positioning still sitting below current price. As long as those levels remain defended, the path of least resistance remains higher.
## Trade Considerations
The most important level tomorrow is 744.
Price spent the afternoon consolidating near highs after a strong breakout move. That type of structure usually favors continuation rather than immediate reversal.
A breakout through 740 would likely bring the HVL into play quickly.
If sellers manage to push price back below 733, momentum could slow and trigger a retracement toward 730.
The current structure remains bullish because buyers continue defending every dip while holding near session highs.
## Bullish Scenario
If SPY clears 740 and gains acceptance above the HVL at 744, buyers could quickly challenge the major call wall at 750.
A successful move above 750 could trigger additional dealer hedging flows toward 753, 755, and potentially 760.
Bullish Targets
$744
$745
$750
$753
$755
$760
## Bearish Scenario
Failure to hold above 739 followed by a break under 733 would weaken the current bullish structure.
That could trigger a pullback toward 730. If sellers gain momentum below that level, SPY could revisit 725 and potentially 715.
Bearish Targets
$733
$730
$725
$715
## Options Outlook
Bulls want continued acceptance above 740 and ultimately a move through the HVL at 744.
Bears need to force price back below 733 and defend the 744-750 resistance zone.
At the moment, buyers remain in control. SPY continues holding near highs, dealer positioning becomes more supportive above current price, and the market has shown little interest in giving back the afternoon breakout.
## Conclusion
SPY enters June 12 with momentum firmly on the bulls' side after reclaiming key support levels and finishing the session near highs.
Above 740, attention shifts toward the HVL at 744 and the major call wall at 750. Below 733, sellers could attempt to slow the rally and target 730-725. The battle around 740-744 should provide the clearest clue for the next directional move.
Long 
Long
 Long
Long
Short 
 Short
Short
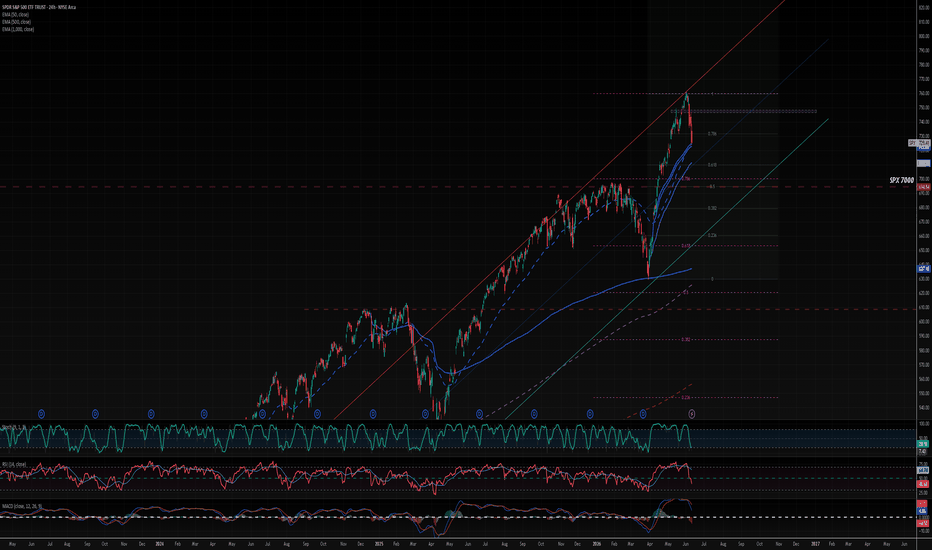
SPY - A Swing Low Was Just SweptSPY Has Given Back Most of the April Rally in Two Weeks. A Swing Low Was Just Swept.
Whether that sweep holds or fails is this morning's question.
Structural Assessment
SOM is reading Impulse Cont. Bear on SPY 1H.
15 primary FVGs alive, 12 touched. The obligation pool
built during the April-May rally is being systematically
worked. 12 touched against 15 primary means 80 percent
of current obligations have been engaged. The market is
not ignoring structure on the way down.
ACE is GREEN with Q2 neutral. CQI 58.5. Last Ann was
Bull CQI 71.22, 156 bars ago. Direction neutral against
a bull announcement from 156 bars back. The conviction
that was present at the high has fully decayed.
IMP is scoring 1/5. NONE mode. WAIT.
SwLo Swept: YES. A swing low was taken out.
RCZ at 26th pct, ATR at 48th. Neither elevated.
Vol Elev at 2nd percentile -- volume has not confirmed
the sweep. A swing low sweep without volume is a
structural note, not a signal.
Anti-signal: clear. The sweep itself is not flagged
as a liquidity grab by the stack -- it cleared cleanly.
Tactical Cheat Sheet
Resistance: 732-733 -- nearest overhead level
Key resistance: 737.57-738.47 -- prior FVG cluster base
Hard resistance: 741-742 -- dense FVG overhead
Current price: 730.63
Support: 728.00 -- intraday structural level
Key support: 721.23 -- session Low, thesis line
Extended support: 703.07 -- daily obligation cluster
SwLo Swept context:
The swing low sweep with Vol Elev at 2nd percentile
is not a confirmed breakdown. It is a probe. Price
tested below the prior low without volume conviction.
Two outcomes follow from here:
Reclaim path (sweep as liquidity grab):
Price reclaims 732 at open with Vol Elev entering
IMP scores 1+ with PART mode loading
The sweep was a stop run, not a breakdown
Target: 737-742 FVG cluster fill
Continuation path (sweep as breakdown):
Price fails to reclaim 732 on first attempt
Vol Elev enters and drives price through 728
IMP loads EXT mode with ATR expanding
Target: 721.23 test
What the Stack Is Watching
The swing low sweep is the event. Volume is the
verdict. If volume does not enter at the open to
confirm direction, this is noise in a bear structure,
not a signal in either direction.
RCZ at 26th pct is the watch variable. If it starts
climbing toward 60th in the first hour, the
participation sub-system is activating. That is when
the sweep resolves into a tradeable setup.
---
Built with SYNTHESIS v3.3 | SOM / ACE / IMP / SYNTHESIS
Study, not financial advice.  Short
Short
 Long
Long

Short