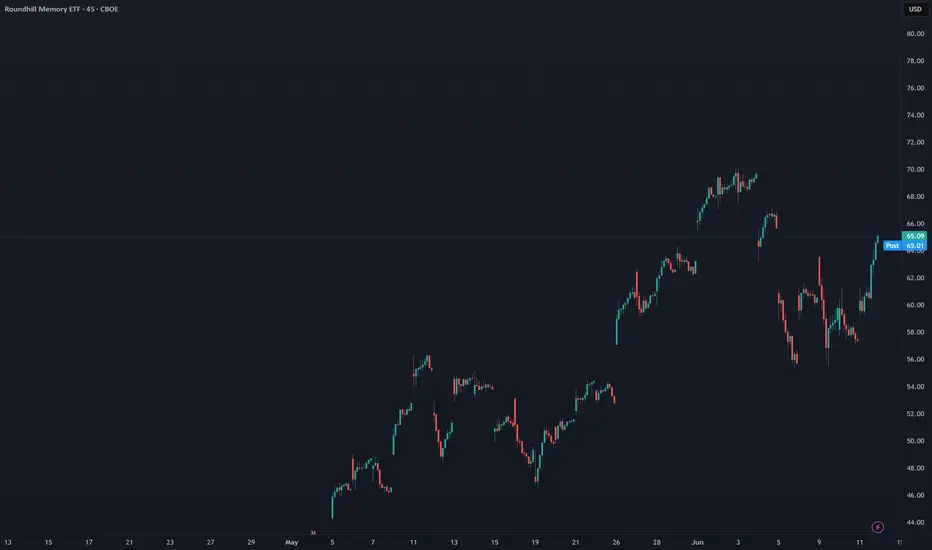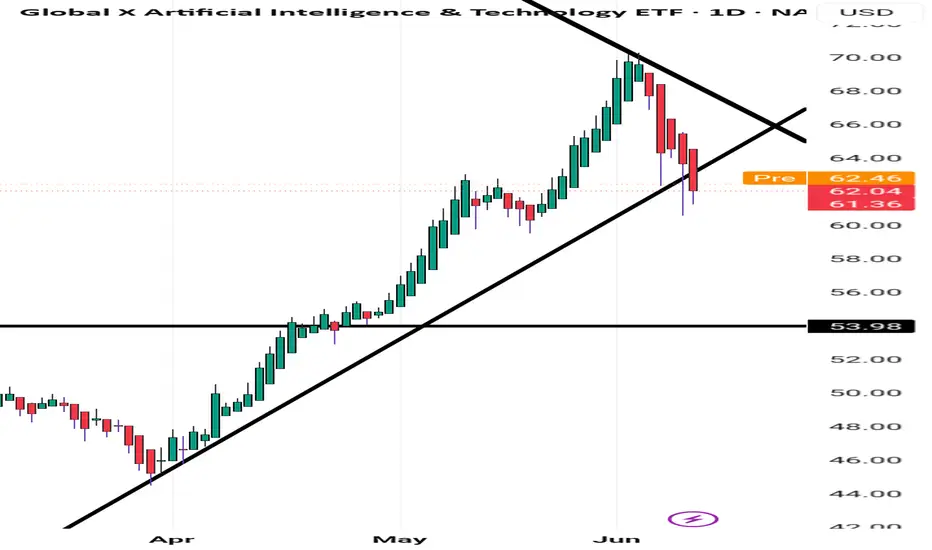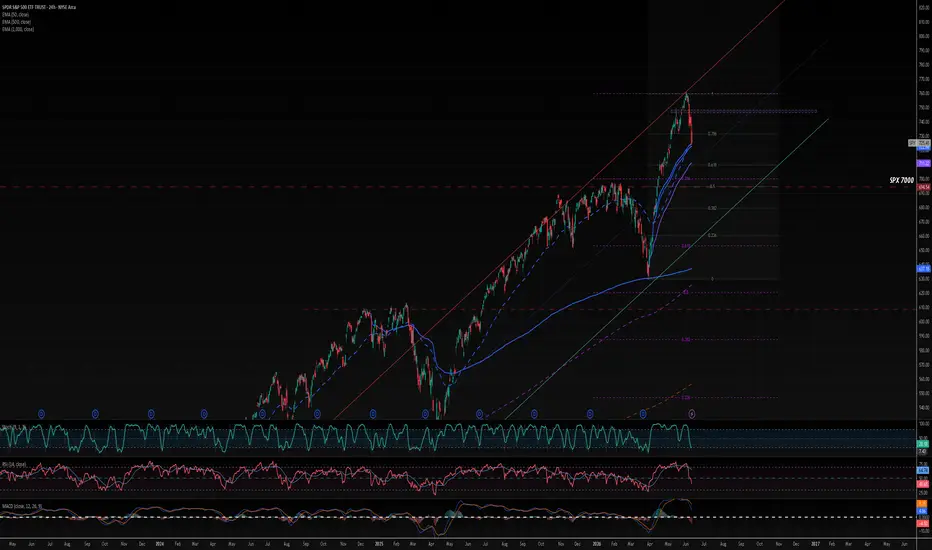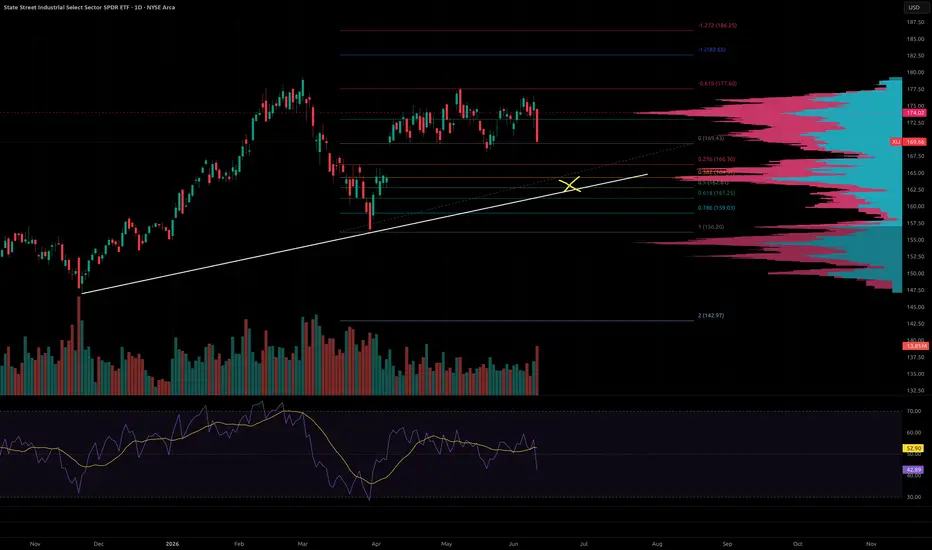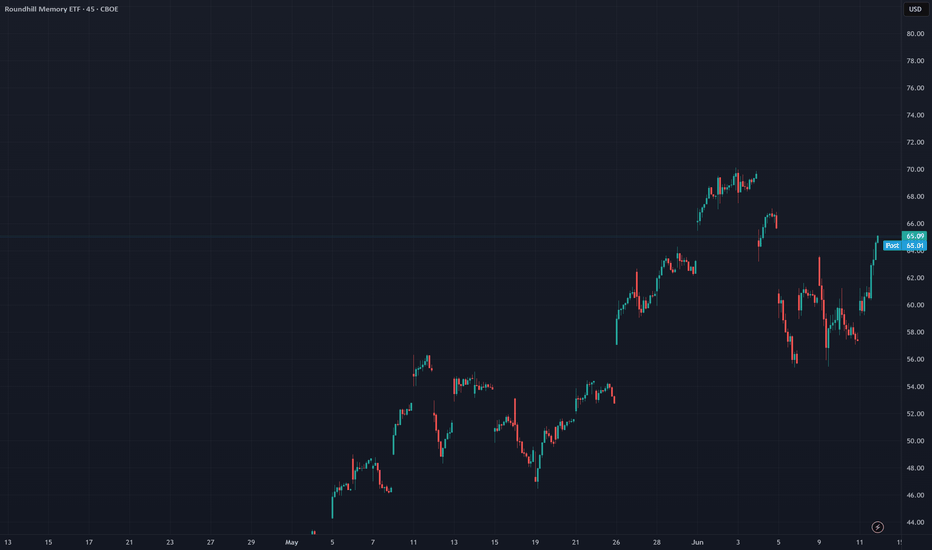
Roundhill Memory ETF: DRAM is the beginningDRAM was on a huge discount for days hovering support at $57-$59, was bound to break out with that much volume. But I still see DRAM as an incredible buy for the future of AI. Memory and energy will be the future, and I'm putting half of my eggs in this basket for long term investing and will DCA this slowly. Through dark days ahead, my hands will turn diamond.
ETF market
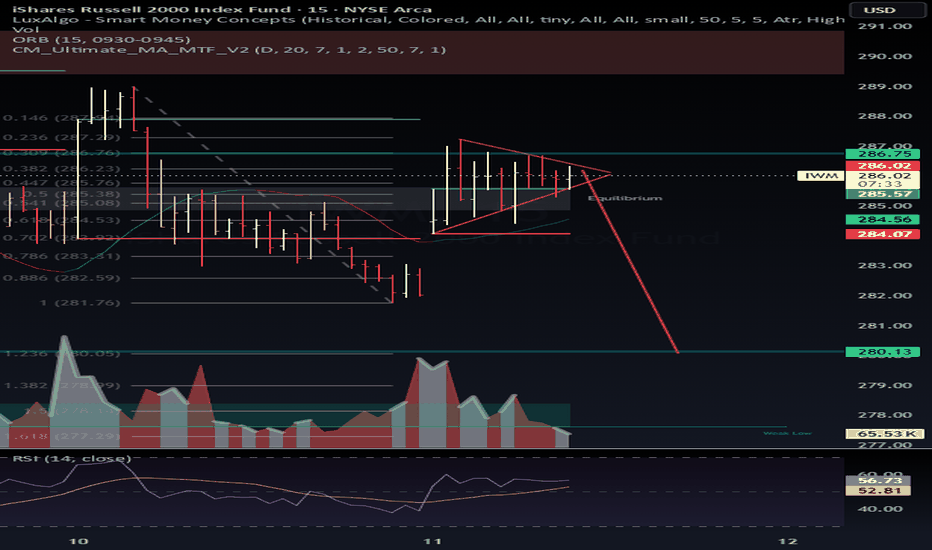
$IWM coiling in a symmetrical triangle at 285.94 equilibrium🌑 𝗜𝗪𝗠 𝗕𝗥𝗘𝗔𝗞𝗗𝗢𝗪𝗡 𝗪𝗔𝗧𝗖𝗛 ▪ 𝟬𝟲.𝟭𝟭.𝟮𝟬𝟮𝟲
AMEX:IWM coiling in a symmetrical triangle at 285.94 equilibrium. Compression after a failed reclaim of the 286.75 fib shelf. RSI flat at 56, no momentum behind the bounce. Volume bleeding out at the apex.
The scenario (paper, not a position):
▸ Trigger: 15m close below 285.57 ORB level
▸ Confirmation: loss of 284.55 MA cluster and 284.07 ORB low
▸ Target zone: 280.13, the 1.236 extension and prior demand
▸ Invalidation: acceptance back above 286.75
Weak low sits beneath at 277. If sellers take the apex, the air pocket to 280 is real. If bulls reclaim 286.75, the structure flips and this thesis dies. Either way, the levels decide, not the opinion.
Process over prediction. Risk-first, always.
#wavervanir #volanx #quant #optionsflow #algorithmictrading
XLKAfter several months of sustained upward movement, XLK entered a corrective phase characterized by profit-taking and weakening bullish momentum. This decline has brought price into the MA02 demand zone, where early signs of seller capitulation have started to emerge.
At the same time, a clear bullish divergence has formed on the RSI, supporting the possibility of a shift in the current bearish momentum.
However, the market still faces two primary scenarios:
• Scenario 1: Price maintains the current reversal conditions, transitions into an MT Markup phase, and successfully breaks above the 185–188 resistance area, confirming the beginning of a new Major Markup phase.
• Scenario 2: The current recovery attempt fails, leading to another decline toward the 171–173 demand zone before the market establishes its next directional move.
Price behavior around these key levels will be crucial in determining which scenario ultimately plays out.
This analysis reflects a technical view based on market structure and price action and should not be considered investment advice.
SPY - A Swing Low Was Just SweptSPY Has Given Back Most of the April Rally in Two Weeks. A Swing Low Was Just Swept.
Whether that sweep holds or fails is this morning's question.
Structural Assessment
SOM is reading Impulse Cont. Bear on SPY 1H.
15 primary FVGs alive, 12 touched. The obligation pool
built during the April-May rally is being systematically
worked. 12 touched against 15 primary means 80 percent
of current obligations have been engaged. The market is
not ignoring structure on the way down.
ACE is GREEN with Q2 neutral. CQI 58.5. Last Ann was
Bull CQI 71.22, 156 bars ago. Direction neutral against
a bull announcement from 156 bars back. The conviction
that was present at the high has fully decayed.
IMP is scoring 1/5. NONE mode. WAIT.
SwLo Swept: YES. A swing low was taken out.
RCZ at 26th pct, ATR at 48th. Neither elevated.
Vol Elev at 2nd percentile -- volume has not confirmed
the sweep. A swing low sweep without volume is a
structural note, not a signal.
Anti-signal: clear. The sweep itself is not flagged
as a liquidity grab by the stack -- it cleared cleanly.
Tactical Cheat Sheet
Resistance: 732-733 -- nearest overhead level
Key resistance: 737.57-738.47 -- prior FVG cluster base
Hard resistance: 741-742 -- dense FVG overhead
Current price: 730.63
Support: 728.00 -- intraday structural level
Key support: 721.23 -- session Low, thesis line
Extended support: 703.07 -- daily obligation cluster
SwLo Swept context:
The swing low sweep with Vol Elev at 2nd percentile
is not a confirmed breakdown. It is a probe. Price
tested below the prior low without volume conviction.
Two outcomes follow from here:
Reclaim path (sweep as liquidity grab):
Price reclaims 732 at open with Vol Elev entering
IMP scores 1+ with PART mode loading
The sweep was a stop run, not a breakdown
Target: 737-742 FVG cluster fill
Continuation path (sweep as breakdown):
Price fails to reclaim 732 on first attempt
Vol Elev enters and drives price through 728
IMP loads EXT mode with ATR expanding
Target: 721.23 test
What the Stack Is Watching
The swing low sweep is the event. Volume is the
verdict. If volume does not enter at the open to
confirm direction, this is noise in a bear structure,
not a signal in either direction.
RCZ at 26th pct is the watch variable. If it starts
climbing toward 60th in the first hour, the
participation sub-system is activating. That is when
the sweep resolves into a tradeable setup.
---
Built with SYNTHESIS v3.3 | SOM / ACE / IMP / SYNTHESIS
Study, not financial advice.
My price targets for 06/11/2026
For research purposes only. This is not investment advice. Past performance is not indicative of future results. Do your own Due Diligence.
----Main Target----
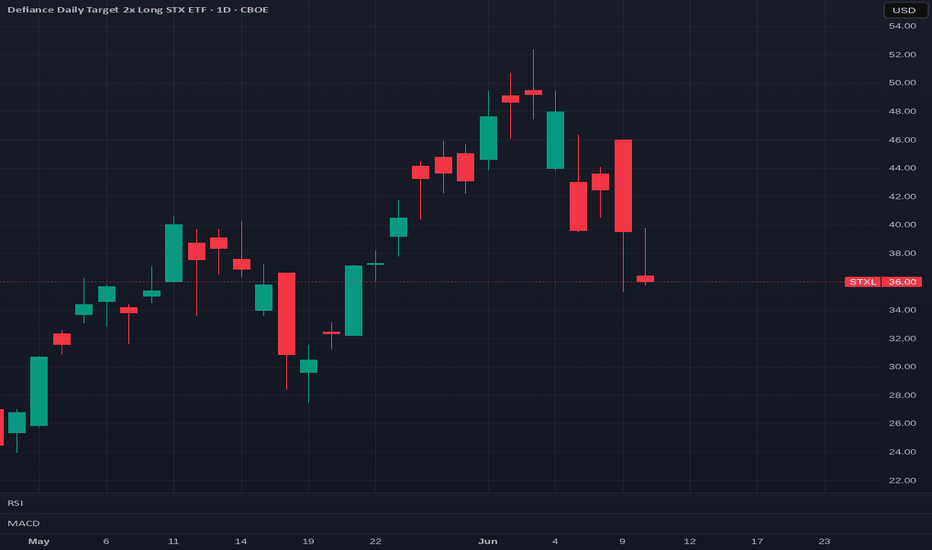
CBOE:STXL
Trading date: 06/11/2026
Target price: $36.72
Previous close: $36.00
----Other Potential Targets----
CBOE:KEEX
Trading date: 06/11/2026
Target price: $101.71
Previous close: $99.23
NASDAQ:VRTL
Trading date: 06/11/2026
Target price: $116.14
Previous close: $114.99
NASDAQ:MSDD
Trading date: 06/11/2026
Target price: $49.22
Previous close: $47.79
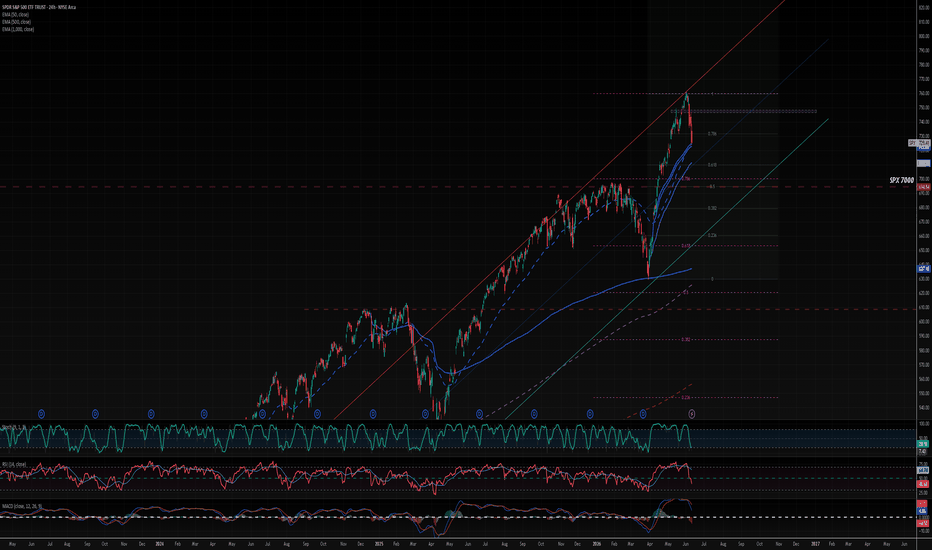
**The S&P 500 Hourly Trend Has Turned Bearish**For nearly two months, every dip was a buying opportunity.
That may no longer be the case.
The latest hourly trend signal has flipped to **Short**, marking the first meaningful deterioration in market structure since the spring rally began.
A few things stand out:
🔹 Lower highs are forming
🔹 Recovery attempts are getting weaker
🔹 Key short-term support has broken
🔹 Sellers are starting to control rallies instead of buyers
What's even more interesting is that recent price action has now moved beyond a normal pullback and into downside extension territory.
The big question isn't whether the market is weak today.
The big question is:
**How much downside risk remains if buyers fail to regain control?**
I'm watching several important support zones that could determine whether this becomes:
✅ another routine pullback
or
⚠️ the first significant correction in months.
I've posted the full breakdown, including trend analysis, support levels, Fibonacci targets, and what would invalidate the bearish scenario.
👉 Full analysis available through my profile.
What do you think?
Is this just another dip to buy, or is the market finally entering a deeper correction?
Sideways?I'm sure everyone has their own opinions on where this can go but the market is definitely bearish and CPI data doesn't help. I guess the question is where do we think this can go and I think it was over inflated in the first place but we might see some sideways action going forward. Else, this thing can continue on down to 710 but I kinda doubt it. For now, I think it's a good idea to stay out and just watch until a better opportunity shows itself.
Technology vs SPYThe SPDR Technology Sector is at the same relative valuation vs SPY right before the 2000s dot com era came to an end. I'm closely monitoring this in combination with any deterioration in earnings revisions or a breakdown in price action. My guess is we may go above the 2000 XLK/SPY level similar to CSCO and INTC in 2026.