UK 10Y Gilt Yields: Regime Change or Final Rejection?Overview
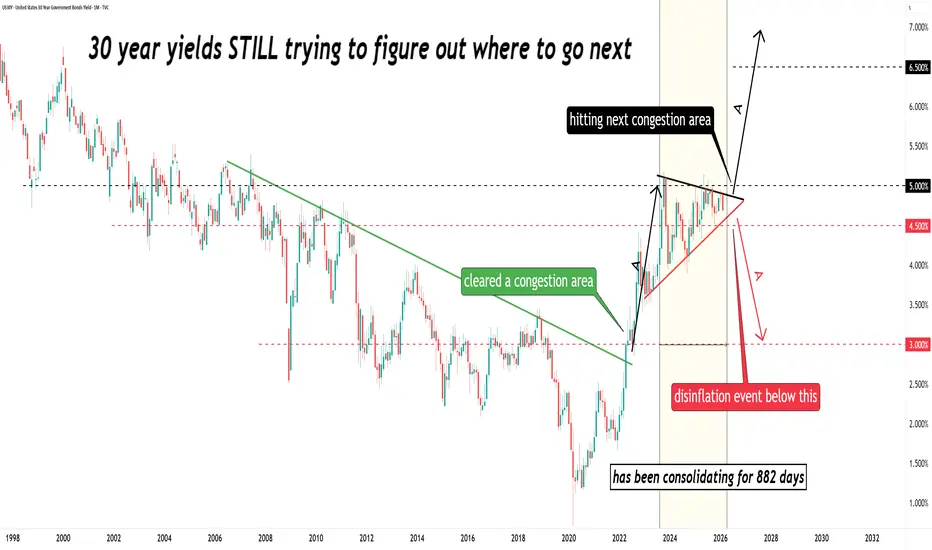
TVC:GB10Y UK 10-year gilt yields have spent four decades in one of the cleanest descending channels in financial history. That regime broke post-2020, marking a potential shift from suppressed rates to a structurally higher yield environment. Yields are now pressing against a major decision zone — one that could define the next multi-year move.
The Big Picture
From the 1980 peak of ~17%, yields traced a relentless downtrend through disinflation, globalisation, and four decades of monetary easing. The COVID low marked the logical terminus of that era. Since then, the long-term channel has broken — driven by inflation, fiscal expansion, and tightening liquidity conditions.
The low in yields is likely in. The question is what comes next.
Current Structure
Following the 2020 lows, yields have built a rising base and formed an ascending triangle into long-term horizontal resistance. Flat top. Rising lows. A textbook bullish continuation pattern — now compressing directly into the 4.5–5% zone that acted as a floor throughout the 1990s and early 2000s.
This is not just a technical level. It is a macro inflection point.
The Decision Zone: Two Scenarios
4.5–5% should be treated as a range, not a precise line.
1) Break and hold above resistance
Confirms the higher yield regime and opens the path toward 6%+ over time
Tightening financial conditions across the broader economy
Sustained pressure on mortgage holders and UK government borrowing costs
Raises the probability of fiscal stress — potentially disorderly
2) Rejection at resistance
Signals continuation of a broad multi-year range
Suggests the market is not yet ready for sustained higher yields
Could align with slowing growth, disinflation, or direct policy intervention
Macro Implications
If yields break higher and sustain, the consequences are tangible: debt servicing costs rise materially, housing affordability deteriorates further, and risk assets face tighter liquidity conditions. A disorderly move would raise the spectre of a gilt market stress event — and force a policy response.
Conclusion
The long-term trend has already shifted. Forty years of falling yields is behind us. But confirmation of the next leg depends entirely on how price reacts at this resistance zone.
This is a decision point, not a confirmed breakout. What happens at 4.5–5% over the coming months will matter — not just technically, but across the entire UK economy.
b]What I'm Watching
Monthly closes relative to the 4.5–5% range
Follow-through and momentum after any breakout attempt
Signs of rejection, exhaustion, or policy intervention at resistance
Not financial advice.  Short
Short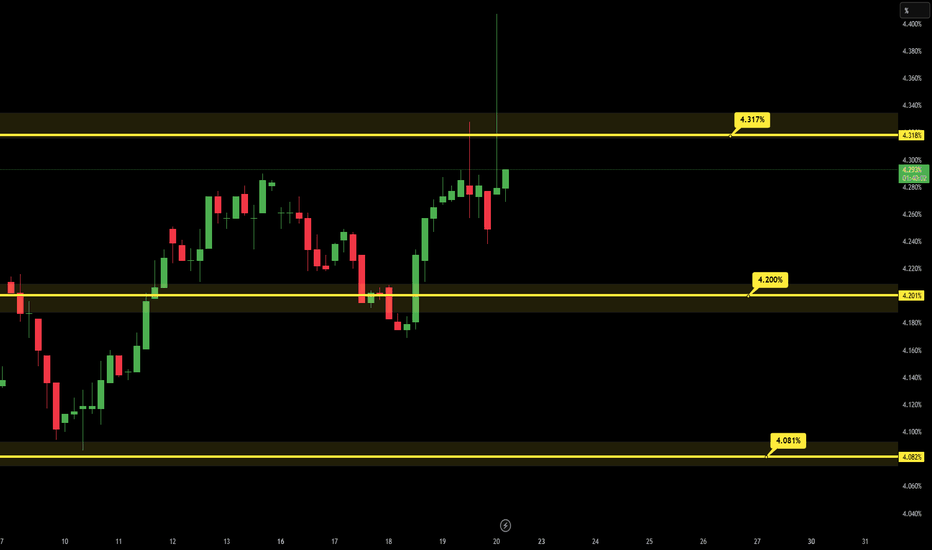
Long 
Long 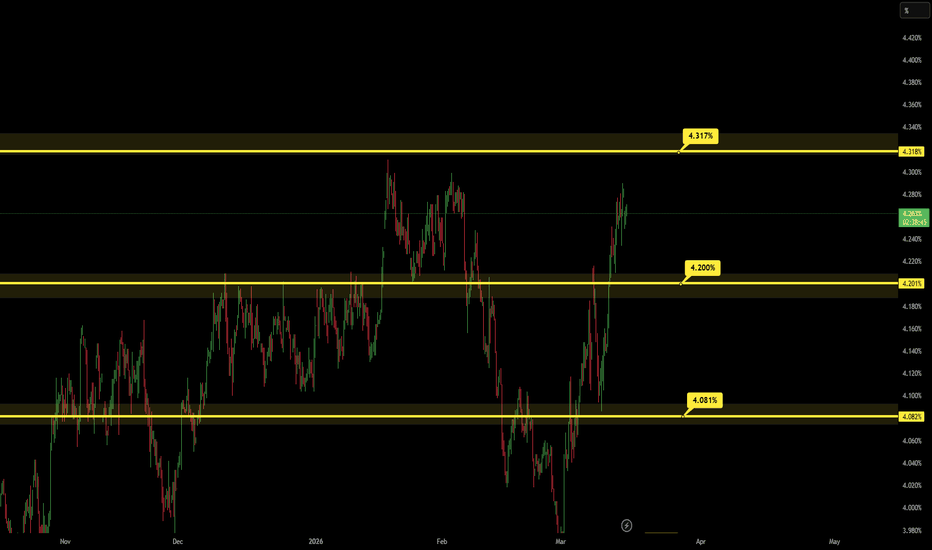
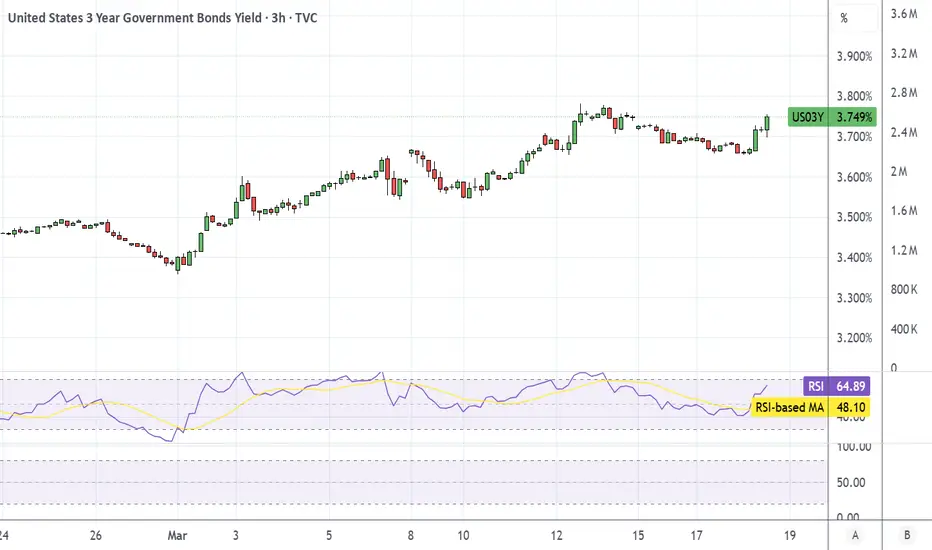
US 10Y TREASURY: Nervousness ahead of Fed meetingThere are currently a lot of topics which are bringing insecurity among investors, which is one of the main reasons for a huge swing in the 10Y Treasury yields since February this year. The first place is the US macro picture which is bringing some of the latest data pointing to a weaker than expected growth of the US economy. As per posted second estimate of Q4 GDP Growth, the US economy grew only 0,7% q/q, while the market was expecting to see at least 1.4% for the same period. Adding to this potential for increased inflation due to surging oil prices, the outlook for the future economic output does not look as bright as previously expected by investors. US Treasuries are reacting with a strong shift, from 3,93% at the beginning of March, till 4,28% reached on Friday.
The nervousness of the market is expected also to stay active during the week ahead. The FOMC meeting is scheduled for Wednesday, when the Fed will post their economic projections. Considering the current unstable macro environment and geopolitical developments, the market will very closely listen to the speech of Fed President Powell, and act accordingly. As per charts, the level of 4,3% will be tested, however, some relaxation is possible after that level is reached. In this sense, the level of 4,21% will be the one to watch in the coming period.
S&P 500, Oil Shock, and Why Recession Risk Is Rising?Almost two years ago, in my post “ A Recession Is Coming - Brace for Impact ”, I talked about the inverted yield curve as a warning sign. Now the curve has already un-inverted, and that part matters a lot.
In my opinion, the inversion is usually the warning, and the un-inversion is often when the economy starts to feel the pressure that the bond market had already priced in earlier.
The New York Fed’s model, updated with data through January 2026, shows a January 2027 recession probability of 18.8%
The U.S. economy was already slowing down before this recent oil shock and the rising tension in the Middle East. U.S. real GDP growth for Q4 2025 was revised down to 0.7%, versus 4.4% in Q3, and the unemployment rate in February 2026 was 4.4%. That is not a collapse, but it is not a strong backdrop either.
In my recent post, “ S&P and a very timely correction for the U.S. president ”, I mentioned this chain:
Higher Oil Price --> Higher Inflation --> Higher Rates (or fewer cuts) --> Lower Corporate Profits --> Lower Equities
I still think that chain is very relevant.
Why? Because this is not just about oil going up on a headline. Oil is up sharply, and the Strait of Hormuz disruption is threatening a route that carries a very large share of global oil supply, more than 20%. If this persists, it can push transportation costs, production costs, and consumer costs higher again. That is how a geopolitical shock turns into a macro problem.
And we have seen this type of reaction before. During major geopolitical conflicts that affected energy markets, like the 1973 oil embargo, the 1979 Iranian shock, the 1990 Gulf crisis, and even the 2022 Russia-Ukraine war. As a result, oil moved higher, inflation pressure increased, and equities came under stress. Of course every cycle is different, but the pattern is often similar: when energy becomes more expensive, margins get tighter, growth slows down, and the S&P starts repricing that risk.
This is where the word stagflation becomes important.
For anyone new to the term, recession means slower growth, weaker demand, and a softer labor market.
Stagflation is when growth slows down while inflation stays high or moves higher again.
That is a much more difficult environment for the market, because the Fed cannot support the economy as easily if inflation is still being pushed up by energy. So even if growth weakens, policy may stay tighter than the market wants.
Then we have the private credit side of the story.
This part is also important. When firms like Morgan Stanley, BlackRock, and BlackStone among others, start limiting withdrawals in private credit funds, it tells us something. It doesn't automatically mean crisis but it does mean that liquidity is not as strong as it looks in calm markets. That is the kind of thing we need to watch closely, because credit stress can spread into risk assets very quickly.
So for me, the bigger picture is this:
Old yield curve warning still matters
Growth was already slowing
Oil shock is adding fresh inflation pressure
That limits how supportive the Fed can be
And private credit is starting to show signs of stress
That doesn't mean 2026 has to become another 2008 GFC. The structure of the risk is different. But it means that the probability of recession or even stagflation is higher than many people want to admit right now.
So when I look at the S&P 500 chart here, I do not just see a technical setup. I see a market that may still be underpricing a macro environment that can get worse before it gets better.
What do you think? Do you think a recession is looming?
Share your thoughts with me in the comments. Long 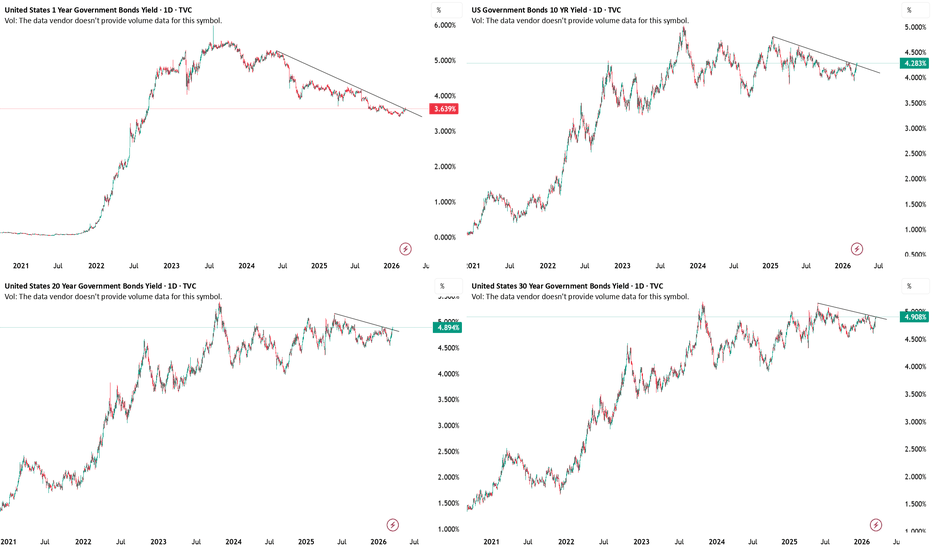
Short 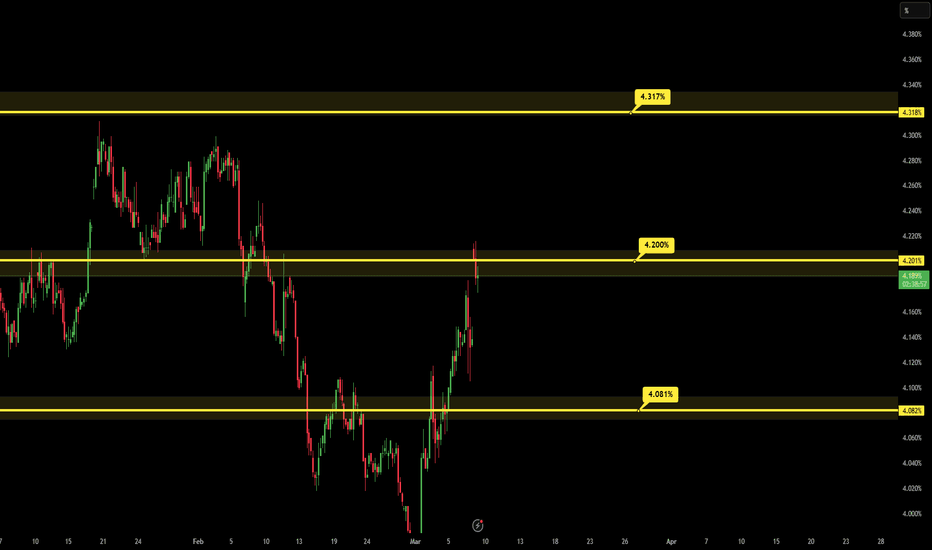
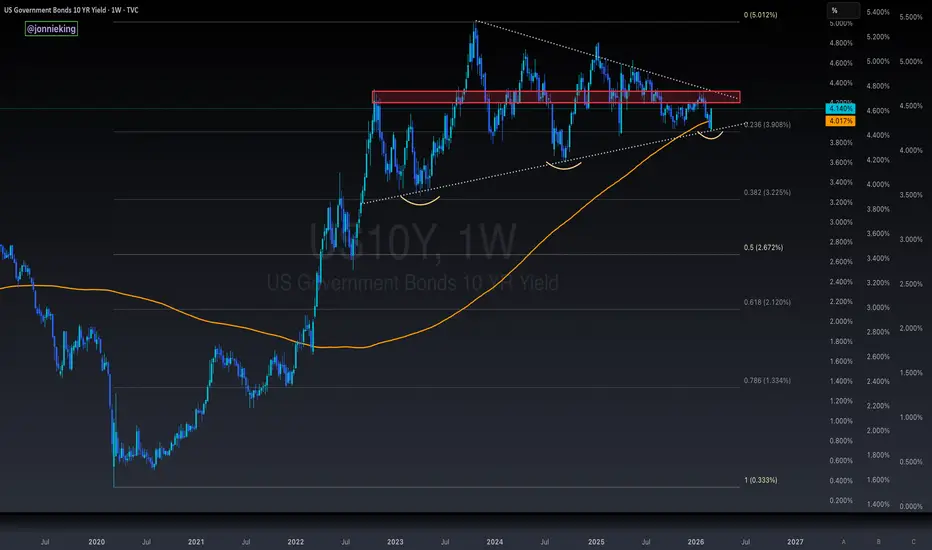
US 10Y TREASURY: Volatile on inflation riskMiddle East tensions, rising oil prices and weakening job market had a huge impact on 10Y US Treasuries during the previous week. There has been significant volatility, where yields sharply rose from 3,92% up to 4,18%, closing the week at 4,13%. Due to conflict in the Middle East, the price of oil was significantly increased, threatening a new wave of inflation across developed economies, but also in the US. This will make the Fed's decision to cut interest rates extremely difficult. If we add to that evidently weakening US jobs market, then we have the worst combination in the economy called stagflation - weak economic output and high inflation, an extremely difficult task for any central bank. Such a situation brings an additional layer of uncertainty among investors.
Volatility might continue also during the week ahead. Again on Friday important data will be released. The PCE data and JOLTs will be posted, which might bring additional nervousness to the market, especially if inflation shows persistence. In this sense, the 4,2% might easily be tested in the week ahead. On the opposite side, a short pull-back toward the 4,1% might be an option.
Short 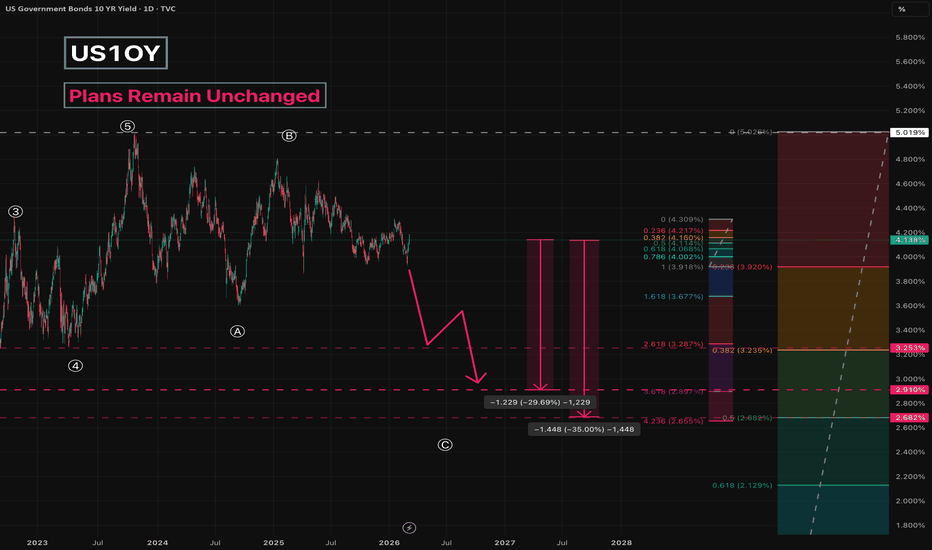
Long 
Short 
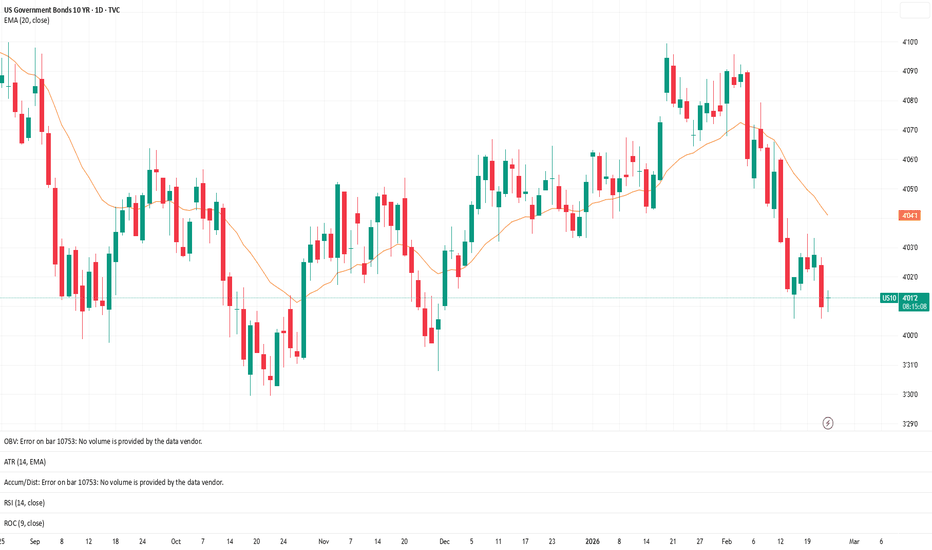
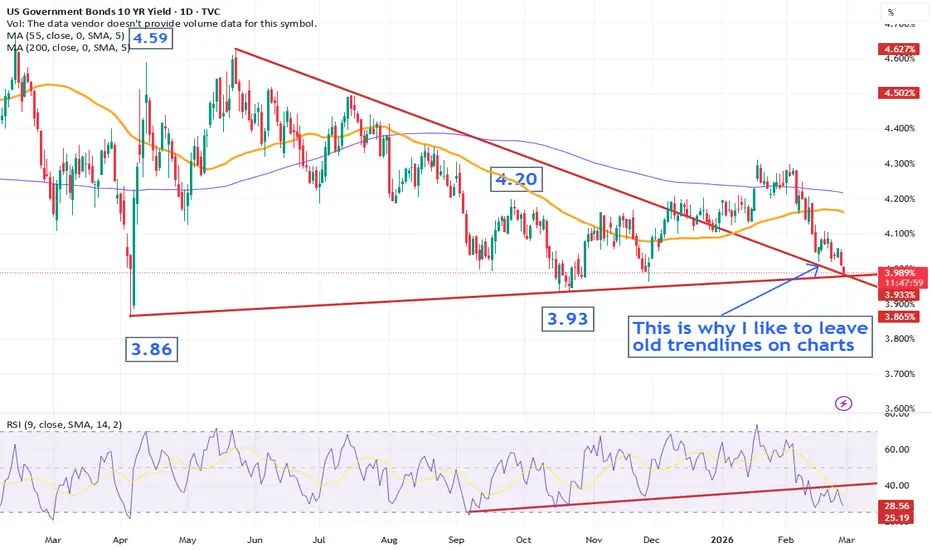
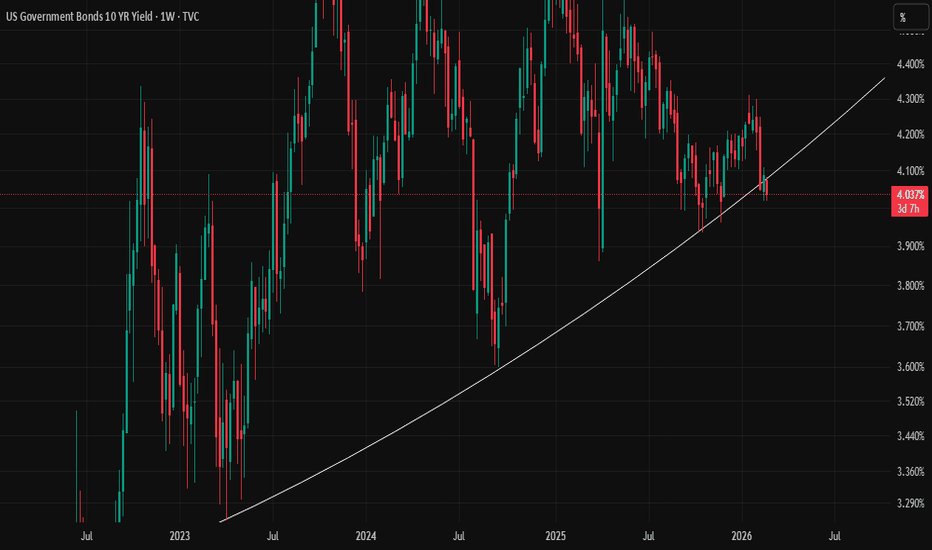
US 10Y TREASURY: Rising stagflation risk Although the 10Y US Treasury yields were holding ground above the 4% during the week, still, Friday's PPI data moved yields toward the lower grounds, closing the week at 3,96%, after reaching 3,94%. January PPI data came hotter than expected, with 0,5% surge for the month and 2,9% y/y. Core PPI reached 3,6% y/y. The cautious positioning of investors reflected expectations that hotter inflation data could reinforce the case for the Federal Reserve to keep rates steady, prompting some bond buyers to lock in existing yields. At the same time, markets were digesting recent economic signals, including stronger producer price pressures that could complicate the outlook for rate cuts.
After a sharp drop in yields during the last two days of the week, it could be expected some short reversal as of the start of the week. In this sense, the 4,0% could be tested for one more time. Still, it should be considered that Friday brings NFP data, which could bring volatility back also on the Treasury market. On the downside, the 3,93% level has been shortly tested on Friday, which is the lowest level from October last year. The next level to the downside could be 3,86% however, the probability for it is extremely low at this point. Depending on macro data, this level could be watched in a longer period of time, and certainly not for the week ahead.
Long 
Short 
Short 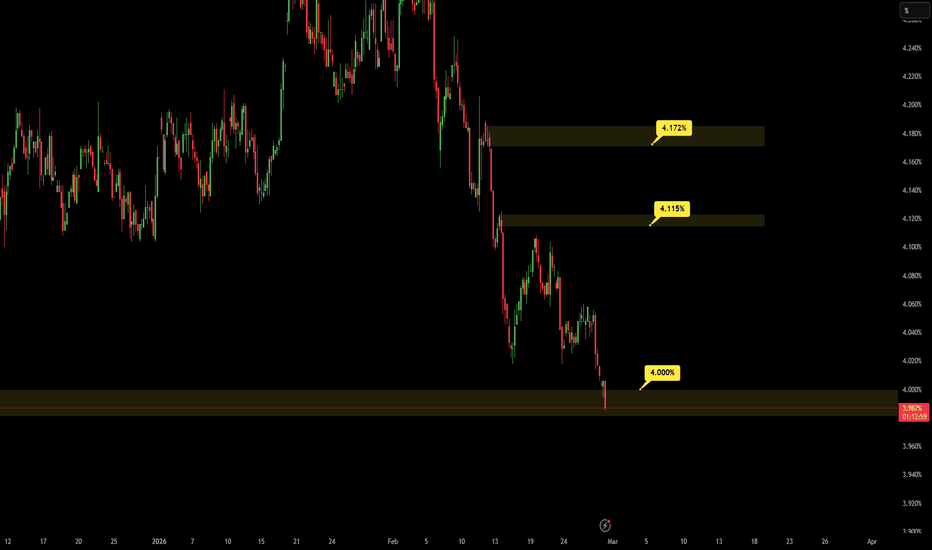
Education