ahhhh ! - dollar strong,ahhhh ! - dollar strong, USA Exporting more and more- the dollar is solid... the USA markets are the most liquid in the world - what is there to think about it? ?????? and the USA has a rrr of 10 , while china is massively levered with a rrr of barely 7.5 - I don't see the hesitation that your post implies.....
The USA - massive commodity reserves
The USA - Energy Exporter - now the largest in the world
The USA - massive agro production feeding the world
The USA - Zero beurocracy comared to
ETF market
TLT Downside Targets & Implied 10Y Yield Read-ThroughsTLT Downside Targets & Implied 10Y Yield Read-Throughs
TLT Target 1: 63.5 | Implied 10Y Yield: 5.60% – 6.10%
TLT Target 2: 55.5 | Implied 10Y Yield: 6.30% – 7.00%
Macro Takeaways
Duration Math: A move to TLT 63.5 (~26% drawdown) requires a +160–190 bps surge in long-end yields. Assuming a 0.75–0.90 10Y/30Y beta, the US 10-year yield lands at 5.60%–6.10%.
Extreme Downside Scenario: A drop to TLT 55.5 (~35% drawdown) implies a +230–280 bps move at the long end, pushing the 10-year yield into t
TLT: the yearly target at 77.89 gave way on a closeTLT has been below its yearly pivot at 87.40 since July, so the yearly bias is down. On September 29 it reached the yearly target at 77.89, the level where a short-side process takes profits, and on September 30 it closed below it. A daily close beyond a target opens the next level: the October monthly target at 75.07, then the second yearly target at 72.49. For anyone still short, 77.89 is now the line to hold: a daily close back above it would say the move is pausing. Options currently price T
Research 01.10.2026🌏 Markets:
AMEX:SPY +3.08 +0.40%(pre/m)
NASDAQ:QQQ +4.32 +0.58%(pre/m)
🆕 Economic News:
Nasdaq futures rise on Micron's AI-driven outlook while Dow futures hit a three-month low as the 10-year Treasury yield tops 5.3%, its highest since 2002
08:30 USA – Initial Jobless Claims
09:05 USA – Fed Barkin, Collins and Schmid Speeches
10:00 USA – ISM Manufacturing PMI
10:00 USA – Construction Spending
10:30 USA – EIA Natural Gas Stocks Change
15:30 USA – Fed Williams Speech
18:45 U
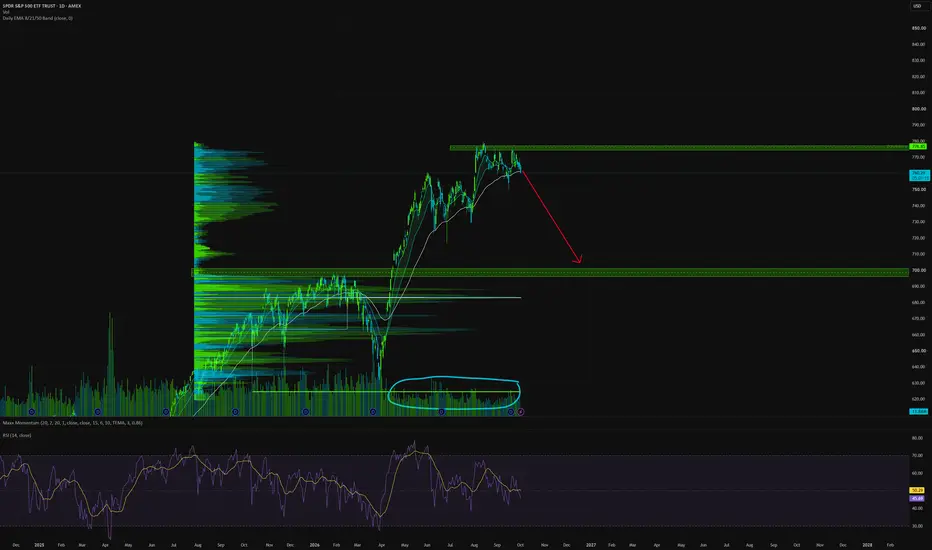
SPY Is Back On The 765.52 Line Premarket.SPY Is Back On The 765.52 Line Premarket.
SPY is trading 765.51 premarket, back on the 765.52 line after Wednesday's session closed at 762.63, having dipped to 762.18 intraday without closing below 762.36. A premarket print is not a close, so nothing has been reclaimed yet. Both the hourly and 4H dashboards show no active thesis and neutral readings, and the 4H's last conviction print was to the downside. ISM manufacturing lands at 10:00 ET, and the reaction to it sets the read, not the premark
ARKK: Big Cup Above 50 SMA at Resistance💡 Swing setup idea
50 SMA Strategy
🔎 Analysis summary:
The innovation ETF has reached resistance. We can also see a closing of a big cup above the 50-day moving average. This alignment of trend, pattern and level makes the breakout area key to watch. The upside potential is projected by the depth of the cup from the breakout point.
👀 Levels to watch:
Entry trigger: Break above $92.65
Target: $121.70
Stop: Under the resistance
💬 Will ARKK break through resistance and continue higher? Le
Tips for Setting Up a Dedicated Short-Selling Strategy (Part 2)As mentioned in the previous article, one method to find short-selling signals is to refer to Market Depth and Order Flow.
First, Market Depth refers to the changes in order price and volume for Bid 1–5 (buy orders) and Ask 1–5 (sell orders).
Ask 1 – Ask 5 (Ask 1 to Ask 5): Represents the five lowest prices in the market where sellers are waiting for orders to be executed, arranged from lowest to highest. Ask 1 is currently the cheapest selling price.
Bid 1 – Bid 5 (Buy 1 to Buy 5): Represent
Optimistic October?October has reasons to be optimistic. Whether that optimism can survive another round of inflation data, elevated Treasury yields, and a demanding earnings season is the question. My highest-weighted scenario remains Yellow: an early recovery that encounters renewed pressure, followed by an opportunity to rebuild before the month ends. A positive October close is possible, but the path there could be uncomfortable.
September reinforced why I map several outcomes. The market can reach an anticip
$SPY & $SPX — Levels for Thursday, October 1, 2026🔮 AMEX:SPY & SPCFD:SPX — Levels for Thursday, October 1, 2026
📊 Key U.S. Economic Data (ET)
8:30 AM | Unemployment Claims | Forecast: 201K | Previous: 197K
10:00 AM | ISM Manufacturing PMI | Forecast: 54.8 | Previous: 54.6
10:00 AM | Fed Speaker: FOMC Member Waller Speaks
⚠️ For informational purposes only. Not financial advice.
📌 #SPY #SPX #StockMarket #Trading #TechnicalAnalysis
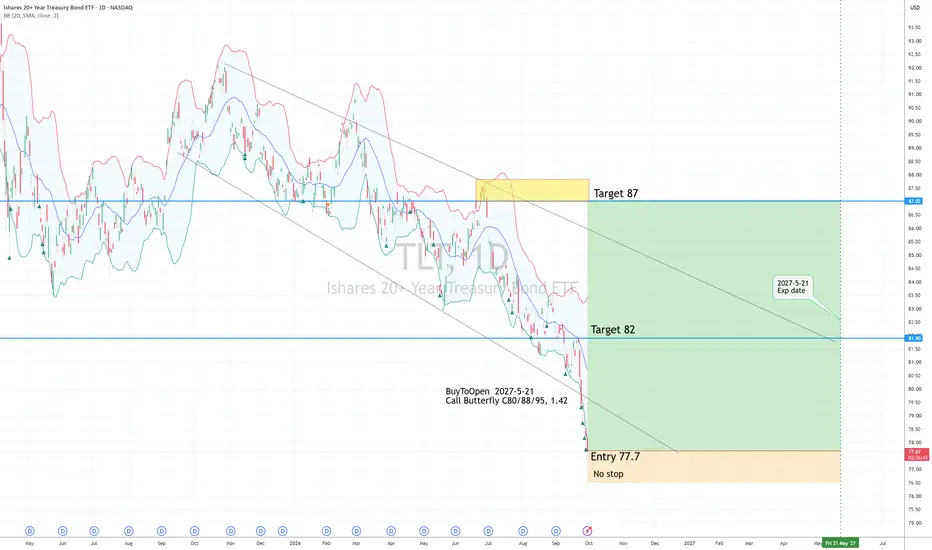
TLT Long Bollinger Band oversold in both weekly and daily charts
Entry 77.7
no Stop
Target 82, 87
Risk management is much more important than a good entry point.
I am not a PRO trader. About 25% of my trades had been stopped quickly.
I do not know where is the bottom. Before see a valid turning point, hold on selling PUT.
Below 80, when TLT drops each $0.5, I would make one more long entry with cost under $200. if try 10 times, total risk under $2000.
BuyToOpen 2027-5-21 Call B
Price Action for week of 9/28/26Last week we closed into the gap between 772.31 – 770.27.
I’m looking for SPY to break the lower end of that gap early in the week — ideally by Wednesday.
The goal is a move down toward 766 for one final dip before turning higher. A breakout above 772 mid-to-late week would serve as confirmation.
I expect us to finish the week above 773. A move through 774 at any point before Friday would add strong momentum heading into the next monthly candle.
Moo
$IWF: A Darvas Box Setup?Fund Overview
IWF is an ETF that tracks the Russell 1000 Growth Index. Its ten largest holdings are:
• NASDAQ:NVDA
• NASDAQ:AAPL
• NASDAQ:GOOGL
• NASDAQ:MSFT
• NASDAQ:AVGO
• NASDAQ:META
• NASDAQ:MU
• NASDAQ:TSLA
• NASDAQ:AMD
• NYSE:LLY
Technical Setup
The ETF has been consolidating since April. Given the strength of its largest holdings, I expect a breakout to the upside soon.
Entry Plan
I have set an alert for a breakout above the consolidation range. If it triggers, I
Q3 closes narrow: semis +11% while 11 of 15 sectors fellOver the last 20 sessions, only 4 of the 15 sector and theme ETFs I track are up: SMH (+11.3%), XLK, MAGS and XLC. Utilities (-6.7%), real estate and materials led the downside.
Cyclicals beat defensives by almost 5 points, so the tape reads risk-on. But it is carried by a handful of names, and small caps (IWM) closed below their line this week.
The catch: SMH, the leader of the month, is still below its Q3 pivot at 634.35 (the line on the chart). Pivots reset tomorrow with Q4. What I watch: w
Research 30.09.2026🌏 Markets:
AMEX:SPY +0.26 +0.03%(pre/m)
NASDAQ:QQQ -1.16 -0.16%(pre/m)
🆕 Economic News:
Stock futures mixed as Treasury yields hold near multidecade highs ahead of PCE inflation data
08:15 USA – ADP Employment Change
08:30 USA – Core PCE Price Index
08:30 USA – PCE Price Index
08:30 USA – GDP Growth Rate (Q2 Final)
08:30 USA – Personal Income and Spending
09:45 USA – Chicago PMI
10:30 USA – EIA Crude Oil Stocks Change
13:30 USA – Fed Barkin Speech
17:10 USA – Fed Goolsbee
SPY - 765.52 Is The Level To ReclaimSPY Is Neutral After The Long Closed - 765.52 Is The Level To Reclaim.
SPY is at 764.55 in premarket, just under the 765.52 reclaim level after closing Tuesday at 764.29, which ended the long taken September 23. The read is Neutral with no directional trigger in place. The hourly structure has turned bullish while the 4H stays bearish, and PCE and GDP land at 8:30 before the open. Neutral.
Resistance: 765.52 - the reclaim level
Key resistance: 770.09 - the shelf lost last week
Current price: 7