Weekly Bias — 29 JuneThe June low around $686 was a sell-side liquidity sweep — price immediately reclaimed it & now we're seeing the opposite, repeated failures above $740-$748 → buy-side liquidity being harvested
Price hasn't made a major lower low, but RSI has rolled over to approximately 46
Momentum is deteriorating faster than price
MACD histogram continues expanding negatively
The signal line remains below zero
Momentum still favors sellers
The decline is occurring on average to slightly declining volume, not panic volume
Suggests profit taking, dealer hedging & systematic selling rather than institutional
liquidation
A close beneath $698 would materially weaken the bullish intermediate-term structure
The largest high-volume nodes remain around
$706
$687
$636
These become magnets if selling accelerates
Resistance
$719-$723 (20d EMA)
$729-$730
$740
$748
Support
$706
$698-$700
$687
$672
SPY is approaching the same inflection point
Current price sits almost directly on the rising 50d EMA
Average has supported every correction since April
If it fails, next support becomes $720 → $710
Momentum is exactly like QQQ, RSI falling & MACD bearish → momentum weakening
IWM isn't not confirming the weakness
Instead it's making new recovery highs, remaining above the 20d EMA & remaining above the 50d EMA
Relative strength has shifted toward cyclicals & small caps
Rotation is constructive for the broader market
If IWM also loses $292, then the market becomes much more concerning
The charts suggest growth is under pressure while cyclicals continue outperforming
Aligns with stable or slightly lower yields, less pressure on duration-sensitive stocks & leadership broadening beyond mega-cap AI
If yields unexpectedly rise sharply this week, QQQ is likely to underperform further while IWM's relative strength could fade
The $700-$706 area on QQQ & $729-$730 on SPY are the key levels from OI concentrations
QQQ has significant dealer interest around the $700-$715 area, which could act as a pin area if realized volatility stays contained
SPY shows notable 2-sided positioning, suggesting increased gamma around the current price & the potential for sharp moves if those levels break
IWM shows dealers have very large put exposure clustered between $280-$290, making that area a likely support level unless selling accelerates significantly
Based on recent realized daily movement
QQQ approximately ±16-20 points
SPY approximately ±12-15 points
IWM approximately ±6-8 points
Given the current technical setup, avoid chasing downside after several bearish sessions
If QQQ tests $697-$706 & shows evidence of stabilization (higher low, bullish reversal candle, or improving intraday breadth), the higher-probability trade would be buy ATM or slightly ITM QQQ calls
10-21 DTE
Initial upside targets $720, then $730, then $740
Thesis invalidation on a daily close below $698, with stronger confirmation if $687 fails
If QQQ rallies back into $720-$723 & is rejected on weakening momentum, that area offers a favorable risk/reward location for short-duration bearish exposure targeting a move back toward $700
The HTF trend still favors bulls, but the daily charts show a meaningful loss of momentum so the next several sessions are likely to determine whether this is merely a healthy correction within the April advance or the beginning of a deeper retracement
Using the AVWAPs, EMAs & the visible structure
Price probes $700 (55%) → briefly breaks to $697 → buyers defend 50d EMA → recover $719 → challenge $730
Immediate reclaim of $719 (30%) → close above $730 → squeeze toward $742 → retest highs
Need to see a strong daily close back above the recent-high AVWAP with improving RSI & MACD
Lose $698 decisively (15%) → $686 → $672 → 100d EMA
Would represent a deeper correction of roughly 10–12% from the high
The anchored VWAPs strengthen the bearish short-term case without invalidating the longer-term bull market.
Constructive again if QQQ reclaims $719 (20d EMA), closes above $730 (high AVWAP) & does so on expanding volume
Would suggest the recent breakdown was a bear trap rather than true distribution
Defensive if QQQ loses the 50d EMA (~$699) on a daily closing basis, the AVWAP from the June low starts acting as resistance instead of support & downside volume expands
Would indicate institutions are no longer defending the post-April uptrend
The most important support cluster (50d EMA + volume node + psychological $700 + nearby sell-side liquidity) — this confluence around $698–$705 is where we should expect the highest probability of a meaningful reaction since if buyers can't defend that area, the correction is likely to extend toward the 100d EMA near $670; conversely, if that level holds & price reclaims the AVWAPs, it would fit the pattern of a healthy correction within the broader uptrend rather than the start of a new bearish cycle
ETF market
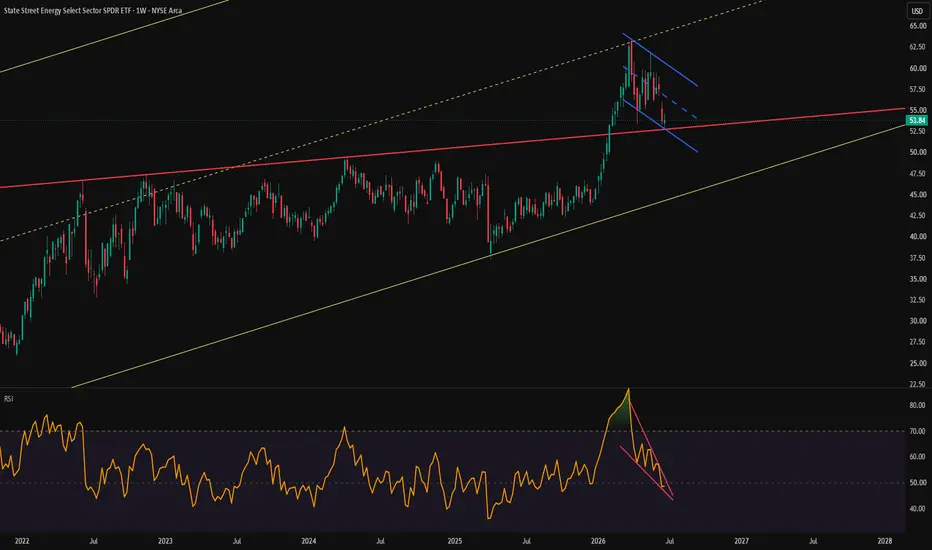
$XLE is very close....Xle has held up relatively well. Oil has been shorted to the ground while XLE is holding its support and breakout zone. What I love about this setup is the convergence of support levels and structural (bull flag) look. The moment xle sniffs a rebound in oil (temporary or long term), it will stage a nice run, possibly to the top of the flag or even a breakout. Even the rsi is forming a bullish falling wedge...
XMHQ - 28 months HEAD & SHOULDERS CONTINUATION══════════════════════════════
Since 2014, my markets approach is to spot
trading opportunities based solely on the
development of
CLASSICAL CHART PATTERNS
🤝Let’s learn and grow together 🤝
══════════════════════════════
Hello Traders ✌
After a careful consideration I came to the conclusion that:
- it is crucial to be quick in alerting you with all the opportunities I spot and often I don't post a good pattern because I don't have the opportunity to write down a proper didactical comment;
- since my parameters to identify a Classical Pattern and its scenario are very well defined, many of my comments were and would be redundant;
- the information that I think is important is very simple and can easily be understood just by looking at charts;
For these reasons and hoping to give you a better help, I decided to write comments only when something very specific or interesting shows up, otherwise all the information is shown on the chart.
Thank you all for your support
🔎🔎🔎 ALWAYS REMEMBER
"A pattern IS NOT a Pattern until the breakout is completed. Before that moment it is just a bunch of colorful candlesticks on a chart of your watchlist"
═════════════════════════════
⚠ DISCLAIMER ⚠
The content is The Art Of Charting's personal opinion and it is posted purely for educational purpose and therefore it must not be taken as a direct or indirect investing recommendations or advices. Any action taken upon these information is at your own risk.
QQQ: Bullish Continuation & Long Trade
QQQ
- Classic bullish formation
- Our team expects growth
SUGGESTED TRADE:
Swing Trade
Buy QQQ
Entry Level - 706.80
Sl - 700.93
Tp - 717.93
Our Risk - 1%
Start protection of your profits from lower levels
Disclosure: I am part of Trade Nation's Influencer program and receive a monthly fee for using their TradingView charts in my analysis.
❤️ Please, support our work with like & comment! ❤️
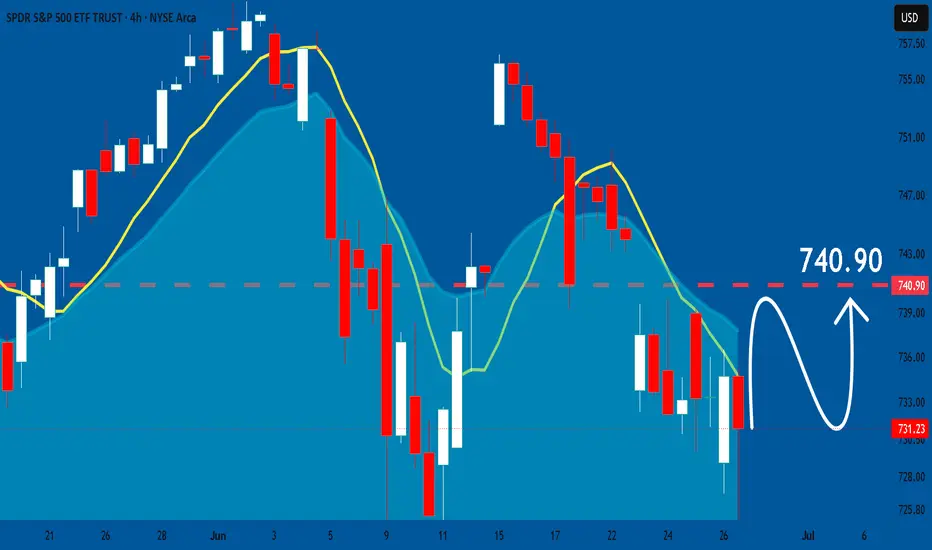
SPY What Next? BUY!
My dear subscribers,
This is my opinion on the SPY next move:
The instrument tests an important psychological level 731.23
Bias - Bullish
Technical Indicators: Supper Trend gives a precise Bullish signal, while Pivot Point HL predicts price changes and potential reversals in the market.
Target - 738.14
About Used Indicators:
On the subsequent day, trading above the pivot point is thought to indicate ongoing bullish sentiment, while trading below the pivot point indicates bearish sentiment.
Disclosure: I am part of Trade Nation's Influencer program and receive a monthly fee for using their TradingView charts in my analysis.
———————————
WISH YOU ALL LUCK
NVDA Targets with overall market analysis.My Technical Thesis
The chart appears to be in a late-stage momentum advance after a strong rally. Rather than continuing straight higher, the stock could spend several weeks shaking out weak hands before making another attempt at new highs.
Bearish Scenario (Higher Probability in the Near Term)
Target 1: $184–186
This would be a normal pullback into prior breakout support.
Expect buyers to appear here first.
Target 2: $175–178
Roughly an 8–10% correction from current levels.
This would still leave the longer-term uptrend intact.
If this level holds, it would be a very healthy reset.
$165–170
Late July or early August
This is where I'd expect institutions to become aggressive buyers if the broader market also weakens. I feel as though a lot of buyers are still in profit and will sell a bit to lock in their gains.
This is not financial advice. Please don't take advice from a guy on tradingview. No Way!!! Trade wisely.
Tug of War on a SeeSawThat Selling Spike and Daily Candle for me was extraordinary. Who is in control? Friday left behind a curious combination: aggressive selling volume paired with a daily candle that closed in near equilibrium. Long upper wick. Long lower wick. Barely a body.
The volume suggests conviction. The candle suggests neither side could finish the job.
To me, that's less a victory than a tug o' war on a seesaw. Bulls defended. Bears pushed back. Both walked away unsatisfied.
The gaps below haven't disappeared. Neither has the uptrend. Monday should tell us which side finally gains leverage.
Expecting pullback in QQQDouble Top formed over the past weeks on QQQ
Large sell pressure at 308 price levels
Key Support Level:
$285 (minor structure)
$268 (150 SMA - mid-term support)
$260 (200 SMA - strong floor)
Entry around $260 - $280
The chart is healthy long-term, uptrend structure intact, price above all major SMAs. But we just printed a Weak High at $308 and a CHoCH. This is a textbook pause and digest setup, not a buy-now entry.
SPY: Forecast & Technical Analysis
Remember that we can not, and should not impose our will on the market but rather listen to its whims and make profit by following it. And thus shall be done today on the SPY pair which is likely to be pushed up by the bulls so we will buy!
Disclosure: I am part of Trade Nation's Influencer program and receive a monthly fee for using their TradingView charts in my analysis.
❤️ Please, support our work with like & comment! ❤️
QQQ Massive Long! BUY!
My dear subscribers,
QQQ looks like it will make a good move, and here are the details:
The market is trading on 706.69 pivot level.
Bias - Bullish
Technical Indicators: Both Super Trend & Pivot HL indicate a highly probable Bullish continuation.
Target - 721.69
About Used Indicators:
The average true range (ATR) plays an important role in 'Supertrend' as the indicator uses ATR to calculate its value. The ATR indicator signals the degree of price volatility.
Disclosure: I am part of Trade Nation's Influencer program and receive a monthly fee for using their TradingView charts in my analysis.
———————————
WISH YOU ALL LUCK
$URA (3-D): a CLASSIC WYCKOFFIAN DISTRIBUTION- mark down alert!AMEX:URA - 3D
This looks like a classic Wyckoff distribution on the ETF. We've now seen a lower low close, confirming a full downtrend.
What's still missing is above-average volume, but that could appear during the next Markdown phase.
On top of that, uranium has a seasonal headwind. Over the past few years, the period from June through September has been the weakest part of the year for the sector, and that's exactly what the chart seems to be reflecting now. I've marked the previous two years with red arrows.
This is not financial advice, just my subjective observation of the chart.
👽💙
Tops and Bottoms Are Not the Same ProblemMost people trade them with one playbook. The market builds them two different ways.
A bottom is an event. A top is a process. That single difference decides how you should read every signal you have.
Bottoms happen to you
Lows are made in panic. Selling compresses into a few sessions, fear runs hot, and price snaps. The whole thing resolves in days. When sentiment hits a real extreme down there, it lands close to the actual low, often within a session or two. The signal is sharp because the move is sharp.
So you can act with conviction near a low. When price is stretched, sentiment is washed out, and the tape is flushing, that is your window. Start scaling in. The first extreme reading is the cue to begin, and you average from there. You will rarely catch the exact print, and you do not need to.
Tops happen slowly
Highs get built over weeks. Price grinds up, enthusiasm bleeds higher, and supply gets distributed into strength a little at a time. Nothing breaks on any single day. By the time a top is obvious it is already behind you.
That is why a top is hard to call. Sentiment can sit hot for a long stretch while price keeps climbing. An extreme reading up high does not mark a day. The lead time is all over the map. Sometimes the turn comes in a couple of weeks, sometimes months later, sometimes the move just stalls and goes nowhere for a while.
The most you can predict near a top is near-term pressure. Stretched conditions tell you the next stretch of time will likely under-earn. They do not tell you which day it ends.
What that means in practice
At a top, treat a hot reading as a regime flag, not a countdown. Conditions are rich, the easy upside is mostly spent, forward odds are worse. The right response is to tighten stops, trim size, and let price action confirm before you make any large change. You reduce risk in steps. You do not flip short on a feeling.
At a bottom, treat a washed-out reading as an opportunity. Near recent lows it is one of the cleaner setups the market offers. You add into it and you average through the noise.
The asymmetry, in one line: be patient and gradual at tops, decisive and committed at bottoms. Tops are slow, vague, and early. Bottoms are fast, clear, and close. Read them with the same playbook and you will sell too early at the top and freeze at the bottom.
Everyone wants a tool that calls the high. There is no such tool, because the high is a process and your tools measure pressure. Use them for what they do. They keep you honest about risk on the way up and they hand you size on the way down.
Notes from ongoing market-structure research. For study, not advice.
TSLL | June, 2026 | The time to go long has come- Timeframe: Weekly
- Trade type: Buy stop order
- Price: 14.17
- Take Profit: Open
- Stop Loss: 12.14 (-14.30 %)
Idea: Long on a breakout above last week's high - bullish momentum continuation.
Entry: Buy stop above last week’s high.
Stop-loss: Below the low of the same candle.
If the weekly candle closes below this level, the trade is invalidated.
Take Profit: Trailing stop following the lows of new weekly candles.
Get prepared to short the shit out of BTC (IBIT)
As I spoke in my earlier posts that i am short on BTC for a long upcoming time of period,
Disclaimer : I can easily be wrong in this one, I don't play "being right game" in trading it's a professional trading & we act professionally & realistically which means trading is not about predicting things up instead it's about having your plan lays out for yourself after years of practice, Testing & Correct knowledge & when your planning occurs you act professionally !!
My plan: This is 1D time frame and I'm gonna be attaching my previous post off of 1week timeframe analysis or forecast or planning And this means I'm not going to trade YET, because what I still want to see to get even more clearer perspective on BTC has not happened yet, so I'm going to be waiting on sidelines to trade this for shorts having said thar it's generally has very high likelihood that it's going to be breaking down:)
Looks like BTC is gonna break !! Upcoming planning on IBIT (BTC)
This is 1W Timeframe of IBIT (basically Bitcoin), And this what It's looking like for it's future likelihood,
Not guaranteed or anything but this is how I personally viewing BTC as per my testing & experience ( For those who don't know I have indirect experience in trading of 4 years+ direct experience of 2 years+),
Very Important : When Bitcoin is gonna tank if my planning works meanwhile other coins OR related assets to BTC is gonna be tanking more, So one should def look at those assets for instance ETH, MSTR etc....
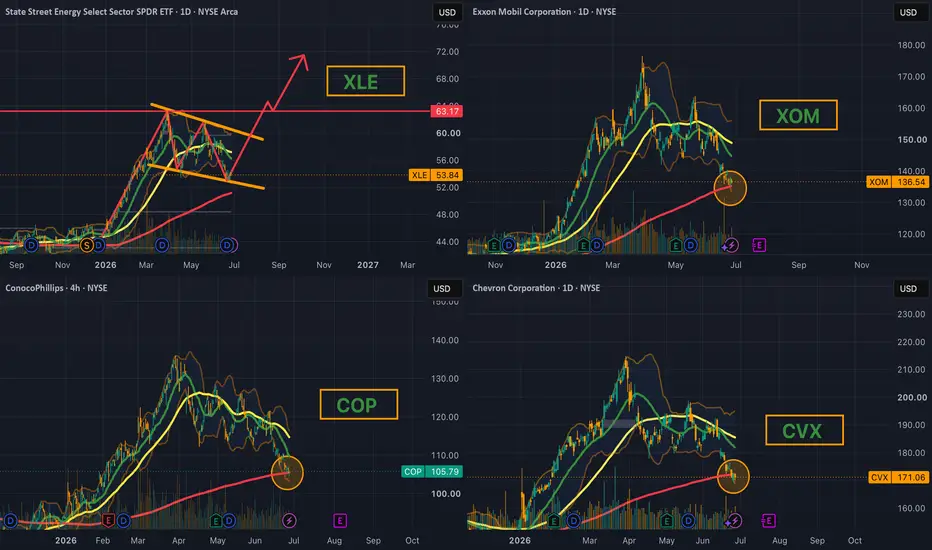
XLE Major Holdings Test 200 MA Simultaneously – High ConfluencesFour of the largest holdings in AMEX:XLE — NYSE:OXY , NYSE:XOM , NYSE:COP , and NYSE:CVX are all approaching or testing their 200-day Moving Average at the same time. This is a rare sector-wide confluence at a major long-term support level.
Key Observations:
• All four names are showing similar price action near the 200 MA.
• Volume has been relatively average on the pullback (no major capitulation yet).
• Energy sector has been strong YTD, making this a high-conviction support zone to watch.
Recommended Trades:
Bullish Setup (Bounce Play):
• Entry: On a strong daily close back above the 200 MA with increasing volume.
• Stop Loss: Below the recent swing low or the 200 MA (whichever is tighter).
• Targets:
• First target: Previous highs / 50-day MA
• Second target: Measured move from the recent decline
• Best for: NYSE:XOM and NYSE:CVX (strongest balance sheets)
Aggressive Setup:
• Scale in on dips toward the 200 MA in NYSE:COP and NYSE:OXY (they’ve pulled back the hardest).
• Use options (slightly OTM calls, 30–45 DTE) for better risk/reward if the bounce materializes.
Bearish Setup (Breakdown Play):
• If any of these names (especially NYSE:COP or NYSE:OXY ) close decisively below the 200 MA with volume, it could signal deeper sector weakness.
• In that case, consider shorting or buying puts on a retest of the 200 MA.
This is a high-conviction moment for the energy sector. The simultaneous test of long-term support across multiple major holdings is worth watching closely.
#XLE #EnergyStocks #200MA #TechnicalAnalysis #TradingSetup
IGV — How I'm Timing the Software Sector Bottom, Long PATH & NOWSoftware's lagged the rest of the tech move — and that's exactly where I like to fish. Here's how I'm using IGV to time the sector's next bottom.
What IGV is: the iShares Expanded Tech-Software Sector ETF — a basket of the major US software names (Microsoft, Oracle, Salesforce, Adobe, ServiceNow and many more). I treat it as one clean read on the whole software group: when IGV bottoms, the individual names tend to bottom with it. NOW is one of its top holdings and PATH trades right alongside this group — so this chart is basically the tide under both names I've already posted.
Why now: I'm bullish PATH and NOW (linked below) and I reckon software is the laggard of this cycle — it hasn't run with the rest of tech yet. IGV is how I time the next short-term bottom for the sector.
What I'm waiting for: look at the volume into the last two local bottoms (arrows) — heavy clusters as price carved the low. I want something similar before I call it. It doesn't have to be as big as those, but ideally heavier than the average volume since the June 1 top (the yellow downtrend on the volume pane). That pickup is the tell that buyers are stepping back in.
Levels: the two white lines (83.32 and 80.11) are my main points of interest — a bounce off either would be extra confluence. But anywhere between here and the Major Low is fine by me. What matters is that the Major Low holds. That's the line in the sand.
The read: as long as the Major Low holds, the software sector is offering great risk/reward right here. I'm positioned in PATH and NOW and watching for that volume signal to confirm the bottom's in.
Not advice — just my read and the why. Positioned in the names mentioned.
CBOE:IGV NYSE:NOW NYSE:PATH
Friday flash dump could be a clue for $SPYAMEX:SPY
Heavy selling there at the close but it looks like it was picked up. That flash dump took the prior low from earlier this month but it just missed May's low.
That could be the bottom for the month of June. If it is we will gap up and test the gap up at 744. That would be the lower high to hold this current trend. From there would be the decision point. July typically belongs to the bulls so I am leaning towards this turning into a bull flag that breaks to the high. We will have a good idea on Monday I think. If this breaks down and closes there then we could be headed for 690-700. If it gaps up then it tests the top of the flag which is also the top of the range which sits at the NFP open/high where there is a ton of liquidity. A break above that area and the market starts running again.
Nothing we can do but wait and see. Enjoy the weekend🫡
SPY - General Seer's Weekly ProjectionIf it seems to find support at the odd square of import, which means even just the one time attempted would indicate higher highs and higher lows until around the start of October.
From there, it could be a bit violent after a possible minor ending diagonal, but then violent upwards as well to offset for another V-shaped move-- similar to that of March 31st of this year.