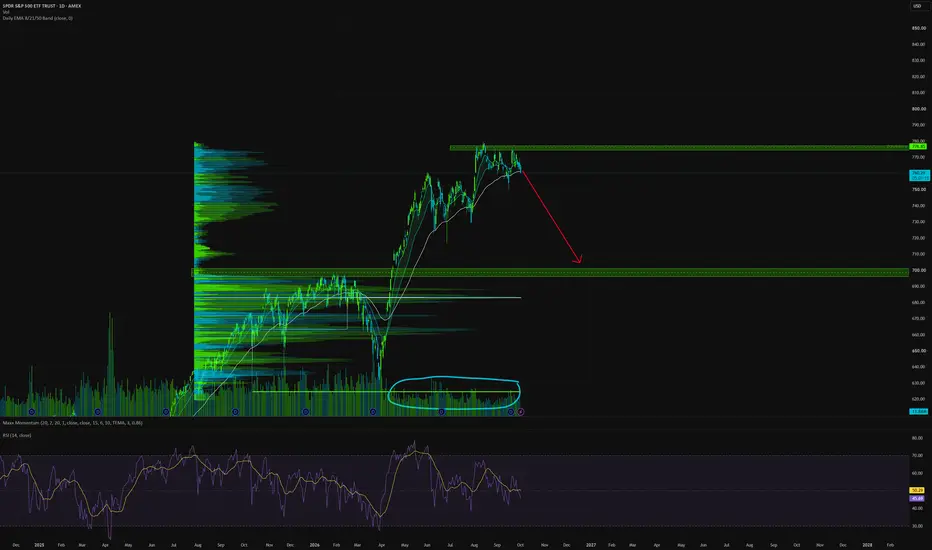
$SPY & $SPX — Levels for Friday, October 2, 2026🔮 AMEX:SPY & SPCFD:SPX — Levels for Friday, October 2, 2026
📊 Key U.S. Economic Data (ET)
8:30 AM | Average Hourly Earnings m/m | Forecast: 0.3% | Previous: 0.3%
8:30 AM | Non-Farm Employment Change | Forecast: 89K | Previous: 162K
8:30 AM | Unemployment Rate | Forecast: 4.1% | Previous: 4.1%
⚠️ For informational purposes only. Not financial advice.
📌 #SPY #SPX #Stocks #Trading #TechnicalAnalysis #NonFarmPayrolls #Employment
ETF market
Check volatility before reusing yesterday's trade planA familiar chart pattern can appear in very different market conditions. Before reusing the same stop distance and position size, check whether recent movement has changed.
On this SPY 15-minute snapshot, Realized Volatility Term Structure shows:
• 10 bars: 12.8% annualized realized volatility.
• 30 bars: 20.0%.
• 240 bars: 18.0%.
• Short/long ratio: 0.71.
The shortest window is about 29% below the longest, but the 30-bar reading is still above it. The newest bars have been calmer relative to
Before you trust a volume spike, check the clockAn opening bar and a lunchtime bar should not need the same volume to get your attention. Compare each bar with previous bars from the same time of day.
The SPY 15-minute snapshot gives a concrete example. The panel's confirmed 15:45 slot shows 654.9K shares against a 740.8K slot median: 0.88x relative volume and the 43.3rd percentile, using 60 complete sessions on the displayed feed. A large-looking absolute number can still be ordinary for that clock slot.
Time-of-Day Volume Normalizer suppl
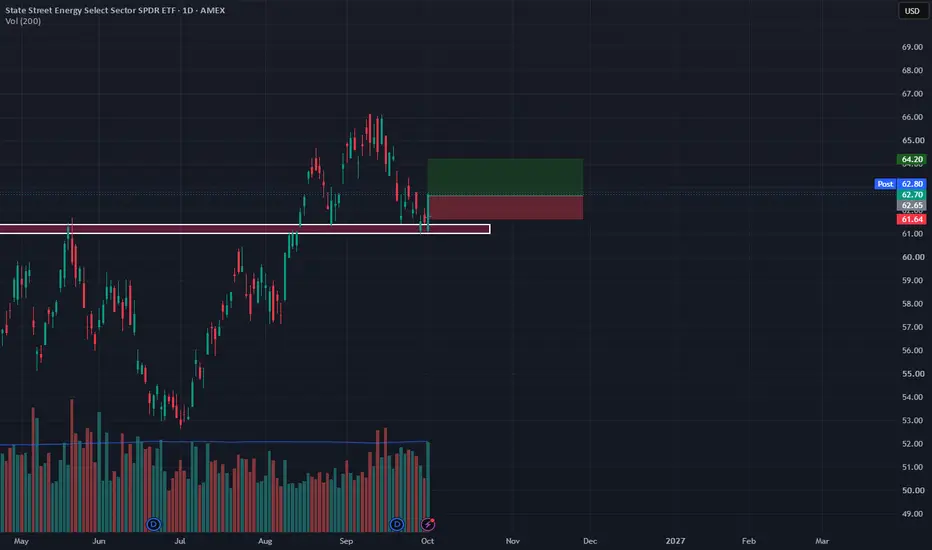
XLE LONG Long position currently active on the Daily timeframe.
The trade is based on bullish market structure and continuation of upward momentum. Position is already in the market and being managed according to the planned levels.
📊 Timeframe: 1D
🟢 Bias: Bullish
🎯 TP & 🛑 SL: Set
#XLE #Energy #Trading #TradingView #LongTrade #PriceAction #TechnicalAnalysis
ZCSH Still Bullish: Triangle Target $4,500 ZECLooking at the ZCASH ETF there's a substantial amount of supply coming in. To me this looks like deleveraging in the futures and profit taking in play, not distribution.
Another observation is the ascending triangle. It's a bullish pattern and it hasn't played out yet, so rather than entering distribution ZCASH still remains bullish.
To measure the ascending triangle target, take the measure line at the back of the triangle and apply it to the top of the triangle. On the log chart this comes o
XAR | 26' Q2 - May | Day ChartState Street SPDR S&P Aerospace & Defense ETF
Dividend yield (indicated)
0.32%
--------------------------
Multiple Time-Frame Analysis; Color Code | Strength favors the higher timeframe.
Yearly timeframe = black
Monthly timeframe = pink
weekly = grey
daily = red
4hr = orange
1hr = yellow
15min = blue
5min = green if they are shown. (Level visibility on intervals is set to timeframe the level was found on and below to keep chart view organized.)
** T.A explained **
A Range = two or more cons
ahhhh ! - dollar strong,ahhhh ! - dollar strong, USA Exporting more and more- the dollar is solid... the USA markets are the most liquid in the world - what is there to think about it? ?????? and the USA has a rrr of 10 , while china is massively levered with a rrr of barely 7.5 - I don't see the hesitation that your post implies.....
The USA - massive commodity reserves
The USA - Energy Exporter - now the largest in the world
The USA - massive agro production feeding the world
The USA - Zero beurocracy comared to
TLT Downside Targets & Implied 10Y Yield Read-ThroughsTLT Downside Targets & Implied 10Y Yield Read-Throughs
TLT Target 1: 63.5 | Implied 10Y Yield: 5.60% – 6.10%
TLT Target 2: 55.5 | Implied 10Y Yield: 6.30% – 7.00%
Macro Takeaways
Duration Math: A move to TLT 63.5 (~26% drawdown) requires a +160–190 bps surge in long-end yields. Assuming a 0.75–0.90 10Y/30Y beta, the US 10-year yield lands at 5.60%–6.10%.
Extreme Downside Scenario: A drop to TLT 55.5 (~35% drawdown) implies a +230–280 bps move at the long end, pushing the 10-year yield into t
TLT: the yearly target at 77.89 gave way on a closeTLT has been below its yearly pivot at 87.40 since July, so the yearly bias is down. On September 29 it reached the yearly target at 77.89, the level where a short-side process takes profits, and on September 30 it closed below it. A daily close beyond a target opens the next level: the October monthly target at 75.07, then the second yearly target at 72.49. For anyone still short, 77.89 is now the line to hold: a daily close back above it would say the move is pausing. Options currently price T
Research 01.10.2026🌏 Markets:
AMEX:SPY +3.08 +0.40%(pre/m)
NASDAQ:QQQ +4.32 +0.58%(pre/m)
🆕 Economic News:
Nasdaq futures rise on Micron's AI-driven outlook while Dow futures hit a three-month low as the 10-year Treasury yield tops 5.3%, its highest since 2002
08:30 USA – Initial Jobless Claims
09:05 USA – Fed Barkin, Collins and Schmid Speeches
10:00 USA – ISM Manufacturing PMI
10:00 USA – Construction Spending
10:30 USA – EIA Natural Gas Stocks Change
15:30 USA – Fed Williams Speech
18:45 U
SPY Is Back On The 765.52 Line Premarket.SPY Is Back On The 765.52 Line Premarket.
SPY is trading 765.51 premarket, back on the 765.52 line after Wednesday's session closed at 762.63, having dipped to 762.18 intraday without closing below 762.36. A premarket print is not a close, so nothing has been reclaimed yet. Both the hourly and 4H dashboards show no active thesis and neutral readings, and the 4H's last conviction print was to the downside. ISM manufacturing lands at 10:00 ET, and the reaction to it sets the read, not the premark
ARKK: Big Cup Above 50 SMA at Resistance💡 Swing setup idea
50 SMA Strategy
🔎 Analysis summary:
The innovation ETF has reached resistance. We can also see a closing of a big cup above the 50-day moving average. This alignment of trend, pattern and level makes the breakout area key to watch. The upside potential is projected by the depth of the cup from the breakout point.
👀 Levels to watch:
Entry trigger: Break above $92.65
Target: $121.70
Stop: Under the resistance
💬 Will ARKK break through resistance and continue higher? Le
Tips for Setting Up a Dedicated Short-Selling Strategy (Part 2)As mentioned in the previous article, one method to find short-selling signals is to refer to Market Depth and Order Flow.
First, Market Depth refers to the changes in order price and volume for Bid 1–5 (buy orders) and Ask 1–5 (sell orders).
Ask 1 – Ask 5 (Ask 1 to Ask 5): Represents the five lowest prices in the market where sellers are waiting for orders to be executed, arranged from lowest to highest. Ask 1 is currently the cheapest selling price.
Bid 1 – Bid 5 (Buy 1 to Buy 5): Represent
Optimistic October?October has reasons to be optimistic. Whether that optimism can survive another round of inflation data, elevated Treasury yields, and a demanding earnings season is the question. My highest-weighted scenario remains Yellow: an early recovery that encounters renewed pressure, followed by an opportunity to rebuild before the month ends. A positive October close is possible, but the path there could be uncomfortable.
September reinforced why I map several outcomes. The market can reach an anticip
$SPY & $SPX — Levels for Thursday, October 1, 2026🔮 AMEX:SPY & SPCFD:SPX — Levels for Thursday, October 1, 2026
📊 Key U.S. Economic Data (ET)
8:30 AM | Unemployment Claims | Forecast: 201K | Previous: 197K
10:00 AM | ISM Manufacturing PMI | Forecast: 54.8 | Previous: 54.6
10:00 AM | Fed Speaker: FOMC Member Waller Speaks
⚠️ For informational purposes only. Not financial advice.
📌 #SPY #SPX #StockMarket #Trading #TechnicalAnalysis