Short
Short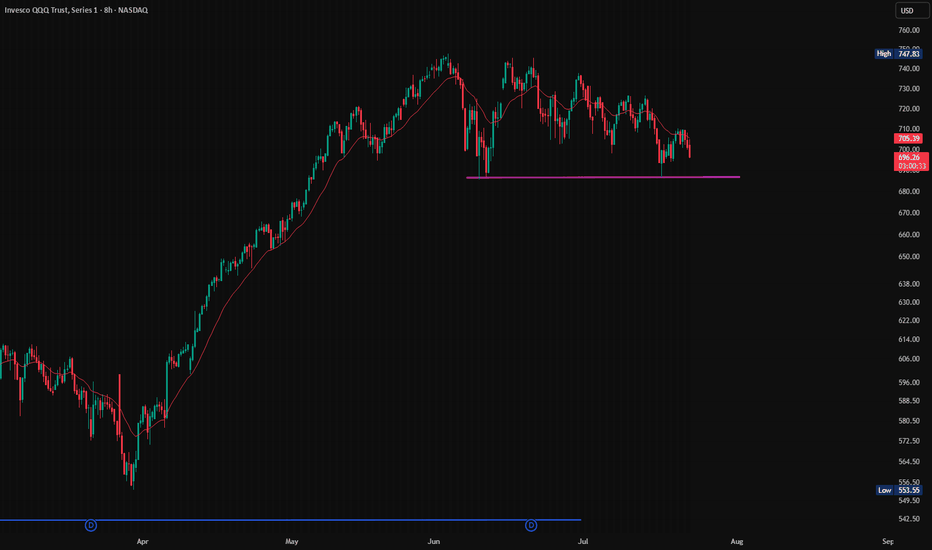
Short on XLF🚨 BANKS AT A KILLER ATH: Opening a Short on XLF Before the Middle East Sets Markets on Fire! 🚨
The US financial sector is experiencing absolute euphoria, breaking one all-time high after another. While retail traders are recklessly buying the tops, assuming banks will grow to the sky, we see an extremely stretched rubber band that is threatening to snap. Combined with the escalating tensions in the Middle East, a perfect storm is forming. We are not waiting for a washout—we are meeting it head-on with a surgically precise short.
📉 Overheated Market Hits a Geopolitical Wall
The XLF (Financial Select Sector SPDR Fund), which bundles banking giants, has had a textbook run. Over the past three months, it has surged by a massive +8.7%, breaking out to a new all-time high (ATH) in the $56–$56.9 range. By doing so, it has essentially hit the absolute ceiling of its 52-week range. Technically, the chart is extremely overextended and ripe for a correction.
But the main story is unfolding off the charts. The Middle East is in flames, and geopolitical risk is rising rapidly. Why are we shorting banks specifically? By its very nature, the financial sector is the most sensitive to macroeconomic shocks, interest rates, and global stability. The moment fear (risk-off sentiment) takes over the market, banking stocks will take the hit first, as big capital will immediately start fleeing to safety.
🎯 Our Trading Scenario and Key Levels
We are capitalizing on a clear price rejection at the ATH and opening a directional short position. The goal is clear—to ride the panic and technical profit-taking.
Action: Short XLF ETF
Trigger: Rejection from the ATH zone + Middle East escalation
Key Support to Watch: $55.00
Target Profit (TP): $54.00
💡 Impact on Investors and What to Expect Next:
In the coming hours and days, the market's reaction at the $55 level will be absolutely crucial. This is the first anchor point (support). If the market fails to hold it under the pressure of Middle East news, it will trigger an avalanche of stop-losses and profit-taking, which will carry us very quickly and smoothly right to our $54 target.
Don't try to catch a falling knife, and don't bet on endless growth when the rules of the game are changing. Managing risk to the downside is much more profitable right now. The position is loaded; we are monitoring the price action!  Short
Short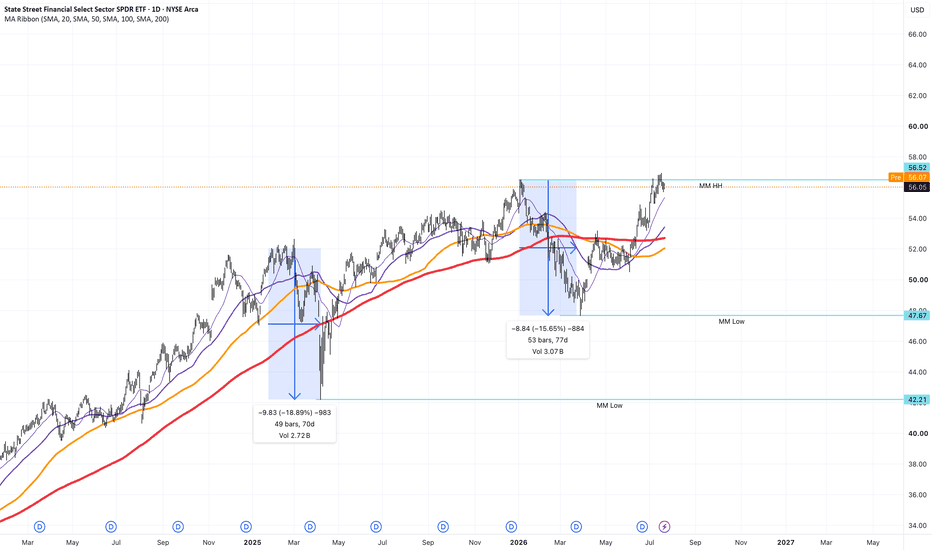
 Short
Short

Long 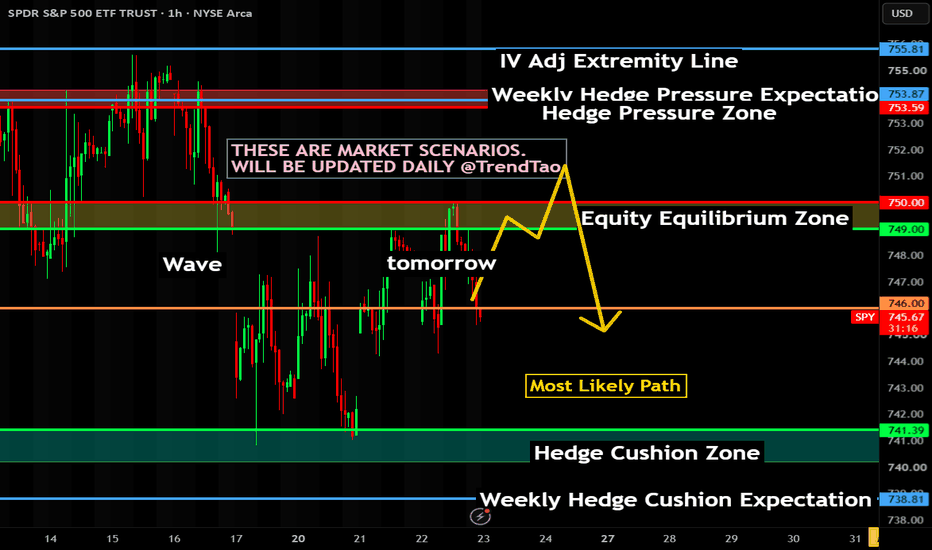
 Long
Long
Breakdown Risk in Consumer Discretionary ETF?The SPDR Select Sector Consumer Discretionary ETF has been rangebound as the broader market rallied, and some traders may see risk of a breakdown.
The first pattern on today’s chart is the apparent rounded top between September and May. The lack of breakout in price contrasts with the broader S&P 500 and Nasdaq-100. Does that demonstrate a lack of relative strength?
Second, January’s peak was only slightly above the December 2024 high. The result could be viewed as a false breakout.
Third, the 50- and 200-day simple moving averages are essentially on top of each other. That may reflect uncertainty about the longer-term trend, with potential to resolve in a bearish manner.
Finally, traders could eye the March low of $105.19 as initial support.
Standardized Performances for the ETF mentioned above:
SPDR Select Sector Consumer Discretionary ETF (XLY)
1-year: +7.92%
5-years: +31.36%
10-year: +200.49%
(As of June 30, 2026)
Exchange Traded Funds ("ETFs") are subject to management fees and other expenses. Before making investment decisions, investors should carefully read information found in the prospectus or summary prospectus, if available, including investment objectives, risks, charges, and expenses. Click here to find the prospectus.
TradeStation has, for decades, advanced the trading industry, providing access to stocks, options and futures. If you're born to trade, we could be for you. Learn more here about TradingView’s Broker of the Year!
Past performance, whether actual or indicated by historical tests of strategies, is no guarantee of future performance or success. There is a possibility that you may sustain a loss equal to or greater than your entire investment regardless of which asset class you trade (equities, options or futures); therefore, you should not invest or risk money that you cannot afford to lose. Online trading is not suitable for all investors. View the document titled Characteristics and Risks of Standardized Options at www.TradeStation.com . Before trading any asset class, customers must read the relevant risk disclosure statements on www.TradeStation.com . System access and trade placement and execution may be delayed or fail due to market volatility and volume, quote delays, system and software errors, Internet traffic, outages and other factors.
Securities and futures trading is offered to self-directed customers by TradeStation Securities, Inc., a broker-dealer registered with the Securities and Exchange Commission and a futures commission merchant licensed with the Commodity Futures Trading Commission). TradeStation Securities is a member of the Financial Industry Regulatory Authority, the National Futures Association, and a number of exchanges.
TradeStation Securities, Inc. and TradeStation Technologies, Inc. are each wholly owned subsidiaries of TradeStation Group, Inc., both operating, and providing products and services, under the TradeStation brand and trademark. When applying for, or purchasing, accounts, subscriptions, products and services, it is important that you know which company you will be dealing with. Visit www.TradeStation.com for further important information explaining what this means.  Long
Long
Week 30 of 52 | Daily Market Brief #1Is AMEX:SPY SPY Ready to Break Higher?
The U.S. market enters today's session with investors focused on one question: can AI earnings justify current valuations?
After yesterday's strong semiconductor rebound, futures are slightly lower as traders wait for a series of major earnings reports led by Alphabet, Tesla, ServiceNow and Texas Instruments after the closing bell. Today's session is likely to be driven more by positioning than by economic data.
Market Drivers
• S&P 500 futures are modestly lower after Tuesday's rally.
• The 10-Year Treasury Yield remains near 4.6%, keeping pressure on high-valuation growth stocks.
• Brent crude continues trading near recent highs as Middle East tensions remain elevated.
• The VIX remains above recent lows, suggesting investors are still pricing in event risk ahead of Big Tech earnings.
What Matters Today
Today's most important catalyst is Alphabet's earnings report.
Markets want answers to three questions:
Is AI investment translating into profitable growth?
Will Google Cloud continue accelerating?
Does management maintain aggressive capital spending?
The answers will likely influence not only GOOG, but also Nvidia, Micron, Super Micro Computer and the broader AI infrastructure sector.
Sector Outlook
Potential Leaders
• Artificial Intelligence Infrastructure
• Semiconductor Equipment
• Energy
• Defense
Potential Laggards
• High-multiple Software
• Consumer Discretionary
• Airlines
Stocks to Watch
ASTS
Momentum remains constructive after yesterday's strong rebound. Holding above recent support keeps the short-term bullish structure intact.
MSTR
Bitcoin continues to dictate direction. As long as BTC remains firm, MicroStrategy should stay relatively supported.
GOOG
Today's most important stock. Earnings after the close could determine sentiment for the entire AI sector.
AAPL
Trading near resistance while investors rotate toward AI names. Rising bond yields remain a valuation headwind.
NVDA
Still one of the market leaders. Alphabet's capex guidance could become the next major catalyst.
SMCI
One of today's strongest names after announcing over $60B in new orders together with significantly improved margin expectations.
MU
Memory stocks continue leading the semiconductor recovery, but today's move will largely depend on whether AI spending expectations remain intact.
NOW
ServiceNow also reports after today's close. Investors will closely monitor enterprise AI demand and forward guidance.
Technical Picture
SPY remains inside a well-defined rising channel.
Price is currently consolidating just beneath resistance after an impressive recovery from the April lows.
Bullish Scenario
A daily close above resistance would confirm continuation toward the upper portion of the channel.
Bearish Scenario
Failure to hold the current support zone could trigger a healthy pullback toward the middle of the channel, where buyers may become active again.
At the moment, the primary trend remains bullish, but price is no longer trading at an attractive chase level.
Three Things to Watch Today
Alphabet's earnings and AI spending outlook after the close.
The 10-Year Treasury Yield. A move higher could pressure technology valuations.
SPY's resistance zone. A confirmed breakout would strengthen the bullish trend, while another rejection could extend the current consolidation.
Disclaimer: This analysis is for educational purposes only and reflects my personal opinion based on current market conditions. It is not financial advice or a recommendation to buy or sell any asset. Always do your own research and invest according to your own risk tolerance. Long 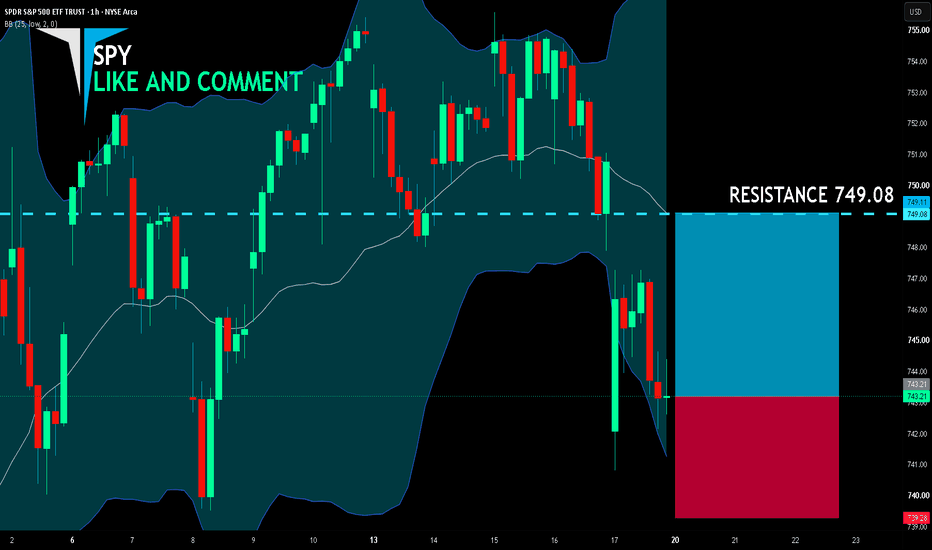
 Long
Long
 Long
Long
Long 

Long 
Education 
QQQ | Q3 2026 | Day ChartInvesco QQQ Trust, Series 1 ||
MARKET-BEATING SCORE = 8/10
Dividend yield (indicated)
0.43%
-----------------------------------
PEGY 0.90 — fairly valued.
EPS growth 36.0% — above-market.
Revenue growing 11.5% YoY — steady.
Gross margin 62.5% — strong moat.
FCF margin 28.4% — real cash generation.
D/E 0.45 — conservative leverage.
-----------------------------------
•
The fund is heavily concentrated in the 'Magnificent Seven' tech stocks, making it the primary vehicle for investors seeking exposure to AI and digital innovation.
•
QQQ has historically outperformed the S&P 500 over long horizons, notably turning a $10,000 investment at inception into over $125,000 by 2025.
•
The trust maintains a low expense ratio of 0.20%, making it a highly cost-effective way to gain exposure to large-cap growth stocks.
-----------------------------------
Multiple Time-Frame Analysis; Color Code | Strength favors the higher timeframe.
Yearly timeframe = black
Monthly timeframe = pink
weekly = grey
daily = red
4hr = orange
1hr = yellow
15min = blue
5min = green if they are shown. (Level visibility on intervals is set to timeframe the level was found on and below to keep chart view organized.)
** Candle Science explained **
A Range = two or more consecutive color candles.
There are two types of ranges - accumulation and distribution. **A single candle is a range on a lower timeframe. *Find the range and define its, creation dates, prices, and risk parameters. A range is broken down into 4 candle, which create 6 levels that define the range and illustrate market structure.
Focus only on the first and last candle of each range. The last candle of each type of range has two levels - see FS & Inv. FS Candles below.
DISTRIBUTION RANGES DEFINED:
When price is above a distribution range, these candles/levels act as support.
(BS) BACKSIDE Candle - First distribution candle in a distribution range. Expectation = strong reaction to price. long wicks reaching to or away from level. high angle accumulation trends, f.v,g's
(FS) FrontSide Candle - Last distribution candle in a distribution range. Expectation = reversal, create a low angle accumulation trend. The top of Distribution candles are used as support. The bottom of the FrontSide candle is the SwingLow of the range. The FS candle wants to protect the SwingLow. When/if Price Action closes below the SwingLow, the level is invalidated. Find another range to trade.
ACCUMULATION RANGES DEFINED: When price is below an accumulation range, these candles/levels act as resistance.
INVERSE BACKSIDE (Inv.BS) - First Accumulation candle in an accumulation range. Expectation. = strong reaction to price. long wicks reaching to or away from level. Creates high angle distribution trends, f.v.g, protects the Inv.FS candle
INVERSE FRONTSIDE (Inv.FS) - Last accumulation candle in an accumulation range. Expectation = reversal, create a low angle distribution trend. The bottom of Accumulation candles are used as resistance.
The top of the Inv.FrontSide candle is the SwingHigh of the range. The Inv.FS candle wants to protect the SwingHigh. When/if Price Action closes above the SwingHigh, the level is invalidated. Find another range to trade.
Long 
Long