SOXL ▼ SHORT · AMD pop faded 72 / 74 / 77 → 61▸ WHY: semis ran into AMD and the election - SOXL +7.3% yesterday (73.1 close). AMD beat, but it already gave back the whole +5% move premarket. Democrats took both chambers and data center limits passed on state ballots (at least 14 Ohio towns, 10 outright bans). Short term that's a headwind for the AI hardware trade, and SOXL is 3x that trade.
▸ LEVELS: 77 above the premarket high zone · 73.1 pre-election close · 67.5 Nov 2 low · 63.6 April 8 low · 61 target zone
▸ PLAN: Tier 1 short in prem
ETF market
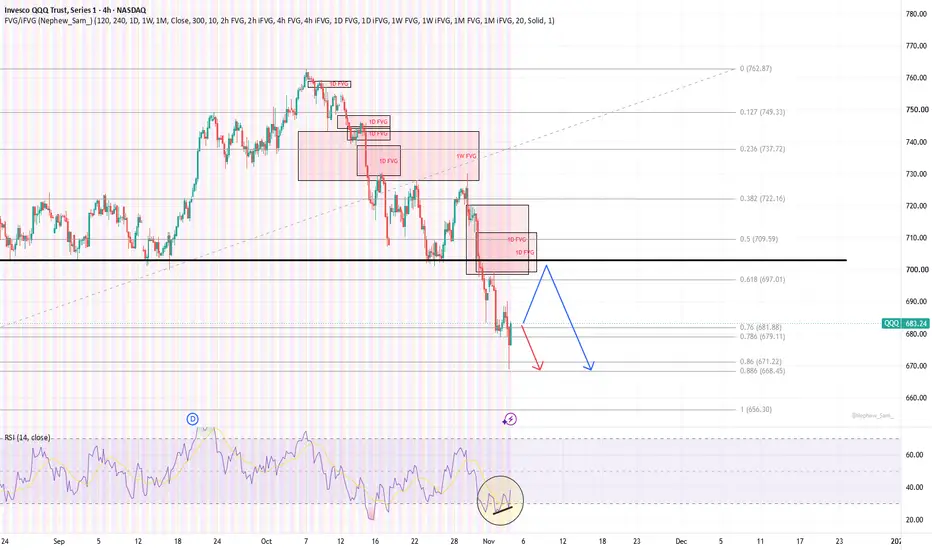
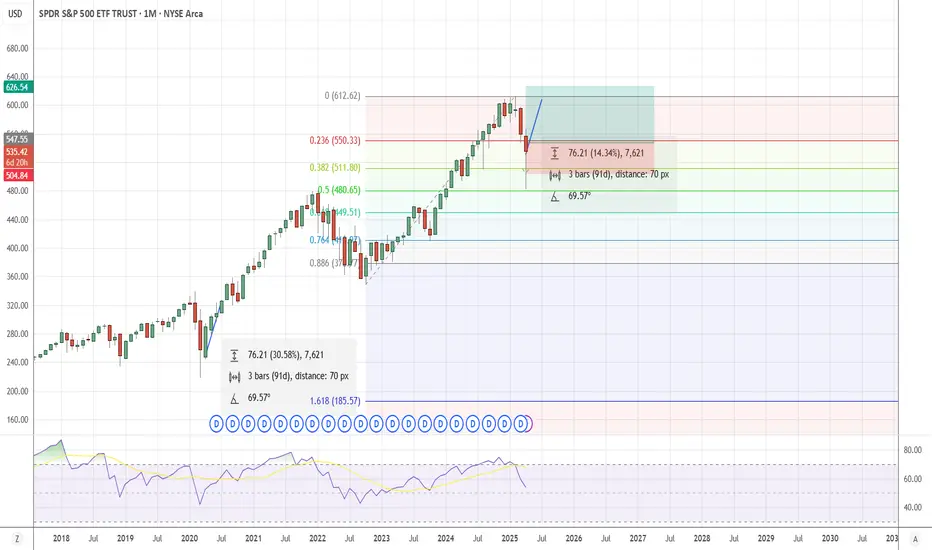
$QQQ $SPY - HERE IS WHY IS THINK THE STRONG BOUNCE IS A TRAPNASDAQ:QQQ AMEX:SPY - Bull Trap?
This strong bounce looks bullish on the surface, but the bigger picture tells a different story.
I believe this rally is setting bulls up for another disappointment. Here’s why I’m still watching for the next move lower.
#SP500 #Nasdaq #StockMarket #Trading
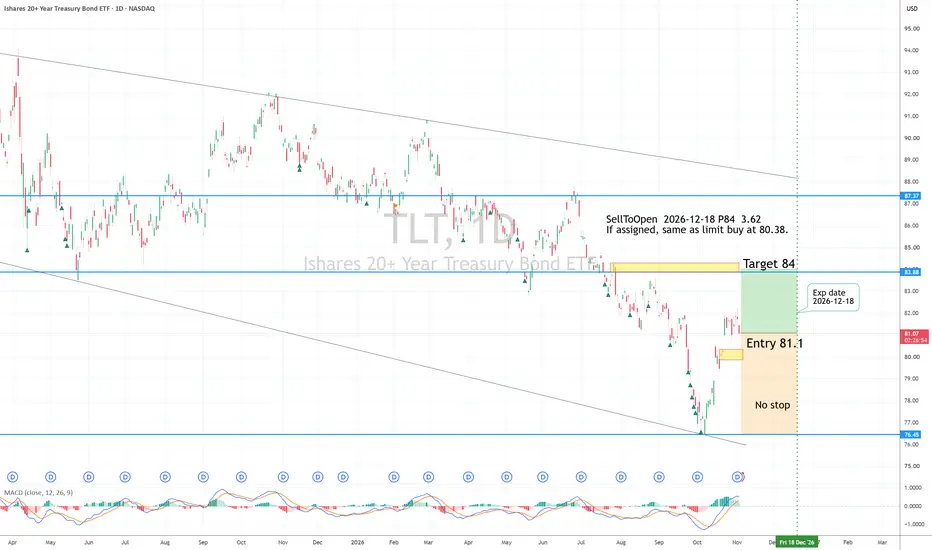
TLT Long Long term investment, own bonds near 25-year lows.
Entry 81.1
no Stop
Target 84
Risk management is much more important than a good entry point.
I am not a PRO trader. Recently, about 50% of my trades had been stopped quickly.
SellToOpen 2026-12-18 P84, 3.62 (Delta= -0.67)
Allow assignment to accumulate Conservative long term investment.
if P84 could be assigned, same as limit buy at 80.38.
No stop, buy and hold.
$SPY & $SPX — Levels for Wednesday, November 4, 2026🔮 AMEX:SPY & SP:SPX — Levels for Wednesday, November 4, 2026
📊 Key U.S. Economic Data (ET)
10:00 AM | ISM Services PMI | Forecast: 54.8 | Previous: 54.9
⚠️ For informational purposes only. Not financial advice.
📌 #SPY #SPX #ISM #ServicesPMI #StockMarket
Biotech Bubble?🧬 Biotech Bubble? 🫧
Is the biotech sector putting in a generational top?
The long-term 3W chart of AMEX:XBI suggests that possibility, and I've taken a long position in AMEX:LABD to capitalize on a potential downturn.
There's more to this trade than a bearish chart pattern. Between AMEX:LABD 's extraordinary volume, elevated short interest, and a developing reversal formation, the setup is becoming increasingly compelling.
1. AMEX:XBI — A Generational Double Top?
The headline cha
$SPY & $SPX — Levels for Tuesday, November 3, 2026🔮 AMEX:SPY & SP:SPX — Levels for Tuesday, November 3, 2026
📊 Key U.S. Economic Data (ET)
10:00 AM | JOLTS Job Openings | Forecast: 7.15M | Previous: 7.08M
All Day | Congressional Elections
⚠️ For informational purposes only. Not financial advice.
📌 #JOLTS #Employment #Elections #SPY #SPX
Two pays on Nov 2: QQQ TREND, AVGO BounceThe morning board called it chop: Friday's flush, a pre-market bounce that had already faded, and every overnight cross spent. The plan was narrow — fresh dip, fresh cross, no chasing. Two entries fit it. Four names were stood aside on the rules, and one of those passes became the day's best lesson.
QQQ — TREND, traded (+100%)
The print came at the morning flush low, 694.05 (day low 693.93), with the cross confirming out of the cool-down. The Nov02 697c paid +100% as QQQ ran into the 699–700 su
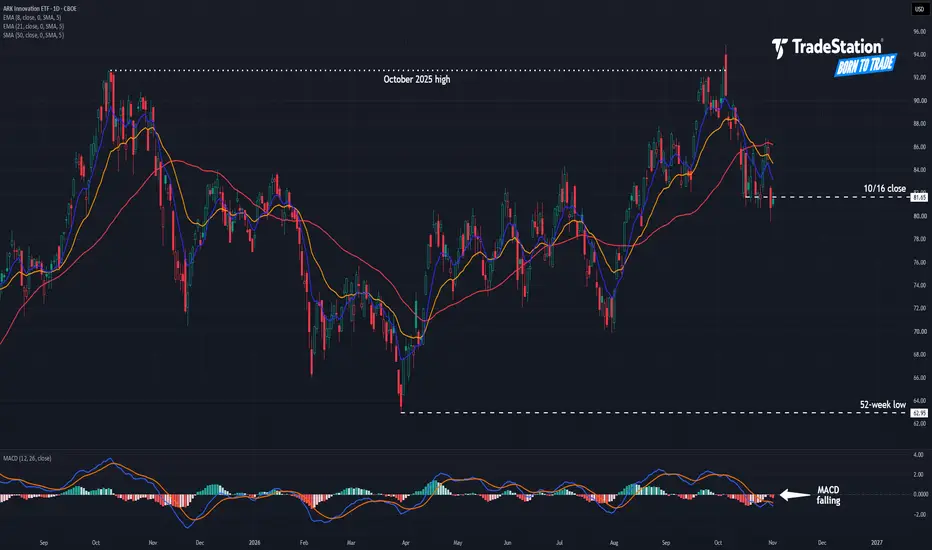
ARK Innovation: Is Support Breaking?The ARK Innovation ETF rallied sharply in August and September, but now it could be going the other way.
The first pattern on today’s chart is the October 2025 high of $92.65. The fund tried unsuccessfully to cross that level early last month. It quickly dropped from the high, potentially confirming a bearish reversal.
Second, ARKK had a weekly close at $81.65 on October 16. It probed below that level several times in the following sessions while managing to close above. However, it decisively
QQQ rip to 720 or bull trap under 703?QQQ ripped from the 670 flush back to 694 in a day. Now the question is whether 703 caps it.
📊 The read
The hourly model path, drawn from yesterday's close near 680, leans long: a steady grind toward about 720 by early Nov 5, staying between roughly +0.7% and +6% along the way. Price is riding the lower side of that path right now.
🧭 Why it matters
The band around the path is wide, about 3.7% per step, so its lower edge sits back in the mid 660s. That's the honest message: the lean is up, but th
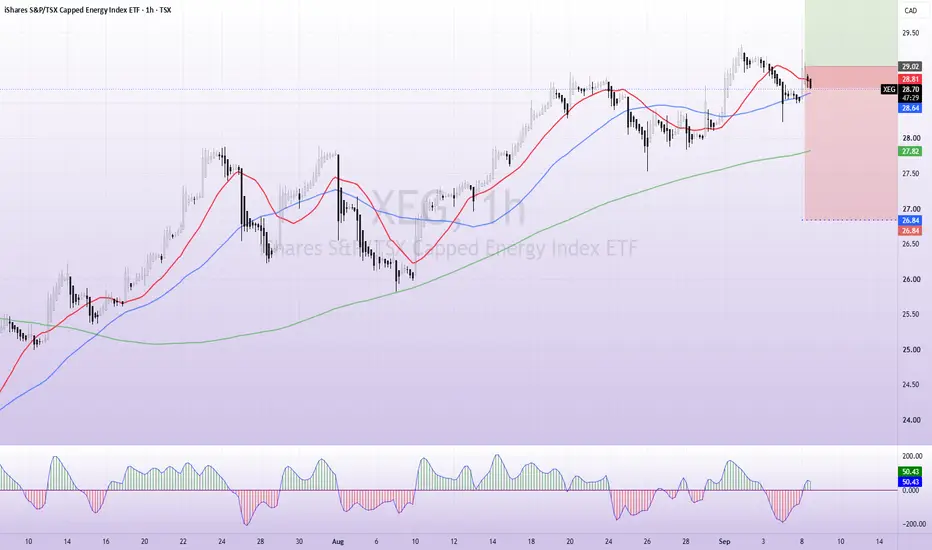
XEG Long EntryValid 1h trend entry.
Price above rising 1h 200 MA
20 MA above 50 MA
Pullback to the 20/50 MA area
CCI recrossed red → green
Entry taken on candle close
Strategy signal confirmed. Position entered.
SL Management
Initial SL: below most recent 1h swing low.
Once trend is mature: trail using the Daily 50 MA.
If a black daily candle appears: pause SL movement.
If price closes below the Daily 50: exit.
Now let the trade work.
Research 04.11.2026🌏 Markets:
AMEX:SPY +6.73 +0.89%(pre/m)
NASDAQ:QQQ +1.48 +0.22%(pre/m)
🆕 Economic News:
Wall St futures rise as Democrats win both chambers of Congress: banks, healthcare, miners and renewables rally while AI, data-center and chip names fall
08:15 USA – ADP Employment Change
08:30 USA – Balance of Trade
08:30 USA – Treasury Refunding Announcement
10:00 USA – ISM Services PMI
10:30 USA – EIA Crude Oil Inventories
Earnings after the close: NASDAQ:QCOM , NASDAQ:ARM , NASDAQ:
SPY: My sell-off plan, written before the drop. Every levelSPY closed Tuesday at 754.35, about 3.2% below its Oct 6 closing high (779.09). Not a crash. But this is exactly when I want my plan written down, before a bad Friday makes the decision for me.
Here is every level I'm watching on SPY, with my two free tools, and what each one does.
Where things stand (Tuesday close)
- Trend Safety Switch: the trend flipped down on Oct 30 at 755.72, so it cut to 30%. It goes back to 100% on a close above about 779.
- Risk-Off Ladder, 1 of 3 warnings on:
1. VI
SPYI vs. QQQI: Income, Exposure & RiskIncome-oriented ETFs can pursue similar distribution objectives while maintaining meaningfully different market exposures and risk characteristics.
Two examples are the NEOS S&P 500 High Income ETF (SPYI) and the NEOS Nasdaq-100 High Income ETF (QQQI).
Both seek to generate monthly cash distributions through equity investments combined with options-based strategies.
However, similar income objectives do not mean the funds will experience identical investment outcomes.
Our comparison chart il
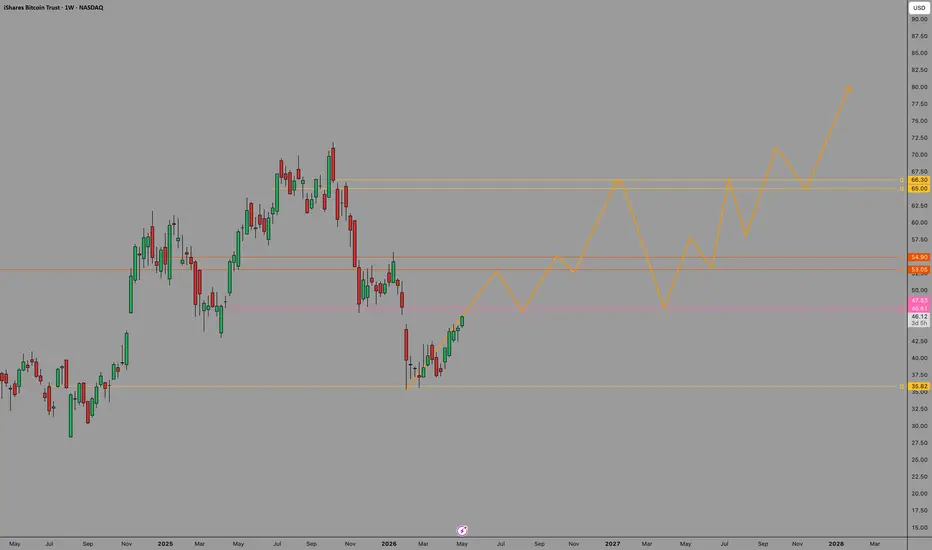
BIT Weekly — Make or BreakNASDAQ:IBIT — Weekly
One level matters right now: $47.
That's the flip zone. Resistance needs to become support before this moves anywhere meaningful.
If it holds:
→ Rally into year-end
→ Flush in 2027 (shakeout, not the end)
→ New ATH by 2028
Invalidation: lose $35.82 on the weekly and the thesis is dead.
Not financial advice. Just watching the map.