ETF market
Two pays on Nov 2: QQQ TREND, AVGO BounceThe morning board called it chop: Friday's flush, a pre-market bounce that had already faded, and every overnight cross spent. The plan was narrow — fresh dip, fresh cross, no chasing. Two entries fit it. Four names were stood aside on the rules, and one of those passes became the day's best lesson.
QQQ — TREND, traded (+100%)
The print came at the morning flush low, 694.05 (day low 693.93), with the cross confirming out of the cool-down. The Nov02 697c paid +100% as QQQ ran into the 699–700 su
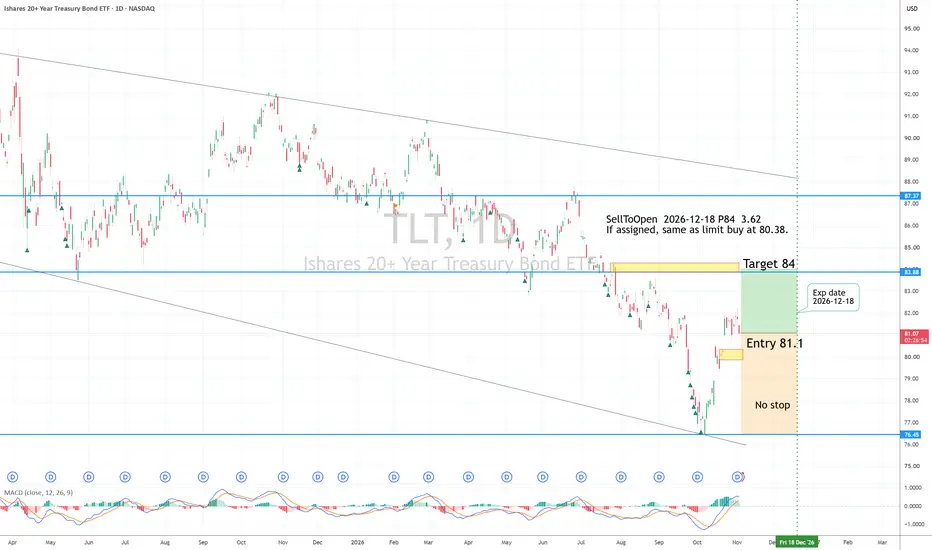
TLT Long Long term investment, own bonds near 25-year lows.
Entry 81.1
no Stop
Target 84
Risk management is much more important than a good entry point.
I am not a PRO trader. Recently, about 50% of my trades had been stopped quickly.
SellToOpen 2026-12-18 P84, 3.62 (Delta= -0.67)
Allow assignment to accumulate Conservative long term investment.
if P84 could be assigned, same as limit buy at 80.38.
No stop, buy and hold.
$SPY & $SPX — Levels for Tuesday, November 3, 2026🔮 AMEX:SPY & SP:SPX — Levels for Tuesday, November 3, 2026
📊 Key U.S. Economic Data (ET)
10:00 AM | JOLTS Job Openings | Forecast: 7.15M | Previous: 7.08M
All Day | Congressional Elections
⚠️ For informational purposes only. Not financial advice.
📌 #JOLTS #Employment #Elections #SPY #SPX
SOXL ▼ SHORT · Fade the bounce 81.5 / 84 → 76▸ WHY: semis got flushed Friday - SOXL -25%, INTC had its worst day in 40+ years, big tech dragged everything. this morning's pop is a bounce with no news behind it. I'd rather sell it than buy it
▸ LEVELS: 84 Friday high · 77.05 Friday close · 70.2 Friday low
▸ PLAN A: starting short around 81.5 premarket, adding 84 if it squeezes into Friday's high
▸ PLAN B: if it rolls over under VWAP after the open, 77 comes first
🎯 TARGET 76 ✕ STOP 87
⚠ RISKS: ISM at 10:00. 3x ETF - moves fast both way
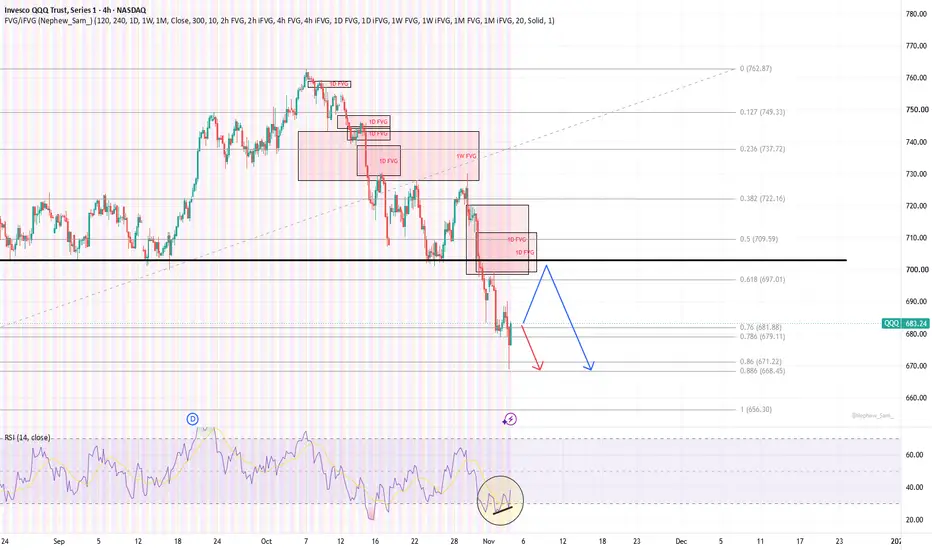
QQQ Lost 700. Week Ahead: 680 or Reclaim?What happened
Big tech earnings week and the market didn't like it. QQQ lost 700 on Friday, flushed to 683.45 and closed 690.79. SPY held 750 and closed 755.82. Semis got hit hardest after Intel cut its guide. Oil added about 15% in October on Iran war fears - WTI is back near $100 this morning as talks with Qatar's mediators continue. Bounces into resistance got sold all week, breakouts kept failing.
Levels that matter
QQQ: 700-704 was support, now it's resistance. Below - 680-683, the late Ju
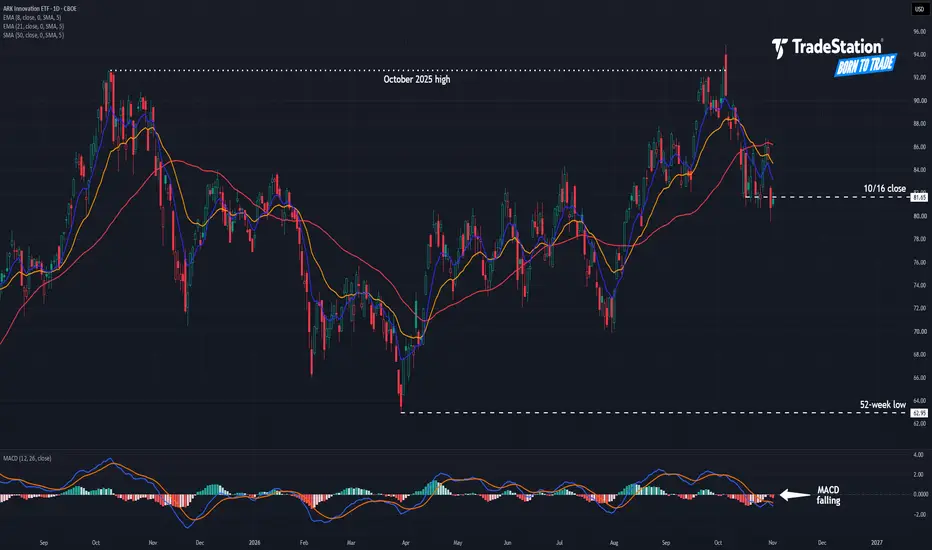
ARK Innovation: Is Support Breaking?The ARK Innovation ETF rallied sharply in August and September, but now it could be going the other way.
The first pattern on today’s chart is the October 2025 high of $92.65. The fund tried unsuccessfully to cross that level early last month. It quickly dropped from the high, potentially confirming a bearish reversal.
Second, ARKK had a weekly close at $81.65 on October 16. It probed below that level several times in the following sessions while managing to close above. However, it decisively
QQQ ▼ SHORT · Lost 700 · 697 / 700 / 703 → 690 / 685 / 680▸ WHY: AMZN missed and is burning cash on capex, INTC guided Q4 way under the street and says the PC slump runs into 2027. chips got dumped in Asia overnight and QQQ is gapping -2.4% under 700. on the daily 700 held 4 times since July - now it's gone, and that floor should act as a ceiling
▸ LEVELS: 715.34 yesterday's close · 700 heavy puts / daily floor (lost) · 686.76 Jul 17 low · 661.14 Jul 29 low
▸ PLAN: I'm scaling in, not going all in at once
- tier 1: short here, ~697 premarket
- tier 2
$SPY & $SPX — Levels for Wednesday, November 4, 2026🔮 AMEX:SPY & SP:SPX — Levels for Wednesday, November 4, 2026
📊 Key U.S. Economic Data (ET)
10:00 AM | ISM Services PMI | Forecast: 54.8 | Previous: 54.9
⚠️ For informational purposes only. Not financial advice.
📌 #SPY #SPX #ISM #ServicesPMI #StockMarket
SPYI vs. QQQI: Income, Exposure & RiskIncome-oriented ETFs can pursue similar distribution objectives while maintaining meaningfully different market exposures and risk characteristics.
Two examples are the NEOS S&P 500 High Income ETF (SPYI) and the NEOS Nasdaq-100 High Income ETF (QQQI).
Both seek to generate monthly cash distributions through equity investments combined with options-based strategies.
However, similar income objectives do not mean the funds will experience identical investment outcomes.
Our comparison chart il
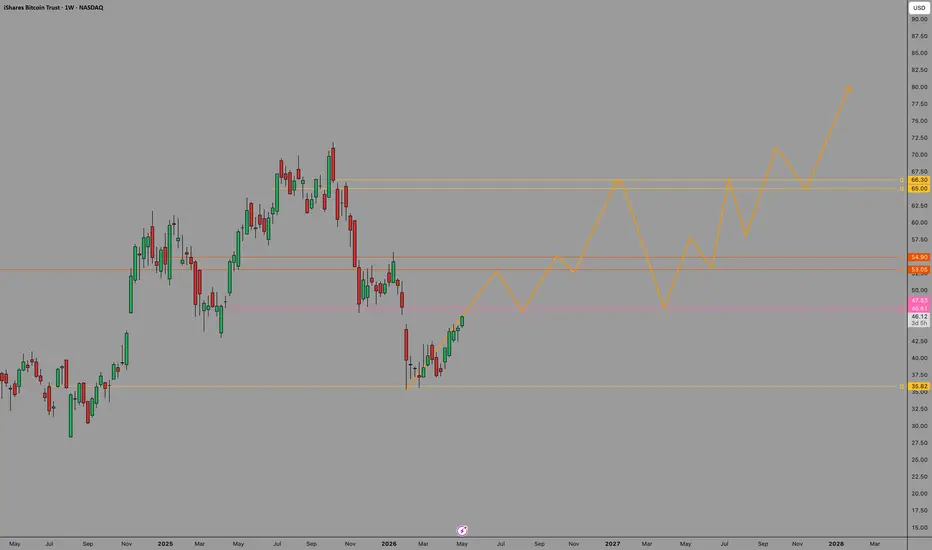
BIT Weekly — Make or BreakNASDAQ:IBIT — Weekly
One level matters right now: $47.
That's the flip zone. Resistance needs to become support before this moves anywhere meaningful.
If it holds:
→ Rally into year-end
→ Flush in 2027 (shakeout, not the end)
→ New ATH by 2028
Invalidation: lose $35.82 on the weekly and the thesis is dead.
Not financial advice. Just watching the map.
QQQ: Warning 1 of 3 is on. What I do next (backtest since 2000)Warning 1 of 3 just turned on for QQQ.
VIX closed Monday at 21.15, in its top 20% of the past year. QQQ closed at 681.09 (-1.4%), only 0.2% above its 200-day average (about 679.8).
My free Risk-Off Ladder now reads 1 of 3 and is still 100% in. A QQQ close under about 680.1 turns warning 2 on, and at 2 of 3 the ladder steps aside at that close. As I write this on Tuesday, QQQ is trading above that level, but the rules act on the close. Warning 3 (15% below the 1-year high) is far off, at about 64
Chop day, one pay: META TREND at the morning lowA chop day, start to finish. QQQ pinned 684–688 all morning ahead of the midterms tonight and the jobs report Friday — and on a day like this the system's job is not to make money everywhere, it is to take the one clean print and keep everything else small. Today that print was META.
META — the one clean pay
The morning dip flushed to 605.9, and the TREND printed ~09:47 at ~608 — at the low, not after the move. From there it staircased all morning: higher lows, no chase, through 619 by 11:00. +
Income ETFs: Distributions vs. Total ReturnIncome-focused ETFs have become an increasingly important part of portfolio construction.
Many of these funds seek to provide recurring cash distributions through underlying investments, options strategies, or a combination of approaches.
However, one of the most important distinctions investors must understand is that a high distribution rate does not necessarily indicate a high investment return.
Our SPYI chart illustrates why investors should evaluate cash distributions alongside changes i
Opening: SPY December 4th 715/725/788/798 Iron Condor... for a 3.40 credit.
Comments: Remarkably, SPY is paying here with short option strikes at or below the 25 delta strike, so putting one on just to keep theta on and burning.
Metrics:
Max Profit: 3.40 ($340)
Max Loss/Buying Power Effect: 6.60 ($660)
ROC at Max: 51.5%
ROC at 50% Max: 25.8%
ROC at 10% of the Width of the Widest Wing: 15.2%