SPY short swing tradeWe are at the top of the broadening wedge and I believe we are at the end of an upward correction. For me, this is a sell the rip moment.
A large move down may be next and it could be very quick - one to two weeks. If it's correct and we land a target around 730, you can see the potential for a head and shoulders forming into December - January.
To me this is probably the best trade opportunity this year. It may not work, so give it time and don't let it run much higher than here.
ETF market
Black FridayWhen we broke back into the range, technical traders got out and it started accelerating as yesterday's buyers got under water. Also remember there are very few shorts in the market after yesterday, so short covering positions acting as price support is not there.
We may be in a crash scenario to 7k.
Vix is starting to break up and out of it's resistance after many months of bubbling.
My opinion is to hold shorts into Friday or Monday depending on where we land tomorrow. Ultimately I think
$QQQ $SPY - HERE IS WHY IS THINK THE STRONG BOUNCE IS A TRAPNASDAQ:QQQ AMEX:SPY - Bull Trap?
This strong bounce looks bullish on the surface, but the bigger picture tells a different story.
I believe this rally is setting bulls up for another disappointment. Here’s why I’m still watching for the next move lower.
#SP500 #Nasdaq #StockMarket #Trading
SOXL ▲ LONG · Bounce swing 60 / 56 / 52 / 48 → 70 / 75▸ WHY: semis got flushed again - QCOM -9.5% and ARM -5% premarket after earnings, AMD and MU -3%. SOXL is -9% premarket on top of yesterday's -8.8%. that's -64% from the Oct 6 high (169.8) and -17% in two sessions, and it's back inside the April 8 gap (56.6-63.6) with heavy puts at 60. shorting here feels dangerous to me - after a run like this a sharp bounce can come any day. Democrats just took both chambers, and any positive headline from their side on chips or data centers can drop at any mo
$SOXL is a swing long from $65It's finally time to buy semis again. Sentiment is in the dumps after the blue sweep last night but this isn't the time to get bearish. The time to get bearish was Oct 6th, when I bought calls on $SOXS.
I don't think this is a buy and hold play, but I do think this makes for a good trade over the coming weeks.
I think it's likely that we bounce from here up to the two resistance levels.
That's where you'll want to exit as I do think there's more downside in SOXL over the long run.
$SPY & $SPX — Levels for Thursday, November 5, 2026🔮 AMEX:SPY & SP:SPX — Levels for Thursday, November 5, 2026
📊 Key U.S. Economic Data (ET)
8:30 AM | Unemployment Claims | Forecast: 197K | Previous: 194K
⚠️ For informational purposes only. Not financial advice.
📌 #SPY #SPX #StockMarket #TechnicalAnalysis #UnemploymentClaims
QQQ volume profile below the busiest price zoneQQQ fell below its busiest price zone. What does that tell us?
The amber line sits near $722, while QQQ trades around $693 in this November 2 snapshot. The horizontal bars explain why that higher area stands out: it contains the largest volume row within the selected history.
Choose the history first
This 2-hour chart selects the October high through the captured endpoint. It examines the trading activity during that interval, including declines and rebounds. Candles before the shaded select
SOXX is in a downtrendThe major trendline is broken, but the price is testing 200 day SMA right now and there is a positive divergence on RSI indicator. I think the downtrend will continue after a bounce. I don't want to buy it - I think it's safer to sell the rip instead. The first target os 0.5 fib. The downtrend will probably continue all the way to 0.618 fib to close the gap.
Double Top/Head & Shoulders Forming (Expect -16% Statistically)A head and shoulders (H&S) occurs when the price peaks on three separate occasions, with two peaks forming the “shoulders” and the central peak forming the head.
The head-and-shoulders pattern is considered one of the most reliable bearish reversal signals in technical analysis. According to the Encyclopedia of Chart Patterns and confirmed by my own research, this formation indicates an 81% chance of a downside move and an average price decline of about 16%.
Additionally, there are notable
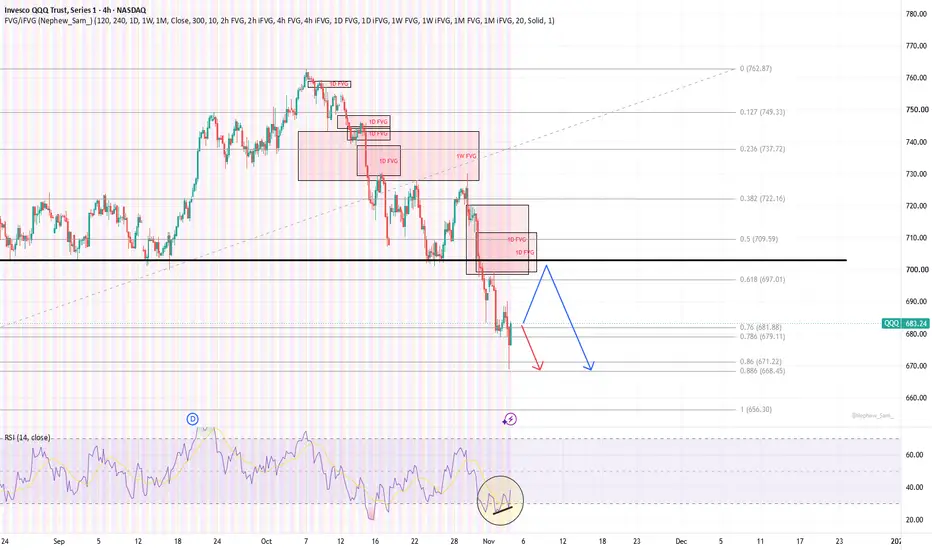
QQQ – At Support!
Since June, this ETF has been trading sideways within a broad range of approximately $660 to $760.
The most recent test of the $760 level resulted in a new all-time high, followed by an 8% pullback (A). This week, we are seeing another 7% decline (B). These can be viewed as two consecutive downward legs, resulting in a combined 15% drop over the course of just one month.
The price is now trading at a level that previously acted as support, creating an opportunity for buyers to step back in
We are not going down just yet..Downtrend on lower time frames, under the anchored VWAP for this dramatic upside rally. Now we haven't retested the previous high, which is very close to last year's close. We just had midterms, which served as a catalyst to shake things around and collect profits. LLM IPOs are being delayed for a reason. We have gold rising and BTC setting up for a higher leg, ironically inverted from the tech stocks.
The theory is as follows: retest of this zone of interest (higher high, last year close area),
SOXL ▼ SHORT · AMD pop faded 72 / 74 / 77 → 61▸ WHY: semis ran into AMD and the election - SOXL +7.3% yesterday (73.1 close). AMD beat, but it already gave back the whole +5% move premarket. Democrats took both chambers and data center limits passed on state ballots (at least 14 Ohio towns, 10 outright bans). Short term that's a headwind for the AI hardware trade, and SOXL is 3x that trade.
▸ LEVELS: 77 above the premarket high zone · 73.1 pre-election close · 67.5 Nov 2 low · 63.6 April 8 low · 61 target zone
▸ PLAN: Tier 1 short in prem
$SKUU , GraniteShares 2x Long SK Hynix Daily ETFSKUU is the GraniteShares 2x Long SK Hynix Daily ETF, providing leveraged exposure to the daily price movement of SK Hynix.
The weekly structure shows a sharp decline from the recent highs, with price now around $14.93 after breaking below the previous trading range.
The chart identifies several areas of interest within the developing correction.
The overhead gaps around $20–$22 remain potential resistance zones if price recovers.
Below the current price, the $12–$11 region is the first area t
$SOXX , 12M Semiconductor Cycle Structure IdeaSOXX tracks the semiconductor sector, giving exposure to companies across chip design, manufacturing, memory, semiconductor equipment and related technologies.
That makes SOXX much more important than simply another technology ETF.
Its cycle structure can be used as a broader reference for the semiconductor complex, including major names such as NVIDIA, AMD and Broadcom on the chip-design side, TSMC and Samsung on manufacturing, Micron and SK Hynix in memory, and ASML, Applied Materials, Lam Re
Biotech Bubble?🧬 Biotech Bubble? 🫧
Is the biotech sector putting in a generational top?
The long-term 3W chart of AMEX:XBI suggests that possibility, and I've taken a long position in AMEX:LABD to capitalize on a potential downturn.
There's more to this trade than a bearish chart pattern. Between AMEX:LABD 's extraordinary volume, elevated short interest, and a developing reversal formation, the setup is becoming increasingly compelling.
1. AMEX:XBI — A Generational Double Top?
The headline cha
$SPY & $SPX — Levels for Wednesday, November 4, 2026🔮 AMEX:SPY & SP:SPX — Levels for Wednesday, November 4, 2026
📊 Key U.S. Economic Data (ET)
10:00 AM | ISM Services PMI | Forecast: 54.8 | Previous: 54.9
⚠️ For informational purposes only. Not financial advice.
📌 #SPY #SPX #ISM #ServicesPMI #StockMarket
S&P500 - The correction just started!💵S&P500 ( AMEX:SPY ) is starting a healthy correction:
🔎Analysis summary:
Since the major range breakout in 2013, the S&P500 entered into a parabolic bullrun. But with the recent retest of the major resistance trendline, we could now see a healthy correction. In hindsight however, this will just be another major swingtrading opportunity.
📝Levels to watch:
$700
Keep your #LONGTERMVISION🙏
— Phil (@TheTraderPhil)
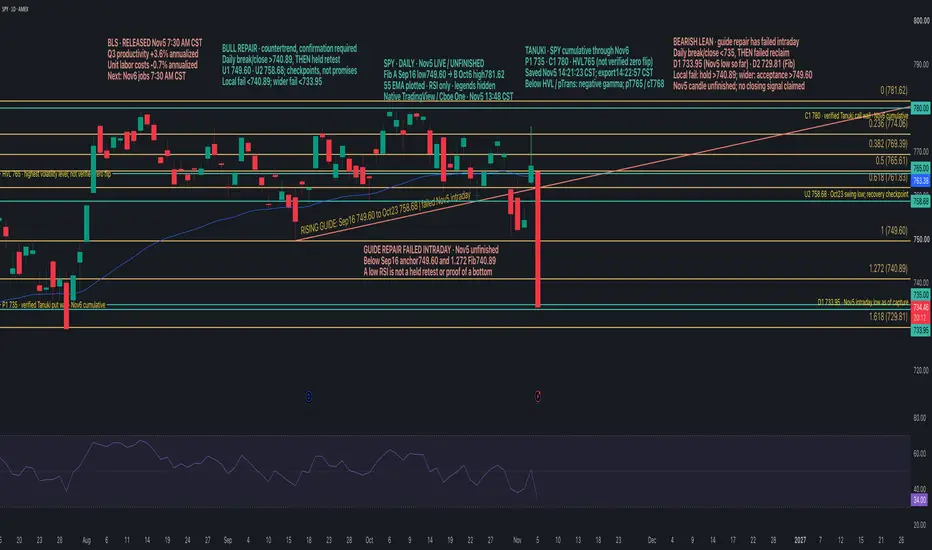
SPY: Rising Guide Failed — 735 Pivot and 740.89 Repair TestSPY daily chart — November 5, 2026, intraday update. The daily candle is unfinished; this is not a closing-signal claim.
The rising guide from September 16 at 749.60 through October 23 at 758.68 failed intraday. Price is below the 749.60 anchor and 1.272 Fibonacci extension at 740.89. Low RSI alone does not confirm a bottom.
BEARISH CONTINUATION: A daily break/close below 735 followed by a failed reclaim keeps attention on the chart’s 733.95 captured intraday reference and 1.618 extension at 7
Only fear confirmed: QQQ flushes to 650.42
Thursday opened into a guidance-driven semi flush and never found a bid. QQQ fell 5.9% from Wednesday's close, slicing the 684.8 shelf, the 682-678 band and the 672-682 zone without one pause that held. SPY lost its last drawn demand at 747-750.15 and traded down to 733.94.
The one trend that confirmed all day was volatility. UVXY printed its trend marker at the 16.15 open low and ran +42% to 22.91. When the only confirmed trend on the board is fear, long entries on the indexes have nothing t