Short
Short

Short 
 Long
Long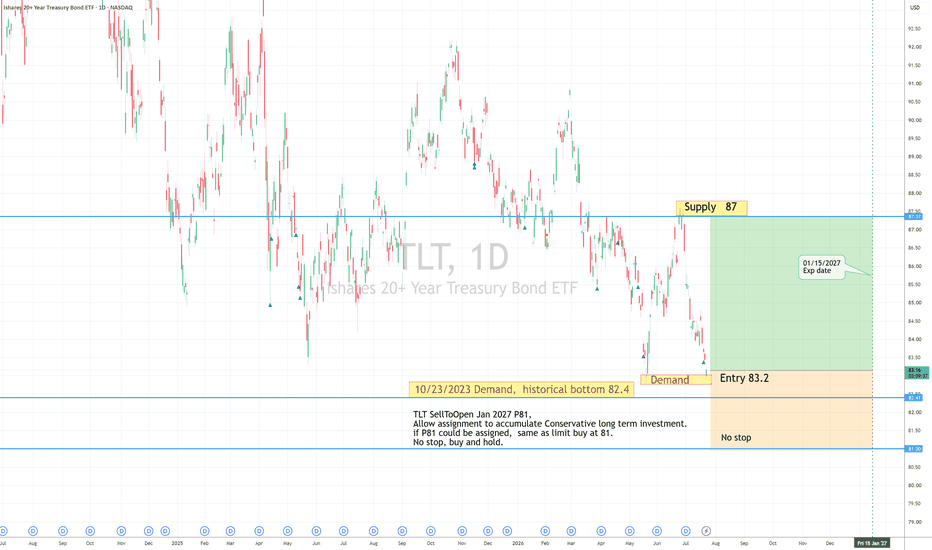
Short 
 Long
Long
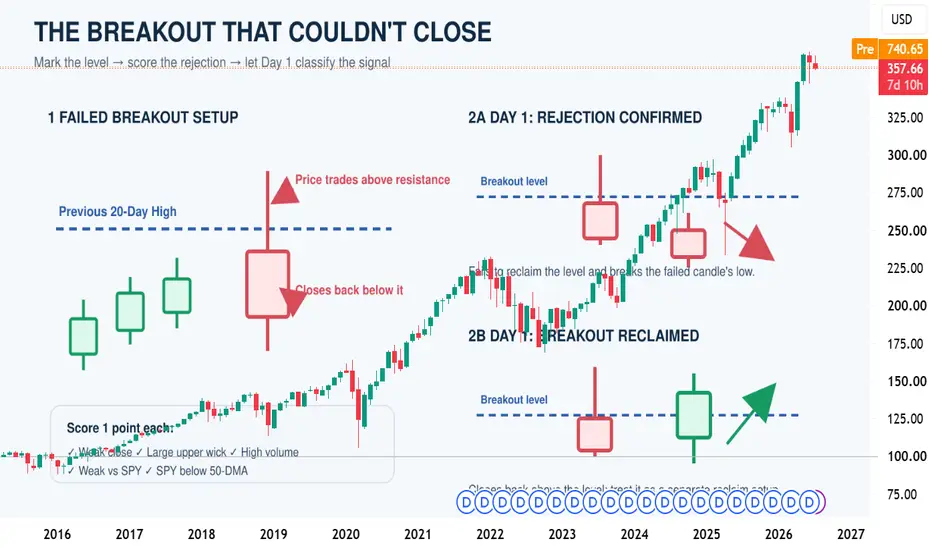
SPY Without The Crash Box: Where We Should Be Today
SPY Without The Crash Box: Where We Should Be Today
Today SPY sits at $740. Without the crash box, we'd be at $2,988. That's not a fantasy projection. It's the natural compounding trajectory of a market that was never interrupted by collective panic. The belief channel, drawn from proven historical growth, puts our ceiling nearly 4x higher than where we actually are.
I can't even fit where we should be on this screen. Let that sink in.
The math of fear:
Every crash box created a debt spiral that took longer to recover from than the bubble took to form. The 2008 crash wiped 57% in 18 months. The recovery took 5.5 years just to get back to zero. That's not a correction, that's a generation of compounding deleted. Then COVID did it again. Each time, the market clawed back eventually, because growth is inevitable. But it clawed back to where it already should have been years earlier, not to where it would have been without the interruption.
The purple fan on this chart shows the compounding divergence. The longer we allow crash boxes to form, the wider the gap gets. It's exponential. We're not falling slightly behind. We're falling catastrophically behind.
What this actually cost:
Look at the wedge list. Economic Waste. Brutal Interest. Hello Benefits Goodbye Jobs. Kiss Retirement Goodbye. Can't Pay the Bills. Struggling Business. Every one of those wedges is a real consequence lived by real people because the market chose fear over investigation.
I'll make this personal. I'm a Chartered construction professional (MCIOB) with innovative solutions to complex problems, including energy infrastructure ideas that would have had me collaborating with people like Elon Musk by now. Instead, my construction business collapsed because fear-driven interest rate policy made it impossible for local authorities to pay SME contractors on time. I'm now fighting insolvency courts and chasing redundancy payments instead of building the future. My ideas didn't fail. The economy failed my ideas.
I should be innovating. Instead I'm fighting for justice because this system doesn't support good businesses in the SME sector. It punishes them for existing during a crash box.
This actually makes me sad and angry. Not for myself. For all of us. For every business that closed, every retirement that evaporated, every innovation that got shelved, every person who was told "the market conditions aren't right" when the only thing that wasn't right was our collective psychology.
$2,988. That's where we'd be today if we'd chosen belief over fear. Standards over panic. Investigation over contempt. Governance over chaos.
We're $2,248 per share behind where we should be. Multiply that across every pension fund, every retirement account, every small investor who was told the market always recovers. It does recover. But it recovers to where it should have been a decade ago, never to where it should be now.
The economy will grow because it must. Our survival in a growing population demands it. The only question is whether we keep paying the price for fear or whether we finally break the cycle.
I dare us to sort this.
Long 
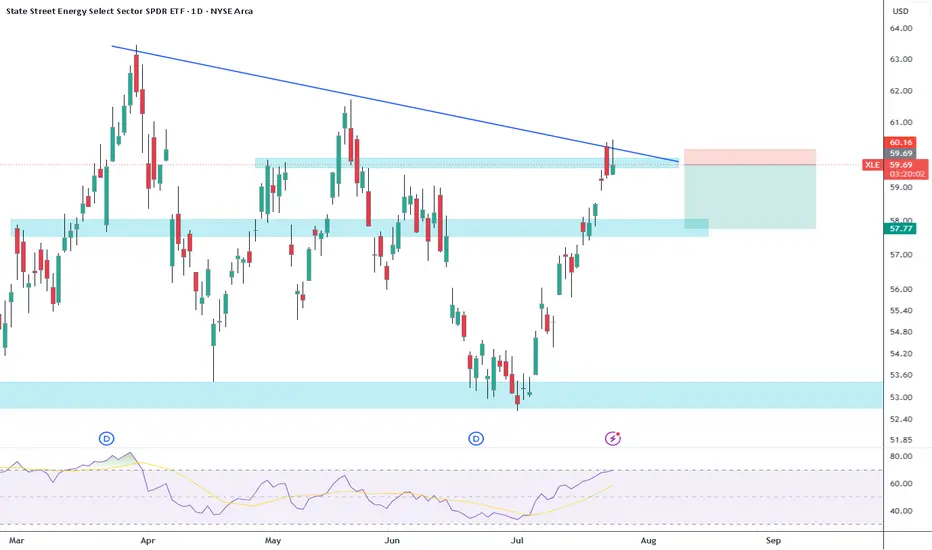
Breakdown Risk in Consumer Discretionary ETF?The SPDR Select Sector Consumer Discretionary ETF has been rangebound as the broader market rallied, and some traders may see risk of a breakdown.
The first pattern on today’s chart is the apparent rounded top between September and May. The lack of breakout in price contrasts with the broader S&P 500 and Nasdaq-100. Does that demonstrate a lack of relative strength?
Second, January’s peak was only slightly above the December 2024 high. The result could be viewed as a false breakout.
Third, the 50- and 200-day simple moving averages are essentially on top of each other. That may reflect uncertainty about the longer-term trend, with potential to resolve in a bearish manner.
Finally, traders could eye the March low of $105.19 as initial support.
Standardized Performances for the ETF mentioned above:
SPDR Select Sector Consumer Discretionary ETF (XLY)
1-year: +7.92%
5-years: +31.36%
10-year: +200.49%
(As of June 30, 2026)
Exchange Traded Funds ("ETFs") are subject to management fees and other expenses. Before making investment decisions, investors should carefully read information found in the prospectus or summary prospectus, if available, including investment objectives, risks, charges, and expenses. Click here to find the prospectus.
TradeStation has, for decades, advanced the trading industry, providing access to stocks, options and futures. If you're born to trade, we could be for you. Learn more here about TradingView’s Broker of the Year!
Past performance, whether actual or indicated by historical tests of strategies, is no guarantee of future performance or success. There is a possibility that you may sustain a loss equal to or greater than your entire investment regardless of which asset class you trade (equities, options or futures); therefore, you should not invest or risk money that you cannot afford to lose. Online trading is not suitable for all investors. View the document titled Characteristics and Risks of Standardized Options at www.TradeStation.com . Before trading any asset class, customers must read the relevant risk disclosure statements on www.TradeStation.com . System access and trade placement and execution may be delayed or fail due to market volatility and volume, quote delays, system and software errors, Internet traffic, outages and other factors.
Securities and futures trading is offered to self-directed customers by TradeStation Securities, Inc., a broker-dealer registered with the Securities and Exchange Commission and a futures commission merchant licensed with the Commodity Futures Trading Commission). TradeStation Securities is a member of the Financial Industry Regulatory Authority, the National Futures Association, and a number of exchanges.
TradeStation Securities, Inc. and TradeStation Technologies, Inc. are each wholly owned subsidiaries of TradeStation Group, Inc., both operating, and providing products and services, under the TradeStation brand and trademark. When applying for, or purchasing, accounts, subscriptions, products and services, it is important that you know which company you will be dealing with. Visit www.TradeStation.com for further important information explaining what this means. SPY Interval Delta-Hedged Iron Condor (Update)This is a continuation of an iron condor post where I'm basically delta hedging at intervals additively, subtractively, or via rolling. (See Post Below).
An additive delta hedge adds a spread to reduce net delta in one direction or the other. If the net position is skewing short, a short put spread is added; long, a short call spread.
A subtractive delta hedge takes profit on a spread to reduce delta in the position. If the net position is skewing short, I look to close a short call spread (assuming it can be done for 50% max) or greater; long, I look to close a short put spread (again, assuming it can be done at 50% max or greater).
I can also do an adjustment "non-additively" by just rolling in the untested side toward current price if I don't want to add units and the DTE is of sufficient duration. I generally don't roll in a side unless there are greater than 28 DTE left, particularly in this market, which has been somewhat whippy.
I also look at whether I can profitably mix and match put spread with call spread to reduce units, looking to close out for around a 1.40 ($140) profit, since the vast majority of the double double iron condors I put on that are ten wide on the put side with the short put leg at the 25 delta and the 2 x 5 wide with the short call leg at the -13 delta pay in the neighborhood of 2.80 ($280) per contract.
Generally, I only want to look at doing adjustments once a week, and only want to consider doing one additively if the net delta of the position is >+/- 5 delta, since a 45 DTE 10-wide spread on the put side with the short leg at the 25 delta only gives you about that amount, as does a 2 x 5 wide on the call side, with the short call legs camped out at the -13.
Currently, the net position is kind of spaghetti-works of spreads in the July 31st, August 7th, and August 21st contracts with 23.70 total credits collected on a capital requirement of 50.00, and a delta/theta of -13.23/28.80.
If I get time, I'll post all the individual spreads that are currently in the hopper ... .
Short on XLF🚨 BANKS AT A KILLER ATH: Opening a Short on XLF Before the Middle East Sets Markets on Fire! 🚨
The US financial sector is experiencing absolute euphoria, breaking one all-time high after another. While retail traders are recklessly buying the tops, assuming banks will grow to the sky, we see an extremely stretched rubber band that is threatening to snap. Combined with the escalating tensions in the Middle East, a perfect storm is forming. We are not waiting for a washout—we are meeting it head-on with a surgically precise short.
📉 Overheated Market Hits a Geopolitical Wall
The XLF (Financial Select Sector SPDR Fund), which bundles banking giants, has had a textbook run. Over the past three months, it has surged by a massive +8.7%, breaking out to a new all-time high (ATH) in the $56–$56.9 range. By doing so, it has essentially hit the absolute ceiling of its 52-week range. Technically, the chart is extremely overextended and ripe for a correction.
But the main story is unfolding off the charts. The Middle East is in flames, and geopolitical risk is rising rapidly. Why are we shorting banks specifically? By its very nature, the financial sector is the most sensitive to macroeconomic shocks, interest rates, and global stability. The moment fear (risk-off sentiment) takes over the market, banking stocks will take the hit first, as big capital will immediately start fleeing to safety.
🎯 Our Trading Scenario and Key Levels
We are capitalizing on a clear price rejection at the ATH and opening a directional short position. The goal is clear—to ride the panic and technical profit-taking.
Action: Short XLF ETF
Trigger: Rejection from the ATH zone + Middle East escalation
Key Support to Watch: $55.00
Target Profit (TP): $54.00
💡 Impact on Investors and What to Expect Next:
In the coming hours and days, the market's reaction at the $55 level will be absolutely crucial. This is the first anchor point (support). If the market fails to hold it under the pressure of Middle East news, it will trigger an avalanche of stop-losses and profit-taking, which will carry us very quickly and smoothly right to our $54 target.
Don't try to catch a falling knife, and don't bet on endless growth when the rules of the game are changing. Managing risk to the downside is much more profitable right now. The position is loaded; we are monitoring the price action!  Short
Short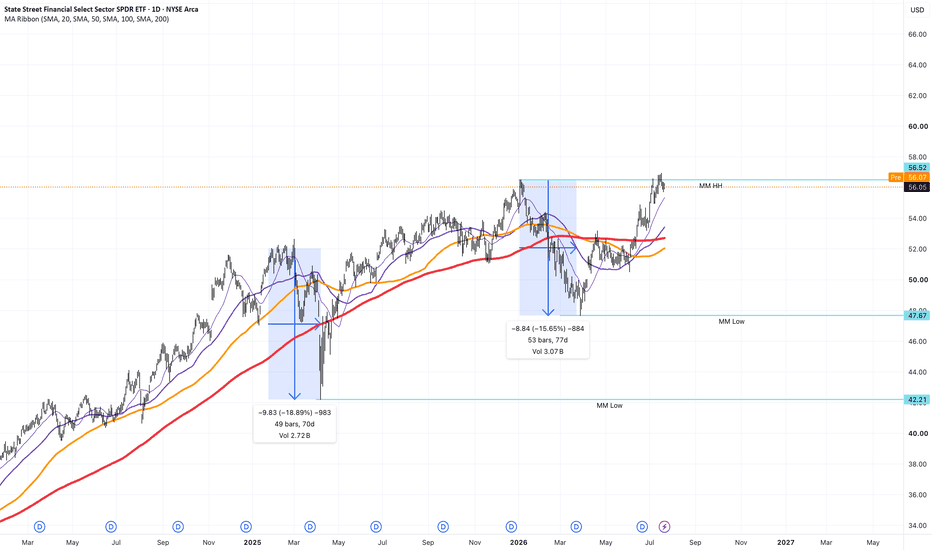
Long 
 Long
Long
 Short
Short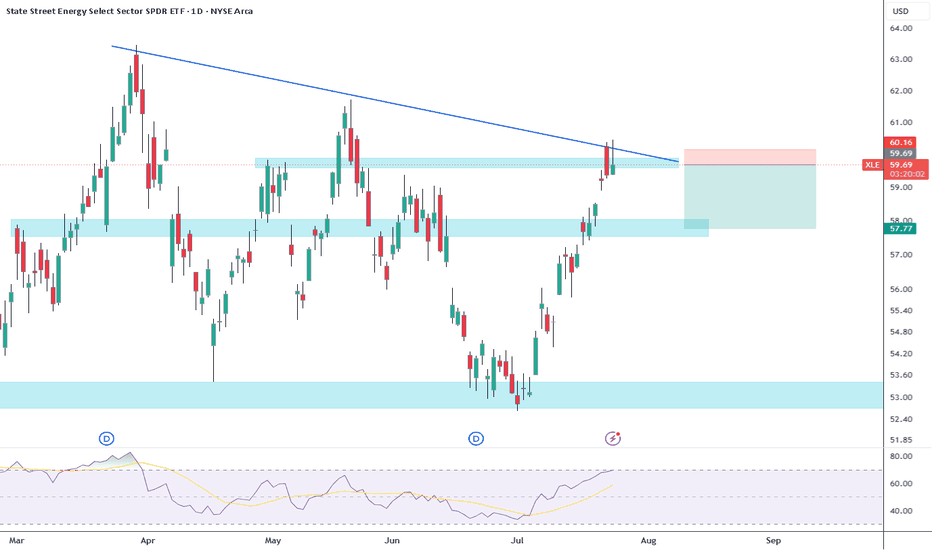
AALG LONG — 1D ALMA Setup (WR 83% · avg RR 4.2)█ SETUP
NASDAQ:AALG · 1D · long only.
(Context: Leverage Shares 2x Long AAL Daily ETF — 200% daily exposure to American Airlines Group; path-dependent vs holding AAL outright.)
ALMA Averaging Strategy: ALMA 3 / σ2, SD band 2, min diff 1/1, 25% per bar, up to 4 adds, hard stop −10% from average entry.
Strategy Tester (AALG 1D):
Win rate 83% · profit factor 8.9 · max drawdown 9%
Avg winning trade +29.3% · avg losing trade −7.0%
Typical hold ~17×1D bars on winners — 2x airline mean-reversion grid on the daily Averaging template · 41-trade sample
═
█ WHY NOW
Fresh 1D ALMA long on the 21 Jul 13:30 UTC bar ~ $14.50 — first lot on this Averaging template (1 of 4).
Bar-close ENTRY after the mid-Jul wash under ~$16 — not a discretionary “buy American Airlines” call and not a leveraged day-trade. Hard stop −10% from fill ~ $13.05 . Exits follow Pine ALMA flip + min diff or the hard stop. Scale-in stays 25% per bar, up to 4 adds, if lower bars qualify.
═
█ MACRO
Sector: AALG = daily 2x AAL beta — US airline demand, unit revenue, fuel/cost gap vs peers, and leisure/corporate traffic drive the underlying more than broad index beta. Leverage and daily reset mean multi-day holds diverge from 2× spot AAL.
Tape (19–21 Jul): American Airlines CEO outlined a plan to close a >$3B profit gap (19 Jul), while peer airline headlines stayed on fuel costs and capacity fights (JetBlue/Spirit slots, Ryanair industry-shakeout talk). Execution is 1D ALMA Averaging on the fill bar — not an AAL earnings or CEO-vision forecast.
═
█ OUTLOOK
Positive factors
- Tester skew: 83% WR · PF 8.9 · avg win +29.3% vs avg loss −7.0% — fat right tail vs bounded ALMA stop path
- Fresh first-lot ENTRY on the 21 Jul daily close ~$14.50 after the mid-Jul slide from the mid-$15s — process re-arm, not revenge size
- ALMA — daily just flipped LONG at the band: 1D L:1 vs LAvg:4.3 — first bar above ALMA / SuperTrend pocket (~14.14–14.17) — touch-quality long, not a late chase deep above the band
- ALMA — slow clocks still stretched SHORT below: 3D S:4 vs SAvg:3.9 (OVERHEAT-S) · 1W S:3 vs SAvg:3.1 — structure clocks still below the band while the daily template arms — classic HTF discount fuel for an Averaging long
- EMA — weekly/3D still Below: 3D Cur S:4 · 1W Cur S:3 with weekly Dev still large in magnitude — slow EMA side not reclaimed; room for mean-revert if daily holds the flip
- SMC — 1D: FVG Enter Bull tagged ~ $14.17 on the 20 Jul daily bar — demand inefficiency sits just under the fill
Negative factors
- EMA — LTF already Above: 15m Cur L:6 · 1H Cur L:2 · 4H Cur L:3 · 1D Cur L:1 — young above-session on the execution clock; not a deep below-EMA discount entry
- SMC mixed at ~$14.17: same window also printed FVG New Bear — bull FVG is not a clean one-way shelf
- 2x daily leveraged ETF — overnight gaps and chop in AAL can erase a “correct” multi-day AAL view via compounding / path dependency even if the underlying drifts the right way
- First lot only (1 of 4) — no averaged cushion yet if the daily bar fails and lower adds qualify or the −10% path prints first
- Snapshot board had no VWAP Touch row for AALG — no Active Support/Resistance levels to lean on in this idea
Takeaway: the 1D ALMA strategy and strong tester skew support a disciplined first lot after the mid-Jul wash, with 3D/1W still below-band and a bull FVG near ~$14.17, but LTF OVERHEAT-L, a young daily above-session, mixed FVG, and 2x path risk frame a repair grind — not a clean trend reclaim; nominal risk stays on the −10% hard stop / Pine exit path.
Base case: follow 1D ALMA Averaging · hold/add on qualifying bars while the ~$14.1–14.5 bull-FVG / ALMA pocket cushions · mean-revert toward the mid-$15s prior shelf if AAL tape stabilizes without a fresh gap through the stop.
Bear case: lose the ~$14.17 bull FVG · 15m/1H giveback extends · AAL headline gap drives AALG through −10% toward ~$13.05 from this fill · template posts the stop and waits for the next bar-close arm.
Chart: NASDAQ:AALG 1D — ALMA Averaging Strategy.
Educational idea. Live position — past backtest ≠ future results. NFA.  Long
Long
Bubble Form Your Shell, The Paradox, Learn From Our Past & Elon Our Universe Expands Like a Bubble, Solidifying Mass Along the Way. Why Shouldn't a Financial Bubble Be Allowed to Do the Same?
Popping a bubble is interfering with someone's business plan. Of course it will fail after that. Then comes the "I told you so" paradox: a purely self-creating feedback loop that feeds fear, causes the very thing people predicted, and then provides false confirmation that validates the bias further. The prophecy doesn't prove itself. It creates itself.
This is why borrowing is so expensive. Because every idea has to survive a renewal cycle of reassessment as it travels an evolutionary path. The origin of any plan may not be as valid as the rethink. The pivot. The new direction. That's not failure, that's iteration. That's how every successful venture in human history has worked.
But instead of allowing that evolution, we fold. "This happened, therefore it's over." How about: we set out to do this, we found this instead, we reassessed, here's the new narrative. Don't mistake iteration for taking the piss. Dive into the mechanics. Examine the timeline. Map each trajectory. Adjust. That's what intelligent capital does.
Panic is the enemy. Not risk. Not even mistakes.
Bring enough wealth into the system to allow mistakes to be made, survived, and learned from. Sanction repeated identical failures if necessary. But do not penalise the evolutionary process itself. Do not pop the forming bubble just because it looks unfamiliar. Otherwise the initial investment, the original belief, the first deployment of capital, becomes nothing more than another entry in the Economic Death Wedge.
We lost a decade last time. Ten years of compounding, innovation, livelihoods, and progress. Because someone panicked. Because someone said "I told you so." Because we confused iteration with failure and pulled the plug on ourselves.
Never again.
The bubble is the mechanism. Let it solidify. Let it evolve. Let it do what the universe does: expand, create mass, and keep going.
I dare us to break the cycle.
Cube Cosmos
Research 24.07.2026🌏 Markets:
AMEX:SPY +2.54 0.34%(pre/m)
NASDAQ:QQQ +2.06 0.30%(pre/m)
🆕 Economic News:
THE US WILL IMPOSE NEW TARIFFS OF 10% TO 12.5% ON 60 COUNTRIES STARTING FRIDAY.
08:00 USA – Building Permits
10:00 USA – New Home Sales
📈 Gap Ups
Reaction to earnings/guidance:
NASDAQ:INTC NASDAQ:AMKR NYSE:THC NYSE:WKC NYSE:EW GPW:ASB XETR:SAP NYSE:SLB NYSE:DLR NYSE:NEM NYSE:CNI NYSE:SXT
Other news:
NASDAQ:NKTR on Start of Phase III Program on Rezpeg for Atopic Dermatitis
NASDAQ:ESLT Wins More Than $370 Million in CBP Contracts Through 2029
NYSE:ORCL wins $7 billion Pentagon software contract
NASDAQ:ADVB surging after the company terminated a purchase agreement giving it the right to issue and sell up to $25 million worth of stock to Helena Global Investment Opportunities I.
📉 Gap Downs
Reaction to earnings/guidance:
NASDAQ:MXL NASDAQ:SMMT NASDAQ:CHTR NYSE:HIG NYSE:DECK NYSE:AXP NYSE:NEE NYSE:VZ
Other news:
NASDAQ:ZVRA Provides Update on Regulatory Submission for Arimoclomol for the Treatment of Niemann-Pick Disease Type C (NPC) in the European Union
NASDAQ:RADX Announces Concurrent US$4.1 Million Registered Direct Offering
NASDAQ:WSE : US regulator rejects banking licence application
‼️ Additional
THE US WILL IMPOSE NEW TARIFFS OF 10% TO 12.5% ON 60 COUNTRIES STARTING FRIDAY.
-- The new measures are being justified as part of efforts to combat forced labor. A 10% tariff will be imposed on countries that have committed to adopting and enforcing a ban on imports of goods produced using forced labor. Other countries will face a 12.5% tariff.
-- The new tariffs will effectively replace the temporary global duties on US imports that took effect on February 24 for a period of 150 days.
-- In total, the measures will affect 99.4% of US imports and will apply to Washington’s largest trading partners — The Hill.
Trump: Xi Jinping is coming on September 24.
The Magnificent Seven stocks saw their sharpest one-day selloff since April 2025 yesterday.
-- Hedge funds and asset managers are actively selling US Big Tech stocks, while short positions in Nasdaq futures are rising rapidly, according to EPFR data.
🏢 IPO
NASDAQ:SCTX – Scribe Therapeutics, Inc.
Company develops CRISPR-based therapies for cardiovascular and metabolic diseases. Lead program, STX-1150, is designed to lower LDL cholesterol by targeting PCSK9 without permanently changing DNA. The company also has programs for elevated Lp(a) and severe triglycerides. Core thesis is one-time or long-lasting genetic medicine for major heart disease risk factors.
Price: $15.00
Shares: 8.6M
Raised: $128.7M
Concurrent Private Placement: $7.5M
Market Cap: ~$256.2M
LTM:
Revenue: $36.3M
Net Income: -$35.7M
Key point:
Lead program is in first-in-human Phase 1 trial, with initial data expected in H1 2027.
Comparable public companies: NASDAQ:CRSP , NASDAQ:NTLA , NASDAQ:BEAM , AQUISEU:VERV , NASDAQ:EDIT , NASDAQ:PRME
📋 List of tickers involved:
NASDAQ:INTC NASDAQ:AMKR NYSE:THC NYSE:WKC NYSE:EW GPW:ASB XETR:SAP NYSE:SLB NYSE:DLR NYSE:NEM NYSE:CNI NYSE:SXT NASDAQ:NKTR NASDAQ:ESLT NYSE:ORCL NASDAQ:ADVB NASDAQ:MXL NASDAQ:SMMT NASDAQ:CHTR NYSE:HIG NYSE:DECK NYSE:AXP NYSE:NEE NYSE:VZ NASDAQ:ZVRA NASDAQ:RADX NASDAQ:WSE NASDAQ:SCTX NASDAQ:CRSP NASDAQ:NTLA NASDAQ:BEAM AQUISEU:VERV NASDAQ:EDIT NASDAQ:PRME
Best regards – hi2morrow team.