US 10-Year Treasury Yield: Bearish Momentum BuildsThe US 10-Year Treasury Yield continues to exhibit short-term bearish momentum, with price action maintaining a sequence of lower highs and lower lows within a descending channel following October's peak near 5.30%.
The yield is currently trading around 4.902%, below the 50-day SMA at 5.004%, suggesting weakening near-term momentum. The 5.080% horizontal level remains an important overhead resistance area, while the descending channel continues to define the prevailing corrective structure.
Te
Government bonds
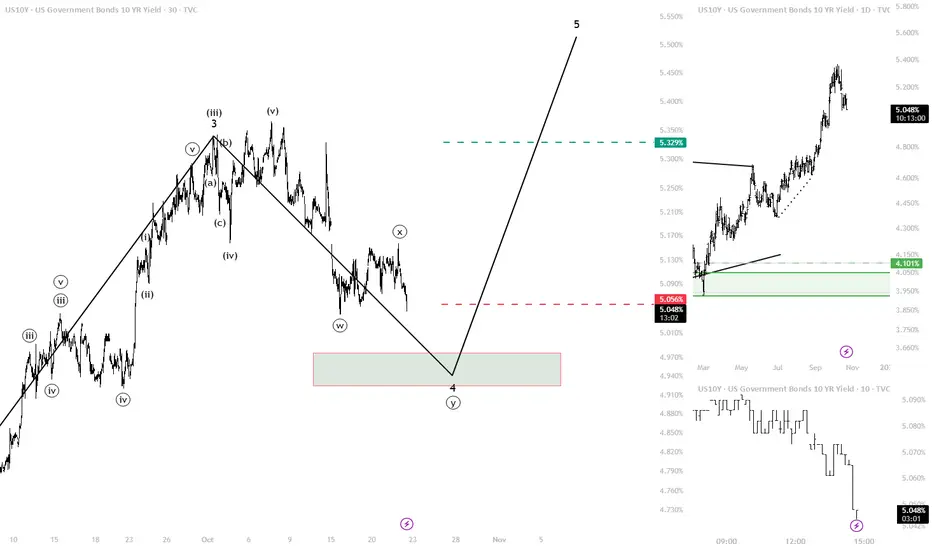
Treasury Yields Eye Final Push Higher🔟💲 US10Y
I expect the 10-year Treasury yield (US10Y) to begin diverging from DXY.
My preferred scenario is for US10Y to make one final push higher, in line with my previous Elliott Wave outlook.
However, this anticipated divergence still requires confirmation from price action.
↗️ Buy Stop: 5.049%
↘️ Sell Stop: 4.956%
Please follow the updated trading triggers for US10Y, as they will determine whether these scenarios unfold as expected.
⚠️ Confirmation remains essential in this mixed-signa
US 10Y bond is at critical junction US 10 Y bond is at critical junction.
Good part is that price has not closed bellow trend line.
Buy my concern is that price closed bellow 50 DAM, there is more pressure to move down further.
Next 1-3 weeks are going to be deciding factor for US 10Y bond future.
Let's watch it
The Bond Trap: When Safety Trumps Fed PolicyBoth the 2 year and the 10 year are trading cleanly below their blue EMA ribbons after failing to hold the highs. However, both are now pressing directly into major ascending white trendlines from the spring base.
The 2 year has shown relative strength compared to the 10 year. It remains more buoyant because it is tied directly to Fed policy expectations rather than long duration growth risks.
So why is the 2 year falling now?
The 2 year reflects where the market thinks the benchmark rate will
US10YR Technical Setup: Potential Head & Shoulders Pattern PointAccording to technical analysis by Matthew B. Schultz on the US 10-Year Government Bond Yield (US10Y, Daily chart), a classic Head and Shoulders reversal pattern is potentially taking shape. Setup: The yield recently peaked above 5.30% to form the head before pulling back to test key neckline support near 4.95%–5.00%. The current consolidation around 4.98%–5.05% marks the development of the right shoulder. Downside Target: A confirmed breakdown below the neckline projects a measured move down
Gold: Resilience or a Breakdown in Disguise?Oil is surging. The US 30-year yield is climbing. So why isn't gold falling harder?
Despite mounting pressure, gold's decline has been surprisingly restrained.
But resilience and vulnerability can look remarkably similar before a decisive move.
The question now: **Will selling accelerate toward the lower range near $3,989, or will buyers defend the current levels?**
No predictions. No bias. Just a divergence worth watching.
Trading probabilities and not trading predictions.
Treasury Yields Await Bearish Confirmation🔟💲 US10Y
Please follow the updated bullish and bearish trading triggers for the 10-Year Treasury Yield (US10Y).
My primary scenario continues to favor a renewed downward move in yields, although confirmation through the corresponding bearish trigger remains essential.
↗️ Buy Stop: 5.175%
↘️ Sell Stop: 4.956%
These intermarket signals will be particularly important for validating our next trading scenarios across Forex, Metals, and Indices.
⚠️ Confirmation remains essential in this mixed-sig
Gold & DXY — Are We Returning to a Familiar Correlation Regime?The dollar's renewed strength is increasingly reflected in gold's weakness, suggesting that the traditional inverse relationship may be reasserting itself.
However, correlations are not static. They evolve as macroeconomic conditions and market expectations change.
Behind every shift in market behavior lies a macroeconomic narrative worth understanding.
The key question is not simply whether gold and the dollar are inversely correlated, but what macro forces are driving that relationship.
Tr
Treasury Yields Await Confirmation🔟💲 US10Y
The recent corrective moves in the 10-Year Treasury Yield (US10Y) have created an important divergence, particularly as Gold has declined sharply despite these yield movements.
Please follow the updated trading triggers for US10Y to identify and confirm the next probable market scenarios.
↗️ Bullish Trigger: 5.175%
↘️ Bearish Trigger: 4.951%
We should eventually see a realignment in these intermarket relationships. The alignment with DXY remains a key factor in validating our direct
US 10Y Yield Hit Its Quarterly Ceiling. Is 4.85% Next?The 10-year yield ran straight into its Q4 ceiling and turned around almost to the basis point.
The Q4 map comes from the Q3 range on weekly bars: high 5.342, low 4.453, close 5.275. That puts the quarterly pivot at 5.023 and R 0.382 at 5.363.
In the week of Oct 5 the 10Y topped at 5.365. That's two tenths of a basis point above R 0.382. It didn't hold there for a single weekly close.
Look at the Q4 weekly closes in order: 5.275, 5.242, 5.081, 4.999. Four closes, each lower than the last, and
Oil, Gold & Yields: A Shift in Market Behavior Ahead of the FOMCAs we enter another FOMC week, key macro variables are displaying some interesting changes in behavior.
On October 22, oil staged a rally before entering a period of consolidation, while gold and US 30-year Treasury yields continued their sharp declines.
By Friday, however, the relationship appeared to be shifting. Oil's rally accelerated, while the downside momentum in both gold and yields became noticeably more controlled.
What is the market telling us?
Is this simply a temporary pause in
Key Levels This Week: Nasdaq, EUR/USD, Nasdaq and othersThe key levels we’re watching this week. I look at five charts and give the one level that matters on each.
Nasdaq 100 (daily): It has fallen sharply over the past two weeks and is starting to look like it’s topping. The level to watch is the mid-September low at 28,753. A close below it weakens the short-term picture and exposes the 200-day moving average at 27,836 and the July low at 27,686. Only a recovery and close back above 31,361 would make me look at this again.
EUR/USD (weekly): The d
US10Y | Conflicting Intermarket Signals📊 US10Y
The recent decline in the 10-year Treasury yield (US10Y) has not been supported by USOIL price action, according to our regular positive covariance model.
This lack of intermarket confirmation has been one of the main reasons behind the conflicting signals we’ve observed across financial markets.
↗️ Bullish Trigger: 5.329%
↘️ Bearish Trigger: 5.056%
As long as US10Y remains below its bearish trigger, my short-term outlook remains sideways to bearish.
I believe this divergence is unl
FOMC QUICK SUMMARYQuick Summary
Story teller
At first glance, today's price action looks contradictory.
Oil is rallying.
Gold is falling.
US Treasury yields are falling.
Normally, lower yields would support Gold. But today's market is focused on a stronger theme:
Higher oil prices are reviving inflation concerns.
The market is increasingly pricing the following chain reaction:
Higher Oil → Higher Inflation Expectations → Fed Stays Restrictive Longer → Higher-for-Longer Rates → Pressure on Gold
That explai
US10Y | Approaching Key Distribution Phase📊 US10Y | Approaching Key Distribution Phase
As long as the 10-year Treasury yield (US10Y) remains below its bearish trigger, we will continue following the main PIFY trading plans for Forex and Metals.
Considering the recent selloff in USOIL, I believe US10Y is increasingly likely to be entering a distribution phase, potentially setting the stage for further downside movement.
↗️ Bullish Trigger: 5.329%
↘️ Bearish Trigger: 5.056%
Please continue monitoring the updated triggers and intermark
When Correlations Break Down: Sometimes the Best Trade Is No TraGold typically exhibits an inverse relationship with the US dollar and Treasury yields. Yet today, gold, DXY, and yields are all declining simultaneously.
This is an important reminder that market correlations are dynamic, not static.
At times, other forces dominate price action, causing assets to deviate from their traditional intermarket relationships.
When familiar relationships stop behaving as expected, forcing a trade may be less effective than observing how the market adjusts.
Trading
US 10Y at 5.13%: under the 21-day MA after the 5.37% peakThe US 10-year yield is at about 5.13% on the daily. Earlier this month it tagged 5.37%, the highest level in roughly 24 years, and has since pulled back as markets weigh a possible December Fed hike ahead of the 27-28 October FOMC meeting.
What the chart shows:
- The yield sits just under the 21-day MA (~5.19%) but well above the 50-day MA (~4.96%). Short term it is cooling, the bigger trend is still up.
- This week's range is 5.04% to 5.16%. The 5.04% low is the first support area.
- The 20-d
France: The Bond Market Was Already Warning Us
Hello Traders,
Let’s be real!
Everyone is watching the riots and chaos in France right now, but the bond market was already smelling trouble way before the headlines got this ugly.
This chart shows the spread between French 10-year yields and German 10-year yields.
Its shows the extra premium investors are demanding to hold French debt instead of German debt.
Right now, that spread is sitting around 143 bps, after recently tagging roughly 150 bps.
That’s a lot.
Germany is basically the b
Gold's Decline: The 30-Year Treasury Yield Led the MoveGold's sharp decline last night highlights the importance of monitoring the broader intermarket environment rather than analyzing price action in isolation.
The U.S. 30-year Treasury yield was the first to break above its resistance level, followed by strength in the 10-year yield. Rising long-term yields appear to have been a key driver of the subsequent selling pressure in gold.
Interestingly, the U.S. Dollar Index (DXY) remained relatively stable, suggesting that the move in gold was more c
French 10Y at 4.94%: I expect a 5% test as the budget stalls👑 My call: France is the hottest risk in Europe right now. The 10-year OAT yield jumped ~9 bp today to ~4.94%, right under its 20-day high of 4.99%, the highest level in more than two decades. I lean 65/35 that 5.00% gets tested before the 2027 budget is settled.
Why it's hot: budget talks are stalled, there is social unrest, and the deficit is still far above the EU's 3% limit. The OAT-Bund spread is ~148 bp (FR10Y 4.94% vs DE10Y 3.46%), close to the widest since 2011. Markets are pricing Fran
US10Y: rejected at 5.37% inside the 1.128–1.27 extensionThe US 10-year Treasury yield hit 5.365% on October 7, the highest level since 2002, and has since pulled back to 5.08%. The high came inside the 1.128–1.27 extension of the 2023–2024 decline, just under the 1.27 level at 5.405%.
The path this year (month-end close):
Jan 4.24 · Feb 3.95 · Mar 4.32 · Apr 4.37 · May 4.44 · Jun 4.46 · Jul 4.72 · Aug 4.75 · Sep 5.29 · Oct so far 5.08
September alone added 53 basis points. From the March 2 low of 3.926% to the October high, the move was 144 basis p
Germany 30Y Bond Yield — Bullish Outlook🇩🇪 Germany 30-Year Bond Yield — Buyers Target Further Upside
Germany’s 30-Year Government Bond Yield is on the bullish radar, with the current trading thesis pointing toward the possibility of another upward extension. The focus remains on whether buyers can sustain the momentum and push yields toward higher levels.
From a technical perspective, the buying scenario favors continued upside development, provided the broader structure remains supportive. A sustained move higher could signal that