AMERICA WILL BE GREAT AGAIN… JUST NOT IN THE WAY YOU THINK.If Bessent and Warsh were really clever, they'd convince Trump and everyone else that Treasuries are the thing to short and Bitcoin is “the future.” 😂
Meanwhile, they quietly let the stablecoin system strengthen the dollar while the crypto media does the marketing for them and the moonboys pile into Bitcoin longs.
Think about the positioning: long Bitcoin, short Treasuries, exactly what the current narrative encourages.
But what if everyone has it backwards? 🤔
US Treasuries are offering yie
ETF market
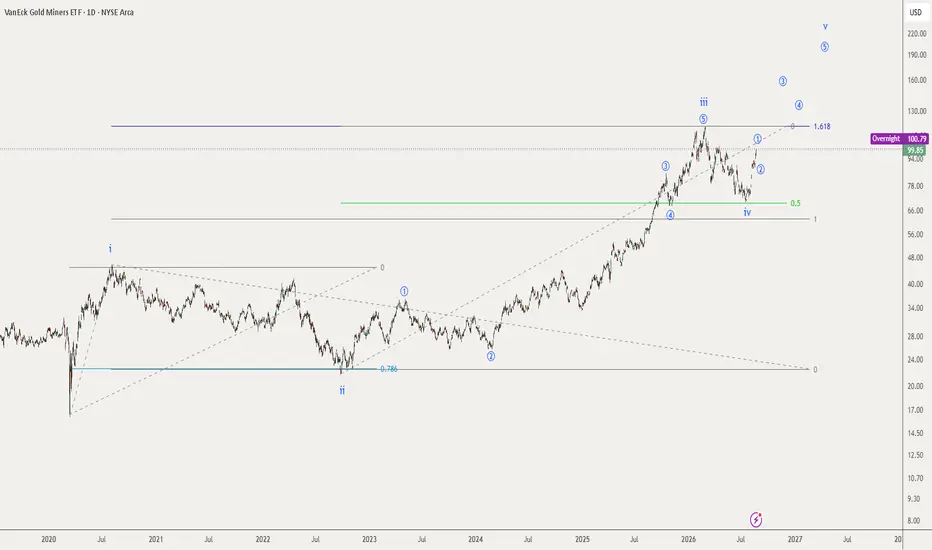
GAMMA SQUEEZE: Why Gold Prices Will Hit $7,500 in 2027⬛ GAMMA SQUEEZE: Why Gold Prices Will Hit $7,500 in 2027
2026 update, data as of August 22, 2026
◾ Bottom line
Last year's version of this note made one call. A 1% rotation out of U.S. Treasuries could carry gold to $5,000 an ounce, and in a squeeze, past it.
That call got tested in the real world. It passed.
Gold printed an intraday record of $5,589.38 on January 28, 2026 (settlement peak $5,602.23 the next day), the exact self-feeding, options-fed blow-off the framework described. Then it
KWEB: Chinese internet on the verge of a reversalAMEX:KWEB
KraneShares CSI China Internet ETF tracks the largest Chinese internet companies trading on the Hong Kong Exchange, NASDAQ, and NYSE. Top holdings: Tencent 9.99%, Alibaba 8.08%, Meituan 8.05%, PDD Holdings 7.99%, NetEase 6.20%. Total 34 positions with AUM around $5.3–6.5 billion.
Technicals
On the daily chart, KWEB has formed an inverted head and shoulders pattern, where the deep retracement to the right shoulder‘s base coincided with the most important technical event: a dai
SPY Aug 24–28: Below Equilibrium — 764 Is the First Major TestSPY enters the week of August 24–28 at 766, below the model’s weekly equilibrium at 770–772.
That creates a very different setup from a market beginning the week near its center of gravity. Friday’s close at 765.65 leaves SPY just above the Lower Predictive Rail near 764.
The opening question for the week is therefore relatively simple:
Can SPY reclaim the 770–772 equilibrium, or does weakness extend through 764?
A recovery toward 770–772 would bring price back toward the center of the weekl
Stock Market Forecast | BTC TSLA NVDA AAPL AMZN META MSFTStock Market Forecast
0:00 - Sector Data, Sentiment & Dark Pool Analysis
4:17 - S&P 500 (SPY)
4:48 - QQQ & Tech Sector Outlook
5:05 - Mag 7 Index Basket
6:06 - Bitcoin (BTC)
7:54 - Tesla (TSLA)
8:54 - Meta (META)
10:16 - Amazon (AMZN)
11:37 - Microsoft (MSFT)
14:02 - Alphabet (GOOGL)
14:56 - Apple (AAPL)
16:13 - Nvidia (NVDA
QQQ | Wk 34 2026 | 1hr ChartThe hourly resistance level was created at 10:30 when price action fell below $732.20.
Price action is nearing the daily distribution trend and hourly resistance level at $740.16 which could be a target later this week.
A FrontSide support level sits at $718.47, a candle created Aug 11 at 11:30 which is part of the hourly accumulation trend. The $718.47 level is the last hourly support level in the range.
A weekly support level is at $724.36 and if strength favors the higher timeframe, then t
EWH Cloud Breakout w/ LS ConfirmationOn 8/21, EWH closed above the weekly cloud for the third consecutive day, with the breakout reinforced by the lagging span (Chikou) also clearing the cloud. Price gapped up through potential resistance at the 0.618 Fib level (23.14), retracing the decline from the 5/7 swing high (24.58) down to the 6/30 low (20.82).
This signal has fired 6 times in the past 3 years (this is a small sample, not statistically robust for this symbol), profitable in 4 of 6 occurrences assuming a simple trade close
QQQ / NDX Weekly Outlook – Week 33 of 2026 (17-21 AUG)QQQ WEEKLY MARKET OUTLOOK
QQQ Weekly Recap Outlook
Price first rejected from the Flip Zone at Wednesday's open, activating the Short Scenario.
We took the short setup and captured a 3.6-point, 0.5% move to the downside. We took three partial profits according to the plan, with the remaining position stopped at entry.
Then, on Thursday, price broke out above the Flip Zone and activated Long Scenario 3 after retesting the Flip Level.
The retest entry delivered a 2.5-point, 0.34% move to th
SPY / SPX Weekly Outlook – Week 33 of 2026 (17-21 AUG)SPY / SPX WEEKLY MARKET OUTLOOK
SPY Weekly Recap Outlook
We didn't take any trades on SPY this week because none of the key levels or scenarios we had mapped out were triggered.
(For reference, I have included last week's outlook on the right.)
Weekly Execution Metrics
Total Trades Activated: 5 (excluding open running equities)
Winning Trades: 5
Losing Trades: 0
Win Rate: 100% (on closed or partially closed sequences)
Index Options: 1 Trade (1 Win — QQQ)
Futures Desk: 4 Trades (3 W
SPY ATH?Hello Traders,
Well the market especially the NAS, QQQ and Tech has been selling off but the actual trend has not been broken. I believe Spy is the tell as it held the 50EMA today like a champ. Tomorrow we have the "Bull" Full Moon (Green Dot) and of course FOMC decision at 2. IMO we head higher to an ATH from here and tomorrow could be the "change" to get us headed in the right direction. Mercury Retrograded ended and a Bull full moon tomorrow. I think Citadel has put a scare in the market say
SPX 7700-7800 before big pullback in fallHello Traders!
Refer to my other idea posting from back February showing the cycle that predicted this very thing happening as Tom Lee just posted. Here is my updated spy chart showing the top targets then possible pullback targets. From my cycles I am predicting this one to be be bigger than most... Notice Tom Lee says feel like bear market. I indicate possible down targets depending on what sets the market down and how fast it accelerates. Once it bottoms then expect another nice bull market i
XLB: Large Consolidation Is Building a Higher-Low StructureSniper Alpha has identified a large consolidation developing in XLB, the Materials Select Sector SPDR ETF.
Although price remains inside a broad sideways structure, the internal structure is beginning to improve. XLB has already formed a higher low, followed by a higher high, while the latest pullback is still holding above the major horizontal support area.
This suggests that buyers may be gradually gaining control beneath the descending resistance line.
The main areas to watch are:
Desce
QQQ at 20ema, 50ema, above week ema9 and inverse head shoulder!!NASDAQ:QQQ why are people bearish? Above weekly ema9, bounced above ema20 day as well as the 50ema day... also to me that would be an inverse head and shoulder's on the daily chart where qqq at would be the final leg before the pump!
It needs to hold the 50ema and the 20ema to make new ath and go to 800$ ish which is where the inverse head and shoulder's measured move pattern break target at.
Good time to be a bull
VOO TRACKS EVERYTHING THAT IS TRADED IN THE USA.I AM IMPLYING THAT THE MARKETS WILL RALLY VERY HARD.
The Impact of Tariffs and Monetary Policy on VOO and the U.S. Economy
The Vanguard S&P 500 ETF (VOO) has been experiencing significant growth, mirroring the strength of the U.S. economy and the shifting landscape of global finance16. This upward trajectory can be attributed to several interconnected factors, including changes in monetary policy, the implementation of tariffs, and their effects on liquidity and investment patterns.
Central
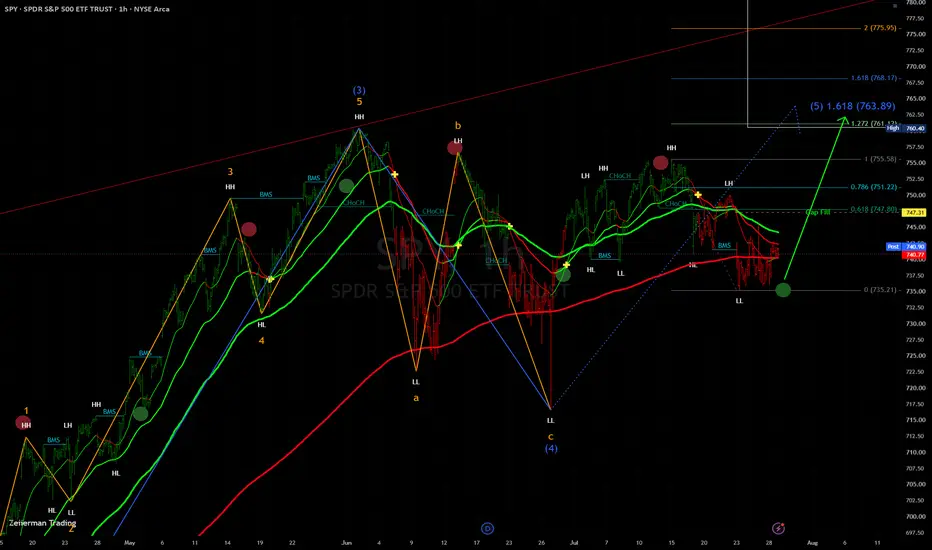
Symetric Heads and Shoulders Pattern on $SPY 1hAMEX:SPY is starting to form a heads and shoulders pattern on the hourly time. If the pattern plays out (neckline break) I would expect AMEX:SPY to fall to the 0.5 fib level around $753.
In addition the the visible heads and shoulders pattern, the daily chart had a bearish macd crossover.
TLT LongNear historical low, Used as support
Entry 82.0
no Stop
Target 92, 100
Risk management is much more important than a good entry point.
I am not a PRO trader. About 25% of my trades had been stopped quickly.
TLT BFF (buy for Free)
SellToOpen 2028-1-21 P77, 2.6x2 (Delta=-0.24)
BuyToOpen 2028-1-21 C82, 4.35 (Delta=0.90)
Entry of a net 0.85 credit.
Allow assignment to accumulate Conservative long term investment.
if P77 could be assigned, same as limit buy at 77.
No stop,
XOP upXLE : Energy producters like SHELL, totale etc
XOP : More Explorers
Hello there, AFTER 5 years of consolidation
Energy have it's turn. Ormuz is just an excuse. The geopolitical news are just diversions for the people to hide the true problem.
Don't forget : High cost of energy = crisis like 2008.
Follow this, i will do.
THE BEGINNING OF THE END? [SHORT] EQUITIESHere we see a repeated top pattern seen before the last two major bear rallies / markets. Do I need to say more? It looks really bad and im ready for it.
The last bull rally pop from 740 August is the classic blow top bull trap before cascading sells enter waterfall style!
QQQ/SPY topping and reversing means AI overextended stocks are about to deflate and correct harder than average
Enjoy!
--
🧠DATA DRIVEN signals
FOLLOW and LIKE for more high quality BACKTESTED signals from proprieta
Opening: QQQ September 18th 676P/-686P Short Put Vertical... for a 1.78 credit.
Comments: This is a delta hedge against my Sept 4th and Sept 11th iron condors, which have skewed net delta negative, where their respective short put vertical aspects just aren't providing that much pro anymore, and where their duration (28 DTE, and 35 DTE) are getting a little bit short in duration to the short put verticals up.
It is probably not good standalone trade, since the general preference would be to enter a directional on weakness and higher IV, but you g
SPY 500 — The Battle at 765SPY is sitting at a critical decision zone. After a clear intraday decline, price has bounced from the lower levels and is now testing the 765.12 resistance area.
🔥 Trading Setup
Current: ~764.84
🔴 Resistance: 765.12
🟢 Support: 764.20
Bullish scenario 🚀
A sustained breakout above 765.12 could open the path toward:
🎯 767.34
🎯 769.16
🎯 771.02
Bearish scenario ⚠️
If 765.12 rejects price and 764.20 breaks, downside levels become:
🎯 762.61
🎯 761.05
🎯 759.20
🧠 My View
The key isn't predicting t
SPY Dipped To 762 Then Reclaimed 765.71.SPY Dipped To 762 Then Reclaimed 765.71.
SPY lost 765.71 and dropped to 762 overnight, but reclaimed the level and is trading 766, back above it. Thursday's read flagged a potential short only if price held below 765.71 - it did not hold, it reclaimed, so the breakdown stalled and no short setup confirmed. Price is now chopping around 765.71 with the 4H thesis still short but the level defended, and a fresh bear announcement printed right at it. Undecided on the line. Neutral.
Resistance: 769.
Research 21.08.2026🌏 Markets:
AMEX:SPY +3.57 0.47%(pre/m)
NASDAQ:QQQ +5.60 0.79%(pre/m)
🆕 Economic News:
CRYPTOCAP:BTC has surged 23% over the past two days, while NASDAQ:MSTR is up 35% and NASDAQ:COIN has gained 27%.
📈 Gap Ups
Reaction to earnings/guidance:
NASDAQ:ROST NYSE:BKE NYSE:BEKE NYSE:BJ NYSE:UI
Other news:
AMEX:GDXU — the Gold Miners 3X Leveraged ETN — has surged more than 50% over the past three days.
-- Another sign that investor interest is shifting from o
VPNG | Continued growth ETF- Timeframe: Weekly
- Trade type: Buy stop order
- Price: 20.00
- Take Profit: Open
- Stop Loss: 18.13 (-9.40 %)
Idea: Long on a breakout above last week's high - bullish momentum continuation.
Entry: Buy stop above last week’s high.
Stop-loss: Below the low of the same candle.
If the weekly candle closes below this level, the trade is invalidated.
Take Profit: Trailing stop following the lows of new weekly candles.