SPY Is Holding Above 764.76 On Day Five Of The Long.SPY Is Holding Above 764.76 On Day Five Of The Long.
SPY is at 767.00 in premarket after closing Monday at 765.50, 0.74 above the 764.76 line that ends the long. The 4H structure has turned bearish, while both timeframes show a long thesis built on conviction running against that structure - a recovery attempt, not strength. JOLTS lands at 10:00; the regular-session close is still the only test. The long stands on its original terms and is not added to. Long.
Resistance: 770.09 - the shelf los
ETF market
Growth vs. Value: Can Growth Break Through This Time?The VUG/VTV ratio is back near the descending trendline on this daily chart, and this is where things get interesting.
The previous two marked peaks were followed by declines in the ratio. After its recent rebound, growth is once again challenging that line. I’m watching whether this move can develop into a sustained shift in relative strength.
For anyone unfamiliar with this chart, VUG/VTV compares Vanguard’s growth ETF with its value ETF. A rising ratio means growth is outperforming value; a
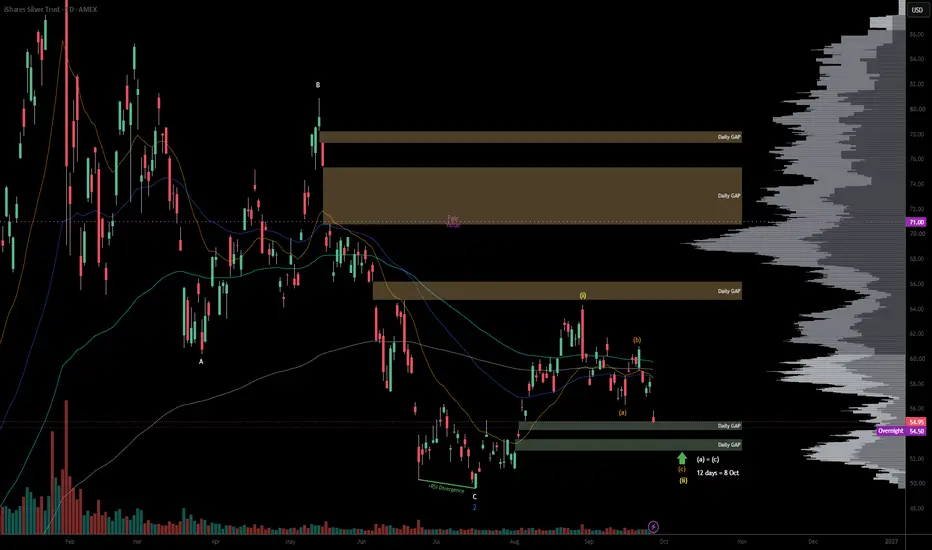
SLV - (c) leg remains active...Not gonna catch the falling knife while downward momentum in (c) leg remains active. Best to wait for liquidity sweeps toward the Daily Gaps.
(a) = (c) equality could stretch this out to at least till the 8th of October. This setup is only valid if price remains above $51.12 on a Daily Close basis.
Plenty of room to the upside. Let's re-visit this soon.
$SPY & $SPX — Levels for Tuesday, September 29, 2026🔮 AMEX:SPY & SPCFD:SPX — Levels for Tuesday, September 29, 2026
📊 Key U.S. Economic Data (ET)
10:00 AM | CB Consumer Confidence | Forecast: 89.2 | Previous: 89.4
10:00 AM | JOLTS Job Openings | Forecast: 7.23M | Previous: 7.27M
⚠️ For informational purposes only. Not financial advice.
📌 #ConsumerConfidence #JOLTS
Qqq updateThis won't be as in depth as my usual .
I'm gonna go over a few tech Sectors ,chips and software
Im still thinking 750 this week will come.
But I don't think it can go much further .
If you follow me then you know qqq is up at its 17 trend.
Short term resistance was hit last week on some major sectors and I think they resistance mark the top.
Heres what I see
AMEX:XLK
Biggest sector
Trendline support is debatable but resistance isn't.
NASDAQ:SMH chips
Same resistance , also
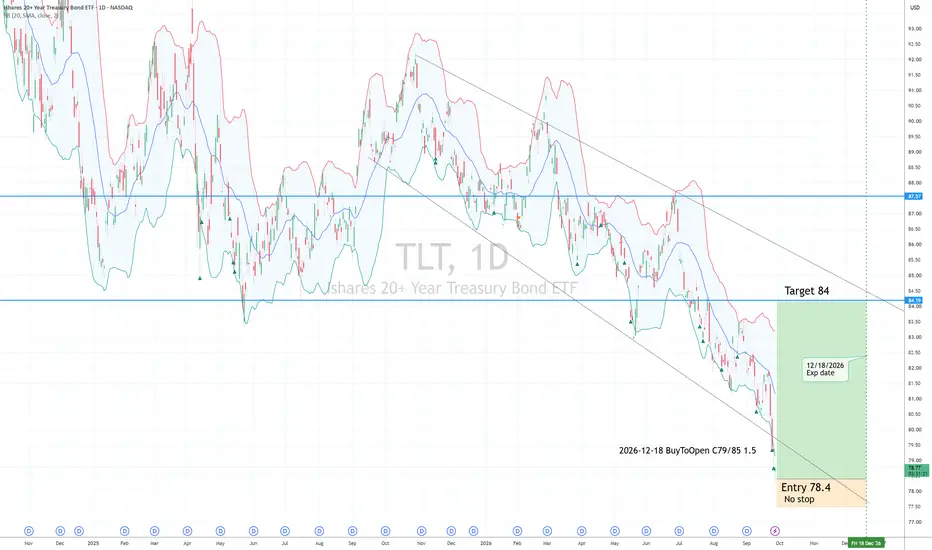
TLT LongBollinger Band oversold
Entry 78.4
no Stop
Target 84
Risk management is much more important than a good entry point.
I am not a PRO trader. About 25% of my trades had been stopped quickly.
BuyToOpen 2026-12-18 Call Spread C79/85, 1.5 (C79 Delta= 0.52)
no Stop in this Option plan, max risk is 1.5
AI Says #4: Today's Drop in Gold $GC! / $GLD📌 About the "AI Says" series of articles
═════════════════════════
The core research in this series is developed using AI. While it's tempting to use AI to predict price action or pick trades, some of the best use cases for AI is to support chart research & analysis, idea & strategy testing, pattern recognition, and organizing market information. AI truly shines in these scenarios.
The goal of this article series is to demonstrate these practical AI use cases. Trade decisions and execution sh
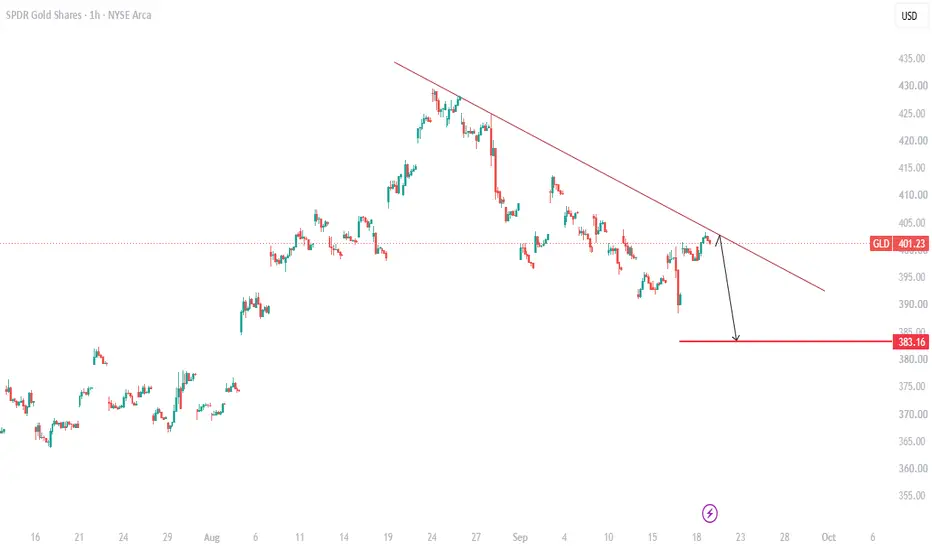
GLD: Bearish TrendsSPDR Gold Shares (GLD) closed its last trading session at $401.17 USD, up 0.71% over the day, amid discussions regarding the debasement trade and macro commodity trends. GLD remains the top vehicle of high volume, short term active traders due to its massive liquidity and near zero bid ask spreads.
Technical Outlook:
GLD is situated on a descending channel motion, trending on lower highs and lower lows for couple of weeks now, in regards to the chart framework. Price is presently at the resista
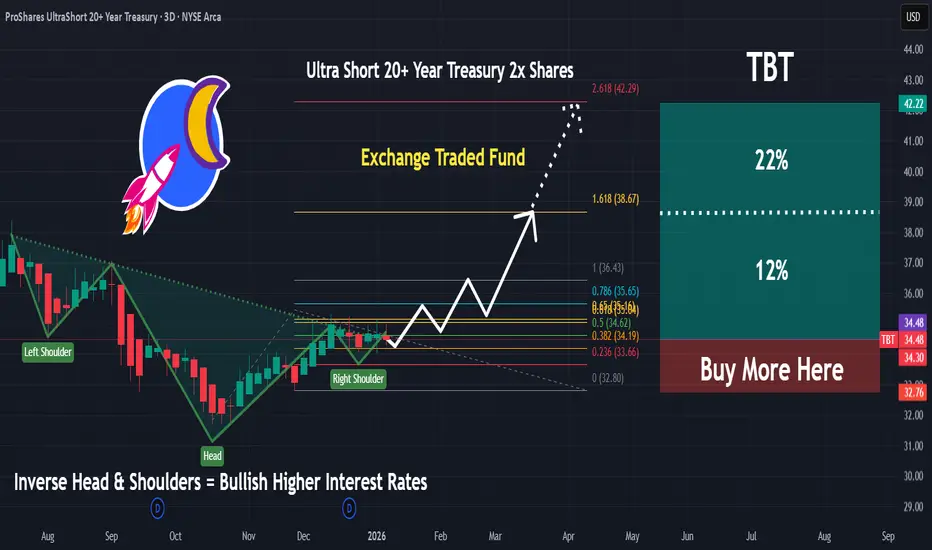
TBT | Expect Interests Rates To Surge | LONGProShares UltraShort 20+ Year Treasury seeks daily investment results, before fees and expenses, that correspond to two times the inverse (-2x) of the daily performance of the ICE U.S. Treasury 20+ Year Bond Index. The fund invests in financial instruments that ProShare Advisors believes, in combination, should produce daily returns consistent with the fund's investment objective. The index includes publicly-issued U.S. Treasury securities with minimum term to maturity greater than or equal to t
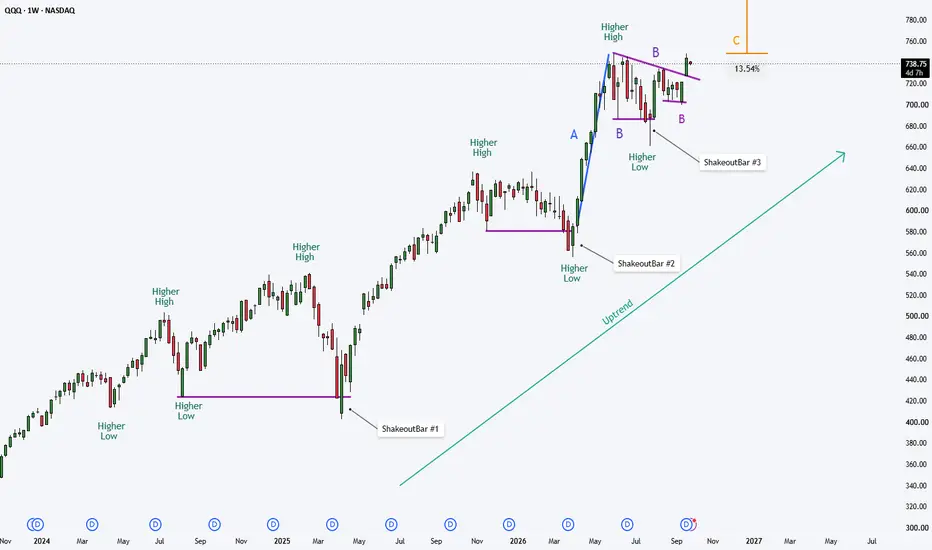
QQQ Toward $850
QQQ Toward $850
The reasons:
1. The chart shows the price trending upward, consistently forming higher highs and higher lows. Looking back, every pullback has ultimately led to a new all-time high.
2. The April rally (A) ended with a strong 35% momentum move, after which the price began consolidating within the upper 50% of that move (B). Looking more closely at this consolidation, we can see that a shakeout occurred, potentially triggering stop-losses (Shakeout Bar #3). Following this, th
Research 28.09.2026🌏 Markets:
AMEX:SPY -2.85 -0.37%(pre/m)
NASDAQ:QQQ -4.90 -0.66%(pre/m)
🆕 Economic News:
Wall St futures drop as oil spikes after Trump rejects Iran peace proposal
10:30 USA – Dallas Fed Manufacturing Index
13:30 USA – Fed Barkin Speech
📈 Gap Ups
Other news:
NASDAQ:KOD : Zenkuda and tabirafusp-ted met primary endpoints in pivotal Phase 3 DAYBREAK trial in wet AMD
Oil majors and refiners higher as Brent jumps ~4% to above $108 after Trump rejected Iran's proposal to reopen
SPY WEEKLY FORECAST: 772 PIVOT, 778-779 AND 766-767 DEFINES WEEKSPY enters the new week with the model equilibrium centered around 772. The first major boundaries are relatively close to equilibrium, creating a compact decision structure for the week.
The key areas are 778-779 above and 766-767 below. These are the first major levels that could determine whether SPY expands toward the outer weekly targets or remains contained around the 772 equilibrium.
UPSIDE LEVELS
The first upside test begins around 778.
Several model levels are concentrated between rou
SPY Gave Back 770.09 Premarket - The Long Still Rests On 764.76.SPY Gave Back 770.09 Premarket - The Long Still Rests On 764.76.
SPY is at 767.90 in premarket, back under 770.09 after closing Friday at 771.30 above it. The long taken on the 765.52 reclaim stands on its original terms: only a regular-session close below 764.76 ends it, and price is 3.14 above that line. Both timeframes have gone neutral - the hourly structure has turned bearish again while the 4H stays bullish - and a narrow-range 4H bar says nothing about direction. Friday's reclaim was not
SPY: $767 Is the Pivot September 28–October 2SPY enters the week holding its broader daily recovery, but the lower timeframes show a pullback after rejection near $772.50. My thesis is cautiously bullish while $766–$767 holds, with stronger confirmation needed above $772.50–$775.
The daily chart supports the larger structure, the hourly chart defines the support test, and the 15-minute chart determines whether buyers are regaining control. The options overlay adds context around several of those same levels.
Catalysts this week
Wednesda
96 tests declared before the data, and none of them passedLast month I built a 1-minute data logger, ran it live for three days, backfilled more than a year of history behind it, and then did the only part that matters: I wrote down what I was going to test before I tested it.
The universe was 15 US equities over 273 trading days and 8 crypto pairs over 362 days, about 4.6 million symbol-minutes in total. Costs were fixed at 2 basis points per side, and a cross-sectional pair pays two round trips, so 8 basis points. Three horizons were declared in adv
SPY Sunday Market Prep: Sept 27Heading into September 28 through October 2, my current lean is something similar to the Yellow scenario. I’m preparing for a messy week with sharp moves in both directions, failed breakouts, and the possibility of a deeper flush before buyers regain control. There are credible paths toward both new highs and another leg lower. With this combination of headlines and economic releases, I want confirmation before committing to either.
The weekend gave us another example of why this market can cha
$SPY & $SPX — Levels for Monday, September 28, 2026🔮 AMEX:SPY & SPCFD:SPX — Levels for Monday, September 28, 2026
📊 Key U.S. Economic Data (ET)
8:15 AM | Fed Speaker: FOMC Member Bowman Speaks
1:25 PM | Fed Speaker: FOMC Member Cook Speaks
1:30 PM | Fed Speaker: FOMC Member Barkin Speaks
⚠️ For informational purposes only. Not financial advice.
📌 #FOMC #FedSpeakers
If you're taking a long on the gold, better take it leveraged.I would say if there is a way to take a long setup this would be a good one because it's triple leveraged micro gold miners so it will move faster better and if it moves the direction it should move I would say the entry should be slightly lower let it do a shakeout during the day and go up because there is I guess a volume profile there that gets supported that would be a good effective response from that level and so you can put the stop underneath in the middle of the range and then keep it g
Sitting on supports might be good for a longYou can see the same with like gold here. There is like it's sitting on a certain support in the middle of the range and silver showing it even clearer that there is a certain amount of distribution that stopped and it's kind of flattening and even going up a bit. So I would say that's why long could be working out with the silver AMEX:SLV and gold AMEX:GLD . Obviously I would take the stronger of the two or the three lithium as well. NASDAQ:LITE seems to be a strong one.
AMEX:GDXU mig
SOXX — Semiconductor Sector: Breakout and ContinuationSOXX is trading around 572.68 and remains inside a broader ascending channel after the strong rally from the 466.70 area. On the daily chart, price has formed a consolidation above the 534.14 support and is now testing the upper part of the recent range around 570–600.
The structure remains constructive as long as price holds above 534.14, while the 466.70–480 zone remains the major lower support. The recent breakout from the local accumulation structure gives a potential path toward 599.37, wh
WHEN IS THE BEST TIME TO BUY STOCKS? THIS CHART HAS CLUESIn this video, we give an update on the stock market crash that I discussed in my last S&P 500 video and we talk about the mental framework and investing strategy that I am personally building in order to be prepared for it alongside showing you guys my personal guide to buying stocks