What's the Rollover in Insurance Stocks About ?Remember the financial crisis of 2008 in the US
It was the nearest thing to a melt down.
So flash forward to the roaring go-go US stock market in 2026.
What's the rollover in Insurance stocks about ?
Look at the price chart of IAK, the I- Shares Insurance ETF .
What's going on here ?
While the US stock market continues to trade at or near record highs,
something really sinister is brewing in insurance industry stocks.
Note that big money is selling these stocks right now.
Do you know wh
ETF market
WYCKOFF SPRING — HOW DOES IT FORM?
📉 **WYCKOFF SPRING — HOW DOES IT FORM?**
The **Spring** is one of the key events in the Wyckoff Method.
It typically appears during the **Accumulation phase**, near the lower boundary of a **Trading Range**, after the market has already experienced a significant decline.
### 🔹 HOW DOES IT FORM?
Price approaches an established support area and then **breaks below the previous low**.
This breakdown can trigger:
• Stop-loss orders
• Short entries
• Panic selling
• Liquidity below the range
Research 25.09.2026🌏 Markets:
AMEX:SPY +2.67 +0.35%(pre/m)
NASDAQ:QQQ +4.43 +0.60%(pre/m)
🆕 Economic News:
Wall St futures gain as AI enthusiasm eases worries over higher oil prices, yields
05:15 USA – Fed Williams Speech
08:30 USA – Durable Goods Orders
09:20 USA – Fed Schmid Speech
10:00 USA – Michigan Consumer Sentiment Final
14:00 USA – Fed Hammack Speech
📈 Gap Ups
Other news:
NASDAQ:AKAM signed $11.6bn seven-year cloud services agreement with Anthropic, with option for up to $9bn m
SPY Is Back Above 770.09 On Day Three Of The Long.SPY Is Back Above 770.09 On Day Three Of The Long.
SPY is at 770.69 in premarket, back above 770.09, the shelf it lost Wednesday, after two sessions that tested the long and closed above its 764.76 line both times. Both timeframes now carry a long thesis, but conviction is running against a structure that is still bearish, so this reads as recovery, not strength. Durable goods orders land before the open; the regular-session close is still the only test. The long stands on its original terms an
Going over the QQQ and the green list new positions!In this video I'm giving my areas of support and resistance on the QQQ and my insights as to where I would personally look to re enter to go long again. Also from there we go over the green list here in the channel with subscribers. I took some profits off the table and also I started some new positions here with us. This is not financial advice folks
BLACKROCK BTC ETF, bullish reversal signalsBitcoin technical analysis does not necessarily have to be limited to observing the spot price alone. To identify the different stages of a potential trend reversal, it can be particularly useful to compare BTC/USD with the two main markets used to track institutional exposure to bitcoin: the CME futures contract and BlackRock’s Bitcoin ETF, whose ticker is IBIT.
This approach makes it possible to determine whether the signals observed on the spot market are also visible on the instruments favo
$SPY & $SPX — Levels for Friday, September 25, 2026🔮 AMEX:SPY & SPCFD:SPX — Levels for Friday, September 25, 2026
📊 Key U.S. Economic Data (ET)
10:00 AM | Revised UoM Consumer Sentiment | Forecast: 47.4 | Previous: 47.8
10:00 AM | Revised UoM Inflation Expectations | Previous: 4.6%
⚠️ For informational purposes only. Not financial advice.
📌 #ConsumerSentiment #InflationExpectations
GLD Daily: Double Bottom Forming at 388 Support on a Low-Volume Context
Choppy price action in gold again today. A small doji candle on low volume printed at the 388 support, and a double bottom pattern is now forming. Nothing interesting in the volumes.
Key levels
Support: 388
Resistance range: 395–400
Trigger: 400
What the chart shows
A doji is indecision: buyers and sellers finishing the day in the same place. On its own it tells you very little. What gives it meaning is where it appears and what volume it appears on.
Sitting at support on light volume
QQQ 1H: Gap Down Faded to 735 After PDL Rejection, PDH Now the KContext
Yesterday's summary had the bias as short below PDL. Today played out the same way: QQQ opened with a gap down and faded to the 735 level. The next area in focus was a 732–730 test, but the US–Iran deal news came out and changed the tape.
Key levels
735: today's fade level
732–730: downside test area
PDL: short trigger used today
PDH: the level that now decides direction
ATH: upside target if PDH holds as support
What the chart shows
Price rejected PDL with a 1h MTF rejection, confirmi
SPY: 34 EMA Bounce and 5/12 Curl After Gap Down Fade, PDH and 76Context
SPY opened with a gap down and faded, then popped on the US–Iran news. The reversal came right off a key moving average.
Key levels
34 EMA: bounce level
PDH: bullish bias trigger
765: bearish trigger
What the chart shows
Price bounced from the 34 EMA and printed the 5/12 curl, showing the short-term trend turning back up after the fade. The US–Iran news was the catalyst that shifted sentiment from the gap down.
Scenarios
Bullish case: Acceptance over PDH keeps the bullish bias in play
IGF: Bullish Harmonic Setup at a Key Infrastructure LevelIGF is sitting at an interesting level where a Bullish Harmonic Bat is developing on the daily chart. Price has sold off into the potential reversal area, and the setup becomes particularly interesting given the long-term infrastructure theme behind the ETF.
Trade Setup
Entry: $61.50
Stop Loss: $60.50
TP1: $64.60
TP2: $66.50
TP3: $68.50
TP4: $72.50
The $61.50 area is the key level I want to see hold. If IGF can stabilize here and begin pushing higher, the bullish setup starts to gain confirma
Your moving average didn’t change settings. So why did it move?Your moving average didn’t change settings. So why did it move?
You switch from a daily chart to an hourly chart. The moving-average length still says 20, but the line looks different.
The setting stayed the same. The data behind it changed.
Welcome back to Investrade Chart Basics: one concept, one thing to try.
20 periods of what?
A 20-period simple moving average using Close averages the closing prices of the latest 20 bars.
On a daily chart, those are 20 daily closes. On an hourly cha
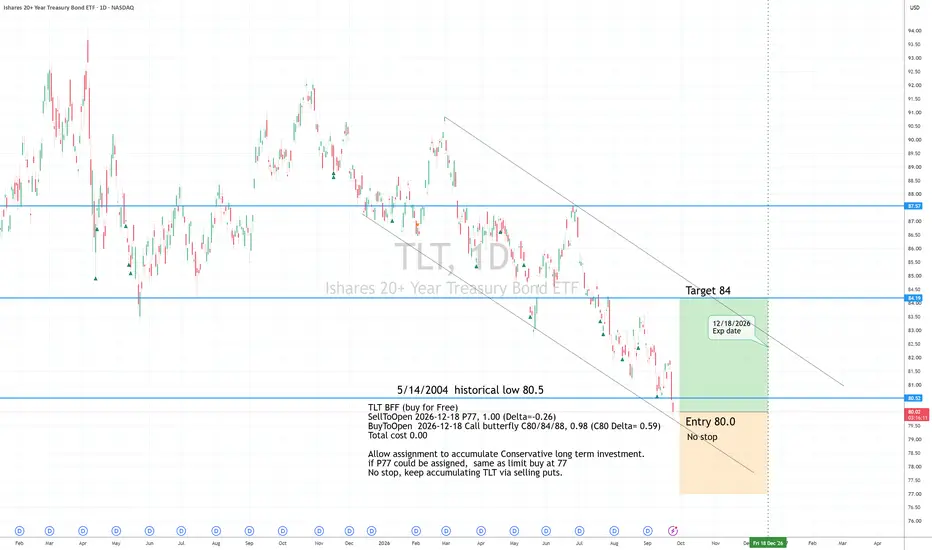
TLT LongAround Historical Low.
Entry 80.0
no Stop
Target 84
Risk management is much more important than a good entry point.
I am not a PRO trader. About 25% of my trades had been stopped quickly.
TLT BFF (buy for Free)
SellToOpen 2026-12-18 P77, 1.00 (Delta=-0.26)
BuyToOpen 2026-12-18 Call butterfly C80/84/88, 0.98 (C80 Delta= 0.59)
Total cost 0.00
Allow assignment to accumulate Conservative long term investment.
if P77 could be assigned, same as limit buy at 77.
No stop, keep
Is it finally time to short semiconductors? I think soIf we look at the chart here, we can see that we've now formed a higher low.
If we can break above $48.50 that should start the move higher. If price can decisively break the $63 range, then it's pretty much clear skies up to the top resistance area for a potential 10x from these levels.
Note: This is a 3x leveraged ETF so it's risky to trade if you don't know what you're doing.
Look for a clean breakout first.
Research 24.09.2026🌏 Markets:
AMEX:SPY -4.26 -0.56%(pre/m)
NASDAQ:QQQ -7.60 -1.03%(pre/m)
🆕 Economic News:
Wall St futures fall on Middle East uncertainties ahead of Trump-Xi talks
08:00 USA – Fed Barkin Speech
08:30 USA – Initial Jobless Claims
10:00 USA – New Home Sales
10:10 USA – Fed Paulson Speech
20:00 USA – UN General Assembly
📈 Gap Ups
Reaction to earnings/guidance:
NYSE:BB
Other news:
$P said revenue growth would accelerate due to hyperscaler business opportunities
SPY Is Trading Under 764.76 - Today's Close Decides The Long.SPY Is Trading Under 764.76 - Today's Close Decides The Long.
The long taken Wednesday on the reclaim of 765.52 is under pressure. SPY is at 763.21 in premarket, below the 764.76 level that ends it. That level is judged on the regular-session close, not on a premarket print, so the long stands until 4 PM ET. A close below 764.76 today takes it off and returns the read to Neutral. The surface is not supporting it: the 4H structure has turned bearish, conviction is middling on both timeframes, an
Buy Limit executed with phases using multi-timeframe confluenceI used multiple time frames to find trend, structure, phases and key levels. I made sure to look for confluence before finding my zones on a lower time frame. I found my second target on my intermediate time frame. I set a Buy Limit Order with two targets and a Stop Loss. The details are screen shots on my phone because I do not know how to publish such details yet...
Thanks for looking,
-Reese
GLD Analysis: Gold Breaks 395 on Low Volume, Gap Down Fade in PlCONTEXT
For the last 5-6 days, 400 has been the key level on GLD:
- Long over 400
- Choppy between 395-400
- Bearish under 395
The market has now broken 395.
For CFDs, search XAUUSD. For futures, GC1!
KEY LEVELS
- 400: key level
- 395: breakdown level now being watched
- Downside targets: 390, 385, 382
WHAT THE CHART SHOWS
The break of 395 came with average volume much lower, less than 30%. Volume is not supporting the trend. For today's session, the setups on watch were a Gap Down Fade or a
SPY Daily: Bouncing From 5/12 EMA, 766.5 Low Is the Level
SPY's Sept 23 session went up, then choppy, then down. Banks are the reason SPY is much weaker than QQQ.
KEY LEVELS
- Sept 23 low: 766.5
- Downside targets below it: 762 and 760
WHAT THE CHART SHOWS
The down move came on volume 32% higher than average: 54M vs 41.5M. On the daily chart, price is bouncing from the 5/12 EMA, which makes the 766.5 low the big level to watch.
SCENARIOS
Bullish case: If 766.5 holds, I will look for a long on smaller timeframe curls.
Bearish case: If 766.5 breaks,
QQQ Analysis: Profit Taking After ATH Test, PDL Decides Sept 24After testing the all-time high, QQQ's move in the Sept 23 session reads as profit taking. That was the expected reaction at the ATH, and it puts the previous day low (PDL) in focus for Sept 24.
KEY LEVELS
- PDL (Sept 23 low):
- All-time high:
- Levels below the PDL: 734, 732, 730
WHAT THE CHART SHOWS
Price tested the ATH and pulled back. That pullback looks like profit taking at a major level, not a confirmed reversal yet. The PDL is the line between a normal pullback and a deeper move.
$DRAM: Tight Supply, Trigger at 62CBOE:DRAM has held a higher-low structure since late July. Price is above the 57.69-58.31 AVWAP cluster (anchored to the April low and June high) and testing VAH near 62. RSI is printing a matching higher low.
Trigger: Volume-backed daily acceptance above 62, opening the path to 68.69-71.33 Primary Supply.
Overhead: 77.70-81.34 Major Supply.
Extension: 95.75-103.27, the 1.272-1.414 extension of the April-June swing; only active above 81.34.
Profile: POC 55 / VAL 48
Invalidation: Daily close bel
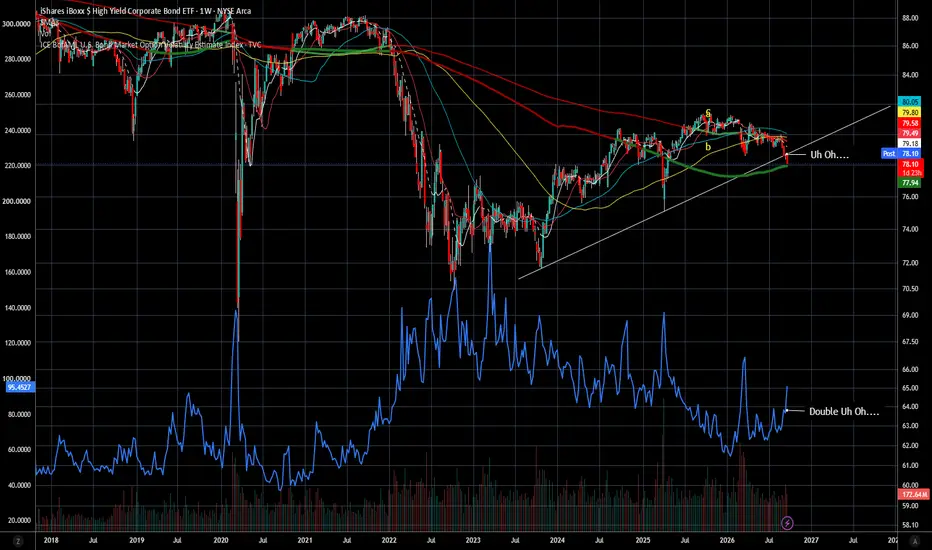
Risk OFFPain is here and more pain is in the forecast.
The MOVE index Exploded upward today, indicating large bond market volatility. This mirrors (inversely) the sell-off seen in HYG.
Fun Fact: Cannabis stocks were surprisingly resilient today. Trulieve and MSOS were actually green today while the broader market was selling off with bonds. I'm still expecting a recommendation from the judge on reclassification to come soon. This sector could be a place to hide. It is extremely undervalued in my opin