Short
Short
Short 
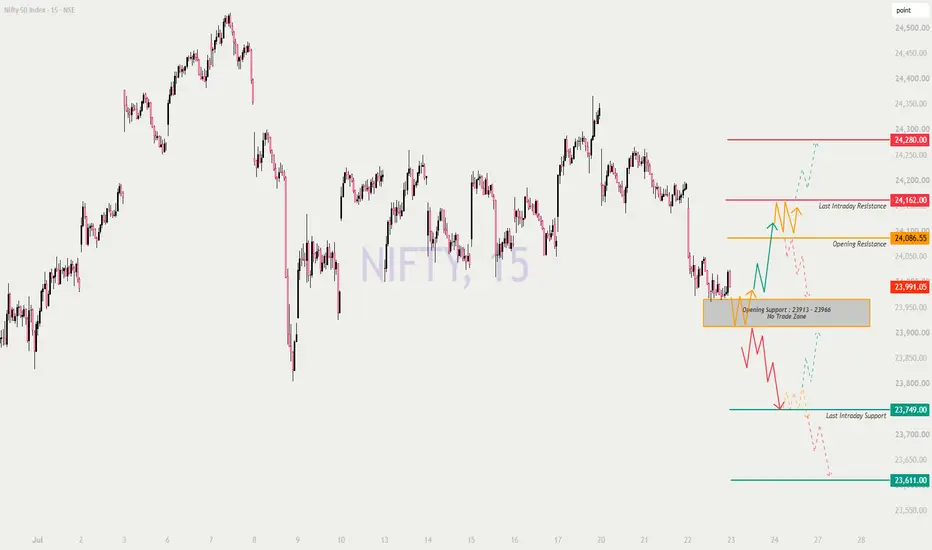
Nifty : Trading Plan: 23-Jul-2026 (Sensex Expiry Day Special)Welcome traders! 👋 Today is a crucial day as we are in the Weekly Expiry session (Thursday). Volatility (Gamma) and Time Decay (Theta) will be at their peak. Here is a detailed, professional trading plan for Nifty 50 based on the 15-minute chart structure.
🎨 Chart Legend & Color Code
Orange Line/Box: No Trade Zone / Sideways Market / Caution Area (Option Sellers' Paradise).
🟢 Green Line: Bullish Zone / Support / Long Side.
Red Line: Bearish Zone / Resistance / Short Side.
⚪ Dashed Line: Probable Trend (Maybe/Maybe Not) – Wait for candle confirmation!
📈 Overall Nifty Trend (Intraday & Expiry Context)
Looking at the chart, Nifty is currently trading around 23,991.
Trend: The market is attempting a recovery but is facing immediate resistance.
Expiry Factor: Since today is the weekly expiry, we expect sharp moves. The market often tries to pin the price near the "Max Pain" level.
Key Battle: The zone between 23,913 (bottom of No Trade Zone) and 24,086 (Opening Resistance) is the immediate battleground.
Current Status: Price (23,991) is hovering just above the No Trade Zone (23,913 - 23,966).
🚀 Scenario 1: Gap Up Opening (100+ Points)
(Expected Open: ~24,090 - 24,100)
If the market gaps up by 100+ points, it will open right at or above the Opening Resistance (24,086.55).
🔍 Analysis: A gap up here is a strong bullish signal, breaking the immediate orange resistance line. However, on expiry day, profit booking can happen instantly at the next red line.
🟢 Bullish Action (Long): If the price sustains above 24,086 for the first 15 minutes, look for a move towards 24,162 (Last Intraday Resistance). A breakout of 24,162 opens the door to 24,280 (following the green dashed line).
🔴 Bearish Action (Short): If the price gaps up but immediately faces selling pressure at 24,086 - 24,100 (forming a bearish candle), it's a "Sell on Rise" opportunity. Target a fall back to 23,991 or the top of the No Trade Zone.
⚠️ No Trade: Avoid buying ATM/OTM calls right at the open if the price is stuck between 24,086 and 24,162.
⚖️ Scenario 2: Flat Opening
(Expected Open: ~23,980 - 24,010)
If the market opens flat, it opens right around the current price (23,991), just above the No Trade Zone (23,913 - 23,966).
** Analysis**: This is the most tricky scenario for Option Buyers. The market is likely to oscillate between 23,913 and 24,086.
🟠 No Trade Zone: The box 23,913 - 23,966 is your "Sideways" area. If the market enters this box, Option Buyers will suffer heavy Theta decay. Stay out!
🟢 Bullish Action (Long): Wait for a strong breakout above 24,086 (Orange Line). Once confirmed, go Long with a target of 24,162.
🔴 Bearish Action (Short): Wait for a breakdown below 23,913 (bottom of the Orange Box). Once confirmed, go Short with a target of 23,749 (Green Line).
⚪ Dashed Line Logic: The chart shows a red dashed line dropping from here and a green solid line rising. The market is at a crossroads. Let the price pick a side!
📉 Scenario 3: Gap Down Opening (100+ Points)
(Expected Open: ~23,890)
If the market gaps down significantly, it opens below the No Trade Zone (23,913 - 23,966) and heads straight towards the Last Intraday Support (23,749).
** Analysis**: This is a bearish continuation. The support at 23,913 has failed.
🔴 Bearish Action (Short): If the price opens below 23,900 and stays there, initiate a Short position. The immediate target is 23,749. If that breaks, look at 23,611 (following the red dashed line).
🟢 Bullish Action (Long): Only look for a "Dead Cat Bounce" or reversal if the price hits 23,749 and shows strong buying interest (Hammer candle). Target a recovery to 23,913.
⚠️ Caution: In a gap down on expiry day, panic selling can be intense. Don't catch the falling knife; wait for stabilization at the green support line.
🛡️ Risk Management Tips for Options Trading (Expiry Special) 🧠
Since today is weekly expiry, the rules change slightly:
🔹 Beware of Theta Decay: If the market is flat (Scenario 2), Option premiums will melt like ice cream. Option buyers should avoid holding positions for too long in the sideways zone.
🔹 Stop Loss is God: In expiry moves, spikes can be sharp. Always use a system SL. Don't rely on "hope".
🔹 Position Sizing: Volatility can double or halve premiums quickly. Trade with smaller quantities than usual to manage the psychological stress.
🔹 Hero-Zero Trades: If you are trading cheap OTM options (0.50 - 1.00) in the afternoon session, treat it as a lottery ticket. Only use money you are okay losing completely.
🔹 Trail Aggressively: If you are in profit, move your SL to cost immediately. Expiry moves can reverse in minutes.
📝 Summary & Conclusion
To summarize the plan for 23-Jul-2026 (Expiry Day):
Trend: Neutral to Bullish if above 24,086. Bearish if below 23,913.
Gap Up: Bullish above 24,086. Target 24,162 then 24,280.
Flat: NO TRADE in the 23,913 - 23,966 zone. Wait for breakout/breakdown.
Gap Down: Bearish below 23,913. Target 23,749.
Conclusion: The chart highlights a critical "No Trade Zone" (Orange Box) at 23,913 - 23,966. As an educational takeaway: Don't trade in the chop! Let the market break out of the orange box or the orange line (24,086) to give you a clear direction (Green or Red). The dashed lines remind us that until a level is broken, the trend is uncertain. Stay disciplined! 📈
⚠️ Disclaimer:
I am not a SEBI registered analyst. This post is for educational purposes only. Trading in the stock market and F&O; involves high risk and can lead to capital loss. Please consult your financial advisor before taking any trades. The charts and levels are based on technical analysis and probabilities, not guarantees. Long 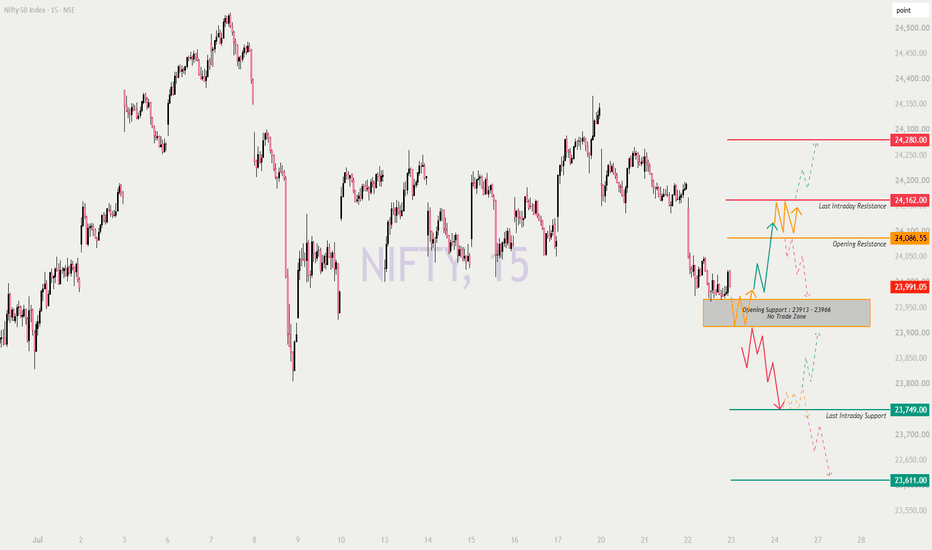
US30: Trendline Breakout & Bearish Structural ShiftUS30: Trendline Breakout & Bearish Structural Shift 📉
Description:
The Dow Jones Industrial Average (US30) has broken below a key multi-touch ascending trendline on the 2-hour timeframe, signaling a significant shift in the bullish structure. This breakdown suggests that the previous momentum is exhausted, and the market is now transitioning into a corrective phase. We are monitoring the price as it reacts to this trendline violation, with the focus on potential downward moves toward the established support zones.
Key Structural Levels:
🔴 Major Resistance / Invalidation Zone: 52,600 – 52,700
📉 Current Reaction Level: 52,246
🔵 1st Support Objective: 51,894
🔵 2nd Support Objective: 51,292
Trading Perspective:
We are looking for bearish follow-through following the trendline breakdown. A sustained move below this level confirms the change in market sentiment. Traders should watch for a "retest" of the broken trendline as a potential area to confirm the downward bias. If the price fails to stay below this trendline, the bearish outlook will need to be reassessed.
This analysis is based on technical structure and market behavior, not financial advice. SENSEX – DETAILED TRADING PLAN FOR 23-JUL-2026⚡ SENSEX WEEKLY EXPIRY DAY — TRADE WITH EXTRA CAUTION ⚡
Previous Close: 76,744.86 | Timeframe: 15 Min | Index: S&P BSE SENSEX
Namaste Traders! 🙏 Today is the Sensex Weekly Expiry session — expect sharper intraday swings, quick reversals, and aggressive premium decay as the day progresses. Below is a complete educational trading plan covering the overall trend structure and all three opening scenarios (with 300+ point gap consideration). Trade the levels, not your emotions. Let's begin! 👇
🧭 OVERALL SENSEX TREND STRUCTURE FOR THE DAY
⦿ Upside Structure: 77,089 (Opening Resistance) → 77,367–77,461 (Last Intraday Resistance) → 77,931 (Extended Target)
⦿ Downside Structure: 76,627–76,818 (No-Trade / Opening Support Zone) → 76,002 (Extended Support Target)
⦿ No-Trade / Balance Zone: 76,627–76,818 → marked in gray box on chart — this is where price is likely to chop before choosing direction. Avoid fresh trades here.
⦿ Chart Color Code Reminder:
⦿ 🟢 Green solid/dashed = Bullish/Long bias (dashed = unconfirmed, wait for candle close)
⦿ 🔴 Red solid/dashed = Bearish/Short bias (dashed = unconfirmed, wait for candle close)
⦿ 🟠 Orange solid/dashed = No-trade / Sideways / Uncertain zone — avoid fresh directional bets here
⚠️ Expiry Day Note: With a 300+ point gap consideration today, moves are likely to be sharp and momentum-driven right from the open. Expiry day price action tends to gravitate towards Max Pain/high-OI strikes as the session progresses — don't fight the pin, trade the structure. 🕰️
🟢 SCENARIO 1: GAP UP OPENING (300+ points, i.e., Open above 77,045)
A gap-up opening of 300+ points on expiry day reflects a strong overnight trigger (global cues/FII flows). Such large gaps often see either strong follow-through or sharp fade — the first 15-min candle close is critical.
⦿ Immediate Resistance Zone: 77,367–77,461 (Last Intraday Resistance)
⦿ Next Target Zone (if trend sustains): 77,931
⦿ Key Support on Pullback: 77,089 (Opening Resistance, now flips to support)
📌 Plan of Action:
⦿ If Sensex opens above 77,045 and holds with a 15-min candle close above 77,367, this confirms bullish continuation → Look for Call buying (CE) on shallow dips towards 77,367–77,400, SL below 77,300.
⦿ If price gaps up but gets rejected at 77,367–77,461 zone, avoid chasing — wait for a retracement into 77,089 zone for a fresh, low-risk entry with confirmation.
⦿ If the gap-up fails to hold above 77,089 and slips back towards the No-Trade Zone, treat it as a gap-fill scenario — book any long profits quickly and shift to a neutral stance.
⦿ On expiry day with such a large gap, avoid holding aggressive CE positions into the last hour if price stalls near resistance — theta decay and pinning risk increase sharply post 2:30 PM. ⏳
🟠 SCENARIO 2: FLAT OPENING (Within ±300 points of 76,744.86, i.e., between 76,445 – 77,045)
Flat openings on expiry day are common as market makers often keep price anchored near high-OI strikes early in the session. The 76,627–76,818 zone is a marked No-Trade Zone — respect it strictly.
⦿ Key Resistance Zone: 77,089 (Opening Resistance)
⦿ Key Support Zone: 76,627–76,818 (No-Trade / Opening Support Zone)
⦿ Expected Range (base case): 76,627 – 77,089
📌 Plan of Action:
⦿ If Sensex opens flat and stays within 76,627–77,089, this is a strict no-trade / sideways zone — best suited for premium selling strategies (Iron Condor/Credit Spreads) rather than naked option buying, since expiry day theta will punish directionless buying. 🧘
⦿ A confirmed breakout above 77,089 (candle close + follow-through) opens the path to 77,367 → 77,931. Enter CE only after confirmation, SL below 77,000.
⦿ A confirmed breakdown below 76,627 opens downside towards 76,002. Enter PE only after candle close below 76,627, SL above 76,818.
⦿ Since this is expiry day, expect false breakouts near the No-Trade Zone — wait for a strong follow-through candle with volume, not just a single close outside the range. 🎯
🔴 SCENARIO 3: GAP DOWN OPENING (300+ points, i.e., Open below 76,445)
A gap-down opening of 300+ points on expiry reflects strong negative overnight sentiment and can trigger fast PE writing unwinding, leading to sharp initial downside moves. Avoid shorting blindly at the open.
⦿ Immediate Support Zone: 76,002 (Extended Support Target)
⦿ Key Resistance for Pullback: 76,627–76,818 (No-Trade Zone flip)
⦿ Deeper Downside (if broken): Watch for further extension below 76,002 with trailing SL
📌 Plan of Action:
⦿ If Sensex opens below 76,445 and continues below 76,627 with a sustained 15-min close, this confirms bearish continuation → Look for Put buying (PE) on pullback towards 76,627–76,700, SL above 76,750.
⦿ If price holds near 76,002 and forms reversal candles (hammer/bullish engulfing), avoid fresh shorts — a bounce towards 76,627 becomes likely. This is a counter-trend trade, suitable only for experienced traders with tight SL.
⦿ If the gap-down recovers quickly and reclaims 76,818, treat it as a gap-fill/reversal day — shift bias to neutral and track 77,089 as the next resistance hurdle.
⦿ On expiry day, sharp V-shaped recoveries are common due to short covering — never hold naked PE positions without SL once price shows reversal signs near support. ⚠️
🎯 RISK MANAGEMENT TIPS FOR OPTIONS TRADING (EXPIRY DAY SPECIAL)
⦿ Risk only 1-2% of total capital per trade — with a 300+ point gap, expiry day volatility can swing premiums drastically within minutes. 🛡️
⦿ Always trade with a predefined Stop Loss — never average a losing options position on expiry day hoping for reversal.
⦿ Avoid buying far OTM options on expiry — theta decay accelerates hour by hour, and most OTM premiums decay to zero by close.
⦿ Stay out of the No-Trade Zone (76,627–76,818) — this is where premium sellers benefit and option buyers bleed via decay.
⦿ Practice partial profit booking — on expiry day, book profits fast; don't get greedy waiting for the "perfect" target.
⦿ Track India VIX and Max Pain levels — price often gravitates towards Max Pain by end of session, especially after a big gap opening.
⦿ Avoid fresh option buying trades in the last 45–60 minutes of expiry — this period is dominated by unpredictable pinning action and rapid premium decay.
⦿ With a 300+ point gap, be extra cautious of a gap-fill move in either direction — don't assume the gap direction will hold without confirmation.
⦿ If writing options (experienced traders only), use hedged strategies (spreads) rather than naked writing to protect against sudden volatility spikes.
⦿ Always align options trades with confirmed price action on the underlying — expiry day, especially with large gaps, is not the day for guesswork.
📝 SUMMARY & CONCLUSION
Today's session (22-Jul-2026) — being a Sensex Weekly Expiry with a 300+ point gap consideration — demands extra discipline and structure-based trading. The framework is clearly defined: 76,627–76,818 (No-Trade Zone) sits at the center, with 77,089 and 77,367–77,461 marking upside resistance levels extending to 77,931, while 76,002 marks the key downside support target.
⦿ Gap Up (300+): Bullish bias sustains above 77,367, with extended target at 77,931.
⦿ Flat Opening: Expect range-bound chop between 76,627–77,089 — avoid directional buying, prefer spreads.
⦿ Gap Down (300+): Bearish bias sustains below 76,627, with extended target at 76,002.
Across all scenarios, respect the No-Trade Zone, wait for confirmed candle closes at key levels, and stay alert to expiry-day theta decay and last-hour pinning action. With such a large potential gap, gap-fill risk is elevated in both directions — never assume, always confirm. Dashed lines (green/red) represent "maybe" trend zones requiring extra confirmation, while solid lines represent higher-conviction levels.
On expiry day, capital protection matters more than chasing the "big move." Plan your trade, trade your plan, book profits early, and never let greed override your stop loss. 📈📉
⚠️ DISCLAIMER
I am not a SEBI registered analyst. This post is shared purely for educational purposes and represents a personal technical view for learning chart-reading and risk management concepts. It should not be construed as investment or trading advice. Please consult a qualified financial advisor and conduct your own research before making any trading or investment decisions. Trading in equity/options, especially on expiry days with large gap openings, carries substantial risk of financial loss. 🙏 Long 
Short 
Sensex Expiry | Price Analysis | Bulls Vs BearsHere's an analysis of the BSE SENSEX on the 15m timeframe
Bottom line
The 15m chart for SENSEX indicates a cautious-to-neutral bias, with the index trading below key moving averages and exhibiting a downtrend structure.
Structure & trend
The SENSEX is currently trading at 76,789.6, below both its 15m SMA20 (76,833.7) and SMA50 (77,175.8).
The price action shows a pattern of lower highs and lower lows, confirming a short-term downtrend.
Momentum, as indicated by the RSI14 at 43.7, is in neutral-negative territory, supporting the cautious outlook.
Key levels
Nearest intraday support is observed around 76,787.9, with a stronger floor at 76,623.4.
Immediate resistance is at 76,976.4, followed by 77,190.4.
The recent 100-bar window shows a range between 76,082.5 and 77,803.2.
What to watch
A sustained move and close above the immediate resistance of 76,976.4, especially on increasing volume, would be needed to shift the current negative bias.
Conversely, a break and hold below the 76,623.4 support level would open up further downside towards the lower end of the recent range.
The intraday model shows a neutral direction with no confidence, suggesting a lack of strong conviction in either direction currently. NIFTY 50: Range Breakout Setup for Tomorrow (22 July)After spending the last two trading sessions (20-21 July) inside a narrow consolidation, NIFTY 50 is approaching a decision point. The market has respected both the upper and lower boundaries of this range multiple times, suggesting that the next directional move could come only after a decisive breakout.
The key is patience—let the market confirm the direction before taking a trade.
Key Levels to Watch
🔴 Major Resistance: 24,367 (High of 17th July)
🟢 Major Support: 24,099 (Low of 17th July)
🟨 Current Consolidation Range: 24,150 - 24,260
Bullish Scenario 📈
A sustained breakout above 24,260 with strong participation could trigger fresh buying momentum.
Entry: Above 24,260 after a confirmed candle close.
Stop Loss: Below 24,200 (back inside the range).
Target 1: 24,367 (High of 17th July)
A successful move above 24,367 may open the door for further upside, but the first objective remains this key resistance.
Bearish Scenario 📉
If price breaks and closes below 24,150, it would indicate that sellers have gained control of the range.
Entry: Below 24,150 after confirmation.
Stop Loss: Above 24,200.
Target 1: 24,099 (Low of 17th July)
A breakdown below 24,099 could accelerate selling pressure.
Why This Setup Matters
Markets often build energy during tight consolidations. Once price escapes a well-defined range, traders caught on the wrong side rush to exit while breakout traders enter, creating a stronger follow-through move.
Rather than predicting direction, the focus is on reacting to the breakout.
Trading Plan
✅ Wait for a candle to close outside the range.
✅ Avoid taking trades inside the consolidation.
✅ Let price confirm the direction before entering.
✅ Respect your stop loss and manage position size.
Educational purpose only. Not financial advice. Always trade with proper risk management. NIFTY: Will 24,050 Trigger a Recovery or Extend the Correction?Yesterday, I maintained a positive bias above 24,200 and a negative bias below it. NIFTY failed to reclaim 24,200 throughout the session, and sellers retained control. The bearish view played out as expected, making 24,200 a confirmed resistance in the short term.
Today's View
With yesterday's resistance established, today's focus shifts to 24,050 and 23,800.
The market is entering the session with a cautious setup. The short-term trend remains under pressure, but the next directional move will depend on how price behaves around these two levels.
I'll be looking at whether today's technicals and derivatives continue to support the bearish structure or begin to show signs of a reversal. If momentum strengthens, price starts trading back above key short-term averages, and option positioning shifts in favour of buyers, the current bearish view will begin to weaken.
For now, 24,050 is the first level buyers need to reclaim. A sustained move above it would indicate that yesterday's selling pressure is fading and improve the chances of a recovery.
On the downside, 23,800 is the key support. If sellers push the index below this level, it would strengthen the current bearish structure and suggest the correction has further to run.
Key Levels
Above 24,050: Short-term sentiment turns positive.
Between 24,050 and 23,800: Expect consolidation with a cautious bias.
Below 23,800: Bearish momentum strengthens, increasing the probability of further downside. Short 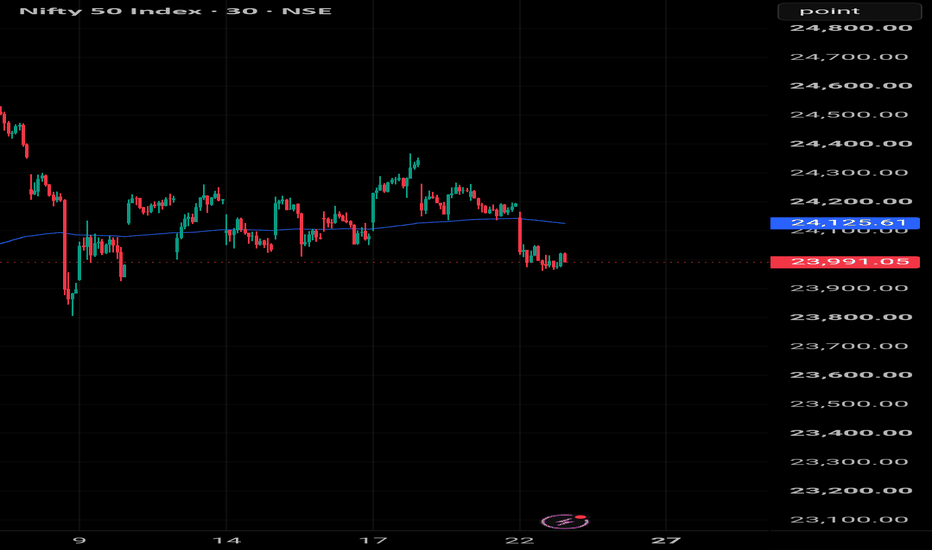
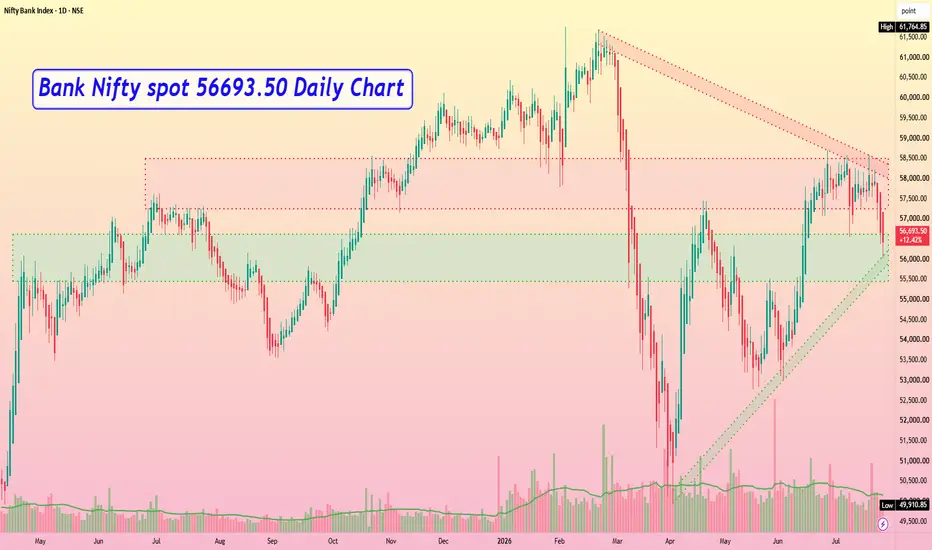
The Ugly Rounded Top - What's Next in Nifty Bank Index?For the past 2 months, the Nifty Bank Index NSE:BANKNIFTY has been trading in the same range. The range of consolidation has been in the zone (58500 - 57000) . Directional trading has been a nightmare for directional traders. High-level range-bound volatility has been the new trend of Nifty Bank.
Multiple reasons have triggered a range-bound movement for such a long time. A few reasons might be - Iran-U.S. War, Crude Oil Price uncertainty, Energy Crisis, and inherent fundamental problems in the banking sector. Nobody can exactly comprehend all the reasons behind such an erratic range-bound movement. However, charts offer an easy look at the probable future of the instrument.
Let us not get into the fundamental and systematic errors in the instrument. We will primarily focus on the chart and the structure it has been building for such a long time.
Chart Pattern: "The Rounded Top"
The choppy market in the range of (58500 - 57000) has formed a famous trend reversal technical pattern - The Rounded Top. A rounding top pattern is an inverted "U" chart formation signaling a possible trend reversal after an extended uptrend. We have traded in the extended uptrend (bullish momentum) since 08th of June 2026. However, the bullish momentum had begun to wane by the end of the month. The month of July 2026 has been horrible for directional traders. The index was badly consolidating in the range (58500 - 57000). Most importantly, the range-bound consolidation has trapped both the bears and bulls. This is the very nature of a perfect "Rounded Top" chart pattern. However, we never know whether the consolidation is an accumulation process or a distribution process. A deeper look at the chart clearly shows that the price has sometimes formed a double-top pattern as it has revisited previous highs and encountered resistance again.
Rounded Top Consolidation Zone: (58500 - 57000).
Here, level 57000 is the neckline of the rounded top pattern . The total point range of the range-bound consolidation is 1500 points. As per classical technical analysis, if the neckline is broken, then we can expect at least 1500 points downward fall. Here, only a genuine fall will do justice to the sideways consolidation.
Strong Resistance Zone (SRZ): (58000 - 57500).
Presently, Nifty Bank has formed a strong resistance area in the zone of (58000 - 57500). It is highly recommended not to even think about bullish trades unless the price decisively breaks out above the zone (58000 - 57500). In the present scenario, every up move should be doubted.
Hypothesis: Nifty Bank Index will Go Down to 55250
As per the understanding of the present price action, it is evident that bullish sentiments are near to getting exhausted and bears are getting in charge. Since every up move will be doubted, there is a high chance that there will be at least a 1500-point fall below 57000. That is, it is estimated that Nifty Bank might gravitate down to 55500. Furthermore, it is estimated that Nifty Bank will go down further to the level of 55250. The reason being an availability of an unfilled GAP near the region of 55250.
⏺ Probable Scenario Analysis 👇
🟢 Bullish Scenario
There is no observable bullish scenario. Doubt every up move. In fact, an up move will act as an opportunity to short the market. However, if the price breaks out above 58000, then a weak bullish move can be expected. The probable weak bullish targets above 58000 would be - 58500 and 59000.
🔴 Bearish Scenario
Presently, the price is in a bearish phase. Stay bearish if the price remains below 57000. The probable bearish targets below 57000 would be - 56500, 55500, and 55000.
🟡 No Trading Zone (NTZ): (58000 - 57000).
Here, the zone (58000 - 57500) is a super strong resistance. It is very difficult for the price to break out above this zone.
● Intraday, Weekly, and Monthly Bias
Establish bias with respect to the opening price (of the particular session - Intraday, Weekly, and Monthly). If the price sustains above the opening price, then don't think of shorting. Look for bullish trades only. On the contrary, if the price sustains below the opening price, then don't think of going long. Look for bearish trades in that case.
● Disclaimer + End Note
- All the analyses would fail in the case of a major gap up, gap down, or price structure anomaly. Thus, practice PRAGMATISM in the live session.
- Trade only if there is a set-up. Remember, not trading is an extension of the trading activity.
- Mark your points. Trade your points. Price is GOD. Anything can happen in the markets. Thus, trade what you see, not what you believe.
- Always PRACTICE RISK MANAGEMENT. Always PROTECT YOUR CAPITAL. Be RESPONSIBLE.
- Be Strategic. Be Courageous. Be Patient. Be Wise.
- Every day is a new day. Thus, do not carry the baggage of past successes or failures. Leave the gardens of winning and losing. Establish yourself in equanimity. Always think from a new perspective.
- Let the joy of trading drive your effectiveness, not greed or fear. Believe in Possibilities.
Happy Trading!  Short
Short
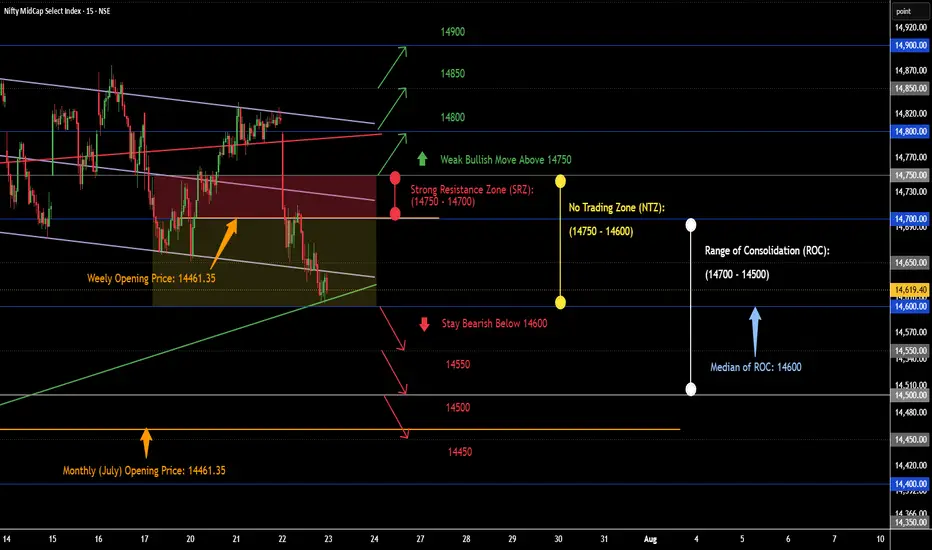
Nifty MidCap Select Trade Plan [23.07.2026: Thursday]Probable Scenario Analysis and Trade Plan for the Nifty MidCap Select Index NSE:NIFTY_MID_SELECT for the 23rd of July, 2026. The day is Thursday.
🟢 Bullish Scenario
There is no observable bullish setup. Doubt every up move. In fact, an up move will act as an opportunity to short the market. However, if the price breaks out above 14750, then a weak bullish move can be expected. The probable weak bullish targets above 14750 would be - 14800, 14850, and 14900.
🔴 Bearish Scenario
Presently, the price is in a bearish phase. Stay bearish if the price remains below 14600. The probable bearish targets below 14600 would be - 14550 and 14500. The price would receive strong support at 14500. Next, if the price decisively breaks down below 14500, then the probable bearish targets would be - 14450. The price would receive good support at 14450 as there is an unfilled gap and the monthly (July) opening price at 14461.35. Thus, it can be estimated that the price would receive support clustered in the zone of 14450.
🟡 No Trading Zone (NTZ): (14750 - 14600).
Here, the zone (14750 - 14700) is a super strong resistance. It is very difficult for the price to break out above this zone.
⏺ Range of Consolidation (ROC): (14700 - 14500).
Here, 14600 is the median of the ROC. The median works like an intraday sentiment evaluator. The price trading above the median would offer bullish sentiment, while the price trading below the median would trigger bearish sentiment within the ROC.
● Event
No high-impact event this week. One medium-impact event is the Euro Interest Rate Decision on 23rd July (Thursday). No holidays this week. There is a SENSEX weekly expiry. Lastly, geopolitical issues are omnipresent.
● Intraday, Weekly, and Monthly Bias
Establish bias with respect to the opening price (of the particular session - Intraday, Weekly, and Monthly). If the price sustains above the opening price, then don't think of shorting. Look for bullish trades only. On the contrary, if the price sustains below the opening price, then don't think of going long. Look for bearish trades in that case.
● Disclaimer + End Note
- All the analyses would fail in the case of a major gap up, gap down, or price structure anomaly. Thus, practice PRAGMATISM in the live session.
- Trade only if there is a set-up. Remember, not trading is an extension of the trading activity.
- Mark your points. Trade your points. Price is GOD. Anything can happen in the markets. Thus, trade what you see, not what you believe.
- Always PRACTICE RISK MANAGEMENT. Always PROTECT YOUR CAPITAL. Be RESPONSIBLE.
- Be Strategic. Be Courageous. Be Patient. Be Wise.
- Every day is a new day. Thus, do not carry the baggage of past successes or failures. Leave the gardens of winning and losing. Establish yourself in equanimity. Always think from a new perspective.
- Let the joy of trading drive your effectiveness, not greed or fear. Believe in Possibilities.
Happy Trading! Nifty 50 Trade Plan [23.06.2026: Thursday]Probable Scenario Analysis and Trade Plan for the Nifty 50 Index NSE:NIFTY for the 23rd of July, 2026. The day is Thursday.
🟢 Bullish Scenario
There is no observable bullish setup. Doubt every up move. In fact, an up move will act as an opportunity to short the market. However, if the price breaks out above 24200, then a weak bullish move can be expected. The probable weak bullish targets above 24200 would be - 24250 and 24300. Next, if the price sustains above 24300, then the probable bullish targets would be 24350 and 24400.
🔴 Bearish Scenario
Presently, the price is in a bearish phase. Stay bearish if the price remains below 24000. The probable bearish targets below 24000 would be - 23950 and 23900. The price would receive strong support at 23900 as there is an unfilled gap and monthly opening (23897.65) in the same zone. Next, if the price decisively breaks down below 23900, then the probable bearish targets would be - 23850, 23800, and 23750.
🟡 No Trading Zone (NTZ): (24200 - 24000).
Here, the zone (24200 - 24100) is a super strong resistance. It is very difficult for the price to break out above this zone.
⏺ Range of Consolidation (ROC): (24200 - 23900).
Here, 24000 is the median of the ROC . The median works like an intraday sentiment evaluator. The price trading above the median would offer bullish sentiment, while the price trading below the median would trigger bearish sentiment within the ROC.
● Event
No high-impact event this week. One medium-impact event is the Euro Interest Rate Decision on 23rd July (Thursday). No holidays this week. There is a SENSEX weekly expiry. Lastly, geopolitical issues are omnipresent.
● Intraday, Weekly, and Monthly Bias
Establish bias with respect to the opening price (of the particular session - Intraday, Weekly, and Monthly). If the price sustains above the opening price, then don't think of shorting. Look for bullish trades only. On the contrary, if the price sustains below the opening price, then don't think of going long. Look for bearish trades in that case.
● Disclaimer + End Note
- All the analyses would fail in the case of a major gap up, gap down, or price structure anomaly. Thus, practice PRAGMATISM in the live session.
- Trade only if there is a set-up. Remember, not trading is an extension of the trading activity.
- Mark your points. Trade your points. Price is GOD. Anything can happen in the markets. Thus, trade what you see, not what you believe.
- Always PRACTICE RISK MANAGEMENT. Always PROTECT YOUR CAPITAL. Be RESPONSIBLE.
- Be Strategic. Be Courageous. Be Patient. Be Wise.
- Every day is a new day. Thus, do not carry the baggage of past successes or failures. Leave the gardens of winning and losing. Establish yourself in equanimity. Always think from a new perspective.
- Let the joy of trading drive your effectiveness, not greed or fear. Believe in Possibilities.
Happy Trading!  Long
Long
Nifty 50 Weekly Analysis [27 - 31 July, 2026]Probable Scenario Analysis and Trade Plan for the Nifty 50 Index NSE:NIFTY for the Week of 27- 31 July 2026.
🟢 Bullish Scenario
Nifty 50 is in an indecisive zone. The main trend is bearish, but there is a bounce. The zone (23900 - 23800) is a strong resistance zone (SRZ). It is difficult for the price to break out of this SRZ. However, if the price decisively sustains above the SRZ, then a weak bullish move will generate. The probable weak bullish targets above 23900 would be - 23950 and 24000. At 24000, the price will experience strong resistance. If the price starts to trade above 24000, then the price will enter into a strong bullish move. The probable strong bullish targets above 24000 would be - 24050 and 24100. Next, if the price starts to trade above 24100, then a super strong bullish move would emerge. The probable super strong bullish targets above 24100 would be - 24150, 24200, and 24250.
🔴 Bearish Scenario
Presently, the price is in the bearish to indecisive zone. A weak support zone (WSZ) is formed at (23750 - 23700). If the price decisively breaks down below the WSZ (or the 23700 level), then bearish sentiment will trigger. Weak and underconfident bearish targets below 23700 would be - 23650 and 23600. There will be weak support at 23600. Next, if the price decisively breaks down below 23600, then a strong bearish move will be triggered. The probable strong bearish targets below 23600 would be - 23550 and 23500. The price will receive strong support at 23500. Next, if the price breaks down below 23500, then super strong bearish sentiment will be triggered. The probable bearish targets below 23500 would be 23450 and 23400.
🟡 No Trading Zone (NTZ): (23900 - 23700).
Presently, the price is in the NTZ. Only a breakdown or breakout would trigger a tradable condition. If the price remains within NTZ, then avoid trading at all costs.
⏺ Range of Consolidation (ROC): (24000 - 23500).
Here, 23750 is the median of the ROC. The median works like an intraday sentiment evaluator. The price trading above the median would offer bullish sentiment, while the price trading below the median would trigger bearish sentiment within the ROC.
● Event
There are no holidays this week either in India or in the U.S. A high-impact event is on 29th of July, 2026 (Wednesday 11:30 PM IST). The high-impact event is "FED INTEREST RATE DECISION." Next, there will be 2 monthly expiries (both NSE and BSE F&O contract expiries). This will happen on Tuesday (28 July: NSE) and Thursday (30 July: BSE). This week will be a CRAZY WEEK. Thus, there are three events - Fed Interest Rate Decision, NSE F&O Contract Expiry, and BSE F&O Contract Expiry. Lastly, geopolitical issues are omnipresent. We can definitely experience major price anomalies. Therefore, trade with caution. If possible, avoid trading this week.
● Intraday, Weekly, and Monthly Bias
Establish bias with respect to the opening price (of the particular session - Intraday, Weekly, and Monthly). If the price sustains above the opening price, then don't think of shorting. Look for bullish trades only. On the contrary, if the price sustains below the opening price, then don't think of going long. Look for bearish trades in that case.
● Top-Down Analysis
- Monthly TF: The price has been trapped in the range of (24000 - 23500) for the past 5 months. The candles of the past 4 months are either DOJI or Spinning Tops. Thus, there is no trend for the past 5 months. The view is highly indecisive.
- Weekly TF: This week, the price gave a breakdown from the rounded top structure formed for the past five weeks. The present week's candle is a red bar. Strong resistance is 24000. It is recommended to take no bullish trade unless the price trades and sustains above 24000. The view is indecisive to bearish.
- Daily TF: The price is forming a Pennant pattern since Mar 2026. Level 24000 is strong resistance. Bullish sentiment can only emerge if the price sustains above 24000. Level 23500 is the last support. If the price breaks down below 23500, then there will be a sharp fall. The view is bearish to indecisive.
- 30-minute TF: The price gave a breakdown from the head and shoulder pattern. Maybe there will be a minor pullback or a dead cat bounce. The price is in a lower-lows and lower-highs structure. There is no sign of bullishness. Bullish sentiment can only emerge if the price sustains above 24000. Level 23500 is the last support. The view is indecisive to bearish.
● Disclaimer + End Note
- All the analyses would fail in the case of a major gap up, gap down, or price structure anomaly. Thus, practice PRAGMATISM in the live session.
- Trade only if there is a set-up. Remember, not trading is an extension of the trading activity.
- Mark your points. Trade your points. Price is GOD. Anything can happen in the markets. Thus, trade what you see, not what you believe.
- Always PRACTICE RISK MANAGEMENT. Always PROTECT YOUR CAPITAL. Be RESPONSIBLE.
- Be Strategic. Be Courageous. Be Patient. Be Wise.
- Every day is a new day. Thus, do not carry the baggage of past successes or failures. Leave the gardens of winning and losing. Establish yourself in equanimity. Always think from a new perspective.
- Let the joy of trading drive your effectiveness, not greed or fear. Believe in Possibilities.
Happy Trading! NIFTY 50: Q2 Macro Targets & Breakout LevelsThe chart shows Nifty trading at 24,206.90, currently consolidating inside a defined quarterly range (Q2 box) following a strong 10.91% rally in the previous sequence.
Immediate Breakout Level: 24,576.60 ("Buy Above Break Out") — This marks the key horizontal resistance and the gatekeeper to a fresh macro expansion.
Crucial Support / Midpoint: 23,394.00 (50% of Q1 High & Low) — This represents the key equilibrium level. As long as Nifty remains above this, the structural trend is firmly bullish.
Invalidation / Stop Loss (SL): 23,068.85 — A clean break below this invalidates the current quarterly bullish setup.
Upside Macro Targets:
Primary Target: 25,479.30
Target 2: 26,056.35
Integrating Macro History with Current Price Action
Your historical analysis gives us a powerful statistical edge to project the next moves:
The 4.5x Probability Edge:
1. Historically, Nifty breaks a previous candle's high (~45 times) far more often than it breaches a low (~10 times). Since we are in a dominant multi-year uptrend, statistical probability heavily favors a breakout above 24,576.60 over a breakdown below 23,068.85.
2. The "Parabolic Phase" Behavior (2021–2024):
During the recent momentum regime, pauses are shallow. The chart shows a textbook triangle consolidation within the Q2 box, which acts as a compression mechanism before the next macro leg.
Q2 Predictive Outlook & Scenarios
Given the current price of 24,206.90 sitting just under the breakout line, here is how the quarters are likely to resolve:
Scenario A: The High-Probability Macro Continuation (75% Likelihood)
Trigger: A daily/weekly close above 24,576.60.
Behavior: Utilizing the historical momentum where consecutive highs are taken out, this trigger will likely spark a quick short-covering rally toward the Primary Target of 25,479.30.
Extended Target: If the 3M candle closes near its highs, the momentum will mathematically carry over into the next quarter to test 26,056.35 (Target 2).
Scenario B: The Healthy Mean Reversion (25% Likelihood)
Behavior: If global cues flatten, Nifty might reject 24,576.60 temporarily and drift lower into the box.
The Buy Zone: Any dip toward the 23,394.00 level (50% midpoint) should be viewed as a high-probability accumulation zone. Historically, "minor pauses/touches of previous lows" happen roughly 10% of the time, and they are almost always bought into heavily.
Strategic Summary: The path of least resistance remains UP. Maintain a bullish bias. Look to add positions either on a clean breakout above 24,576.60 or on a structural defense of the 23,394.00 support level, keeping a strict structural invalidation below 23,068.85.
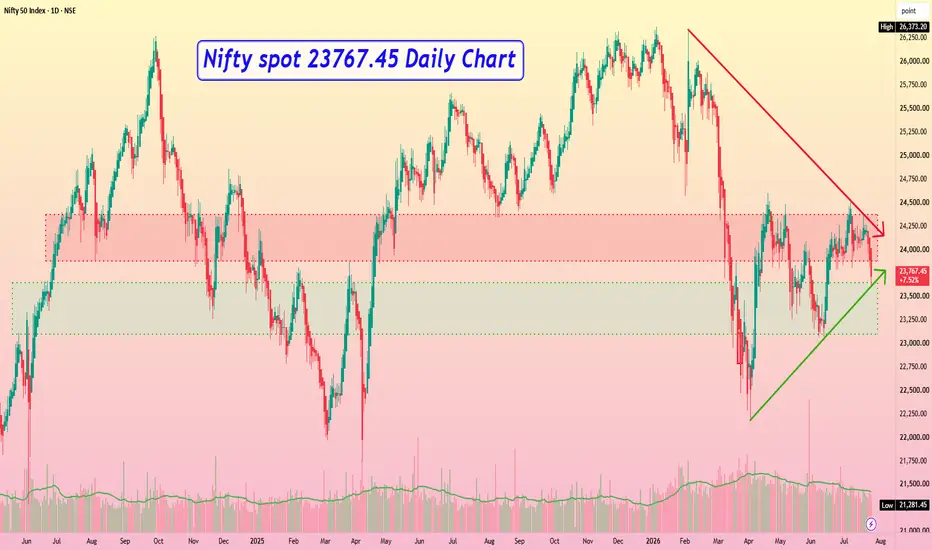
Disclaimer: aliceblueonline.com Symmetrical Triangle + Head & Shoulders | Make or Break ZoneNIFTY 50: Symmetrical Triangle + Head & Shoulders Breakdown | Make or Break Zone
NIFTY is currently trading at a critical technical level where multiple chart structures are overlapping, making the next directional move highly significant.
📉 Bearish Perspective
Price has completed a Head & Shoulders pattern and closed below the neckline.
If the breakdown sustains, it may trigger fresh selling pressure.
Seller's invalidation (strict stop-loss): 24,368 (right shoulder high).
As long as price remains below this level, bears have the short-term advantage.
📈 Bullish Perspective
Price is simultaneously testing the rising trendline of a larger Symmetrical Triangle.
This trendline has acted as dynamic support and could attract buying interest.
Buyer's stop-loss: 23,600 (below the triangle support).
The current setup offers an attractive risk-reward for buyers if support holds.
⚠️ One More Structure That Can't Be Ignored
While the immediate focus is on the Head & Shoulders breakdown and the triangle support, there is another larger structural possibility developing on the chart (highlighted in red). It is still an unconfirmed scenario, but ignoring it could be a mistake. If this broader structure starts playing out, it could lead to a much larger directional move than most traders are currently anticipating. Sometimes the market reveals the bigger picture only after the smaller patterns have played their role.
🎯 Key Levels
Resistance: 24,368
Support: 23,600
My View
This is a make-or-break zone.
A sustained breakdown below the triangle support would strengthen the bearish Head & Shoulders setup and could accelerate the downside.
On the other hand, if buyers defend the support and reclaim recent swing highs, the bearish structure may fail, opening the door for a bullish reversal.
Don't get married to one bias. Respect both scenarios, manage risk, and let price decide the direction.
Never ignore a valid chart structure just because another pattern looks more obvious. The market often respects the bigger structure when the majority is focused on the smaller one.
Trade safe and always wait for confirmation before taking aggressive positions. Nifty 50 Weekly Outlook: Bullish or Bearish Ahead?Disclaimer: This analysis is for educational and informational purposes only. It is based on technical analysis and should not be considered financial or investment advice. Always conduct your own research and use appropriate risk management before making any trading or investment decisions.
The Nifty 50 ended the week on a cautious note, slipping below key short-term moving averages while finding support near an important demand zone around 23,650–23,700. Although buyers managed to defend this level, the overall price structure remains mixed, suggesting that the coming week could be decisive for the index.
This analysis is based purely on price action, moving averages, RSI, volume, and support-resistance levels observed on the Daily, 4-Hour, and 1-Hour charts.
Nifty 50 Technical Overview
The broader market structure continues to show signs of consolidation with a slightly negative bias. The index has repeatedly respected the 23,650–23,700 support zone , but it is also struggling to move above the nearby resistance levels.
On the daily timeframe, Nifty is trading below its short-term moving averages, indicating that bullish momentum has weakened. At the same time, sellers have not yet managed to force a decisive breakdown below support, keeping the market within a defined trading range.
As long as the index remains inside this range, traders may continue to witness volatile two-way price movement.
Daily Chart Analysis
The Daily chart reflects a cautious outlook.
Key observations include:
Nifty continues to hold above the 23,650–23,700 support zone.
Price is trading below important short-term moving averages, indicating near-term weakness.
The Relative Strength Index (RSI) remains below the 50 mark, suggesting momentum currently favors the sellers.
The longer-term trend remains neutral as the index is trading between major support and resistance levels.
Although support has not been broken, buyers will need stronger participation to regain control.
4-Hour Chart Analysis
The 4-hour timeframe provides additional confirmation of weakening momentum.
Current observations:
Price is trading below multiple moving averages.
RSI has moved into the weaker zone, reflecting declining buying strength.
The recent decline has brought the index back to a major horizontal support area.
This support becomes an important reference point for the coming week. A sustained move below it could increase selling pressure, while another successful defense may lead to a technical pullback.
1-Hour Chart Analysis
The shorter timeframe indicates that buyers have attempted a recovery after the recent decline.
However:
The recovery remains limited.
Lower highs continue to be visible.
RSI has bounced from oversold territory but is still below the neutral 50 level.
This suggests that the recent move appears more like a short-term relief bounce rather than confirmation of a fresh uptrend.
Important Support Levels
The following levels may remain important during the upcoming week:
23,700
23,650
23,500
23,200
A sustained move below 23,650 could increase downside momentum toward lower support zones.
Important Resistance Levels
On the upside, traders may watch:
24,000
24,050
24,130
24,350
A strong close above the 24,000–24,050 region may improve short-term market sentiment.
Possible Scenarios for Next Week
Bullish Scenario
The bullish case may strengthen if Nifty:
Holds above the 23,650–23,700 support zone.
Reclaims the 24,000–24,050 resistance area.
Maintains buying momentum with improving price action.
Under this scenario, the index could attempt to move toward higher resistance levels.
Bearish Scenario
The bearish view may strengthen if:
Nifty fails to sustain above support.
Selling pressure increases below 23,650.
Momentum indicators continue to weaken.
In such a scenario, the index could test lower support zones over the coming sessions.
Key Levels to Watch Next Week
Support Resistance
23,700 24,000
23,650 24,050
23,500 24,130
23,200 24,350
Final View
The technical setup suggests that Nifty 50 is currently trading near an important decision zone. While the index has managed to defend the 23,650–23,700 support area, it continues to face resistance near 24,000–24,050.
Until either of these levels is decisively crossed, the market may continue to witness range-bound movement with stock-specific opportunities. Traders may benefit from closely monitoring price action around these key levels rather than anticipating a directional breakout in advance.
As always, confirmation through price action and proper risk management remains essential before making any trading decisions.